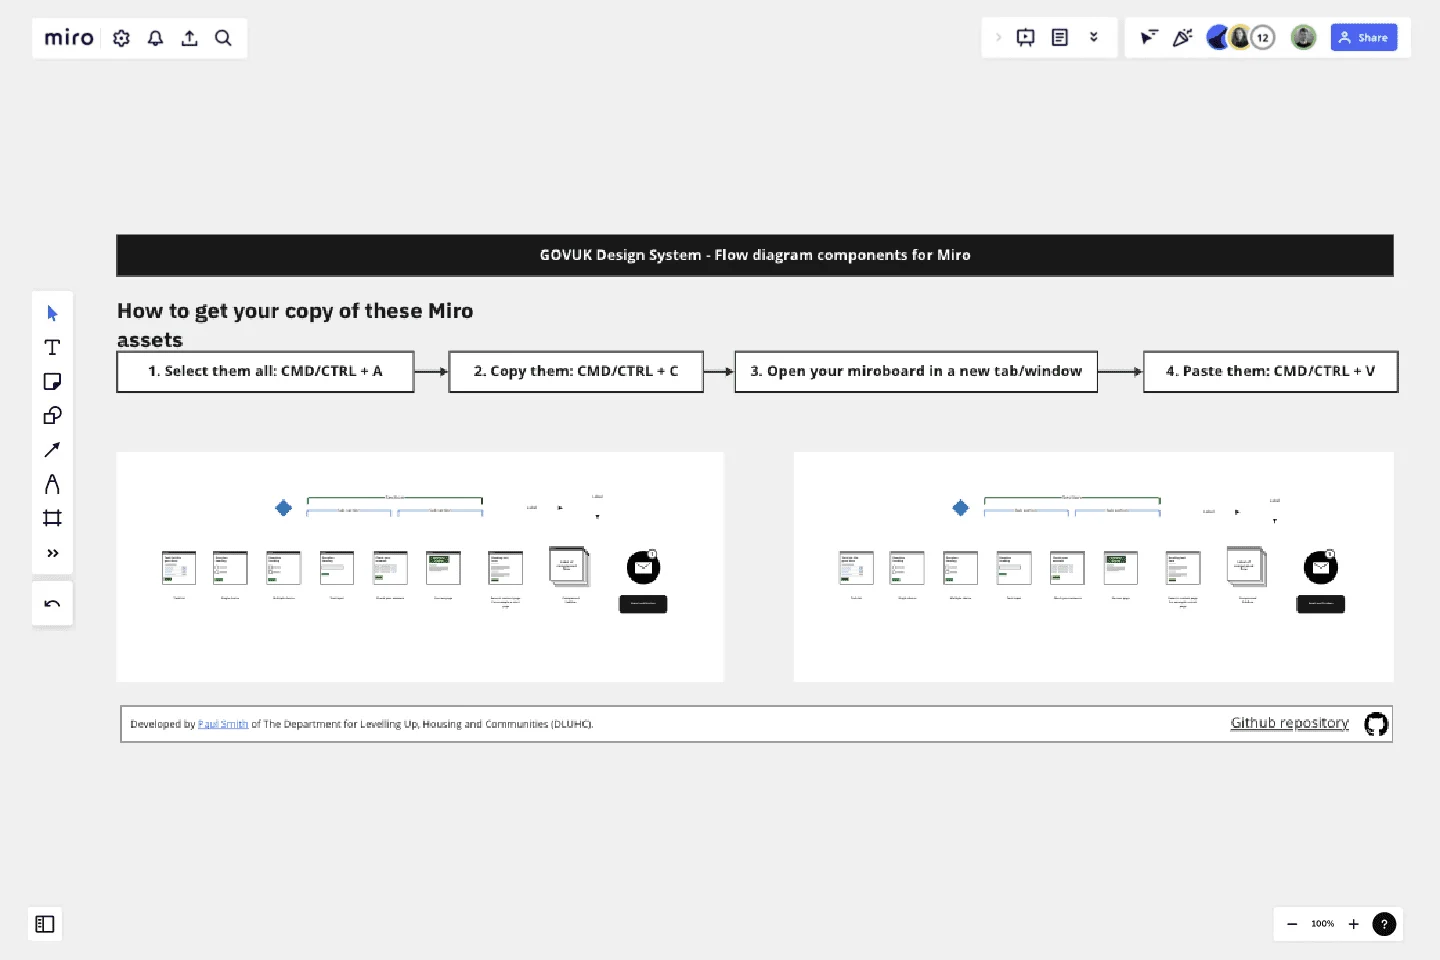
Flow Diagrams
Use this Miro template to create flow diagrams of GOV.UK services or Unbranded services that are based on the GOVUK Design System.
This template is a set of prepared assets for the popular wire-flow diagrams designers working on GOV.UK create.
This template was created by Paul Smith.
Get started with this template right now.
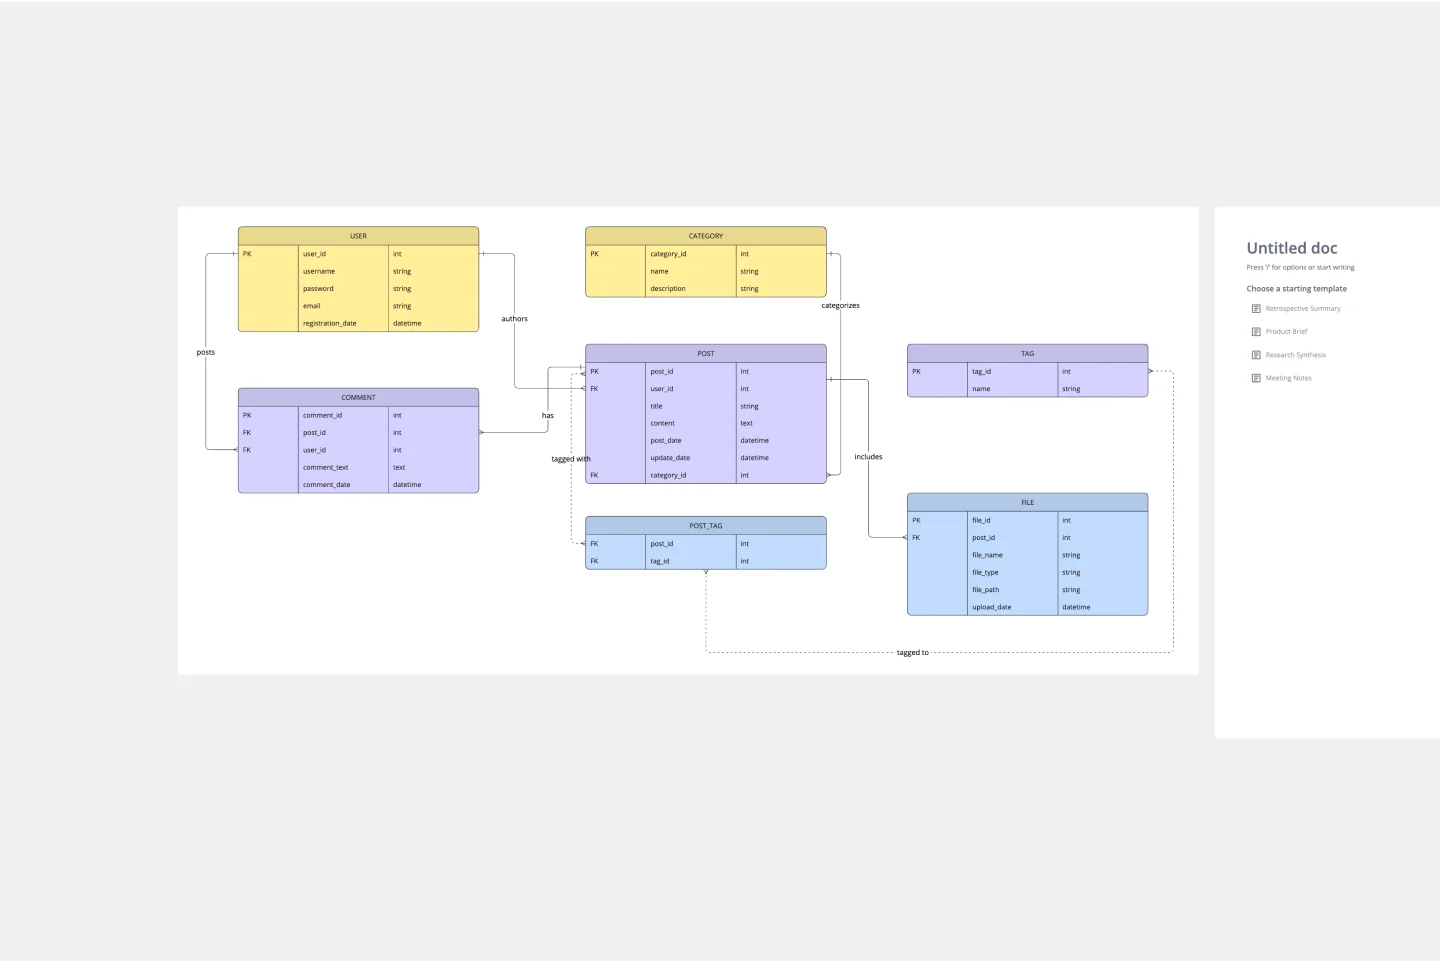
ERD Blogging System Template
Works best for:
ERD
The ERD Blogging System template in Miro efficiently manages and organizes digital content. It features key entities such as User, Post, Comment, Category, Tag, and File, which are essential for managing the creation and publication of blog posts, engaging users through comments, and organizing content via categories and tags. Additionally, it supports media attachments through the File entity, linking them to the relevant content. This template helps streamline the blogging process, making it an invaluable tool for content management and publication.
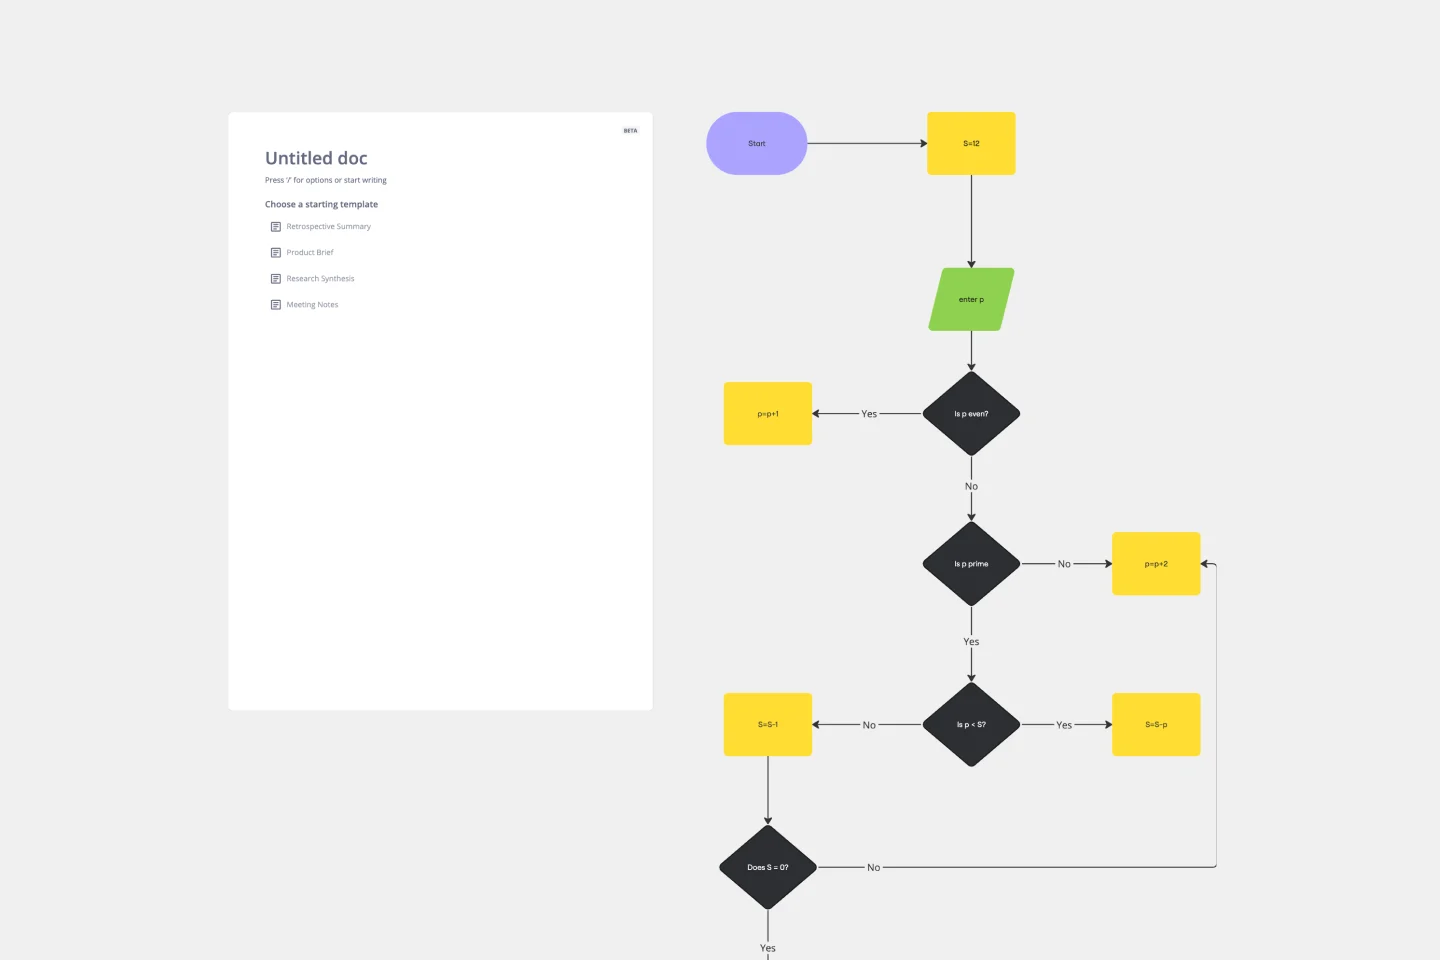
Algorithm Flowchart Template
Works best for:
Flowcharts
The Algorithm Flowchart Template is a useful tool for simplifying the process of creating and understanding complex algorithms. Its pre-structured format makes it easy to lay out each operation and decision point in a clear and easily understandable visual format. This is particularly helpful for explaining intricate processes to team members who may not be as technically proficient in the subject matter. With each step clearly defined within its designated shape, the flowchart promotes clarity and makes it easy to identify the logical flow at a glance. This clarity is the template's most significant advantage, reducing cognitive load and enabling a more inclusive and straightforward approach to discussing and refining algorithmic solutions.
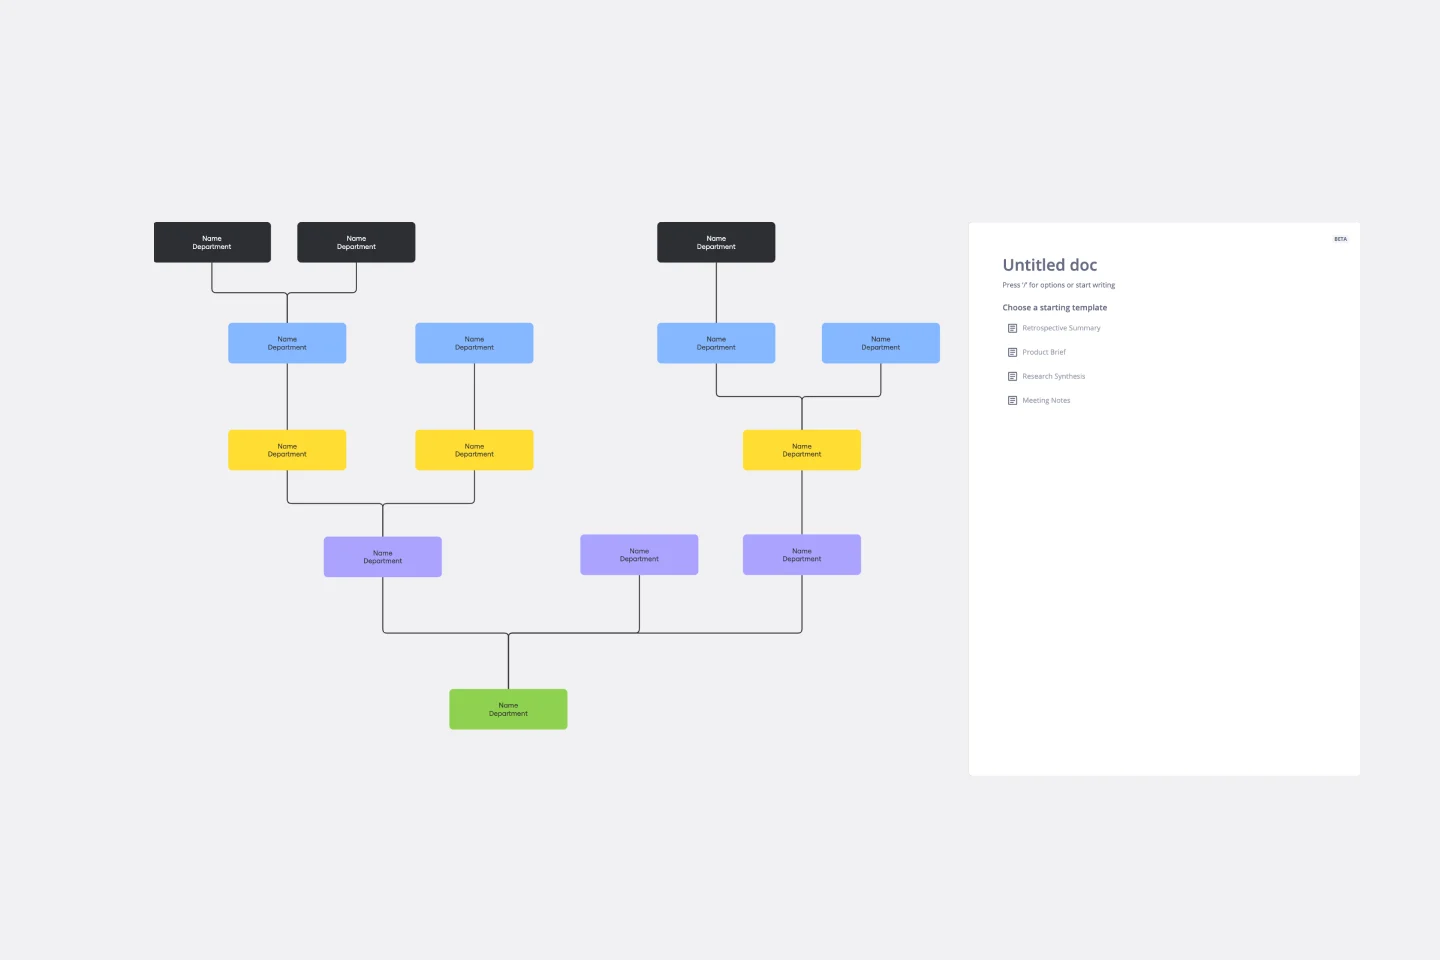
Inverted Org Chart Template
Works best for:
Org Charts, Organizational Design
The Inverted Org Chart Template is a tool that reimagines the traditional hierarchical model by placing frontline employees at the top of the organizational structure. This innovative approach highlights the crucial role played by those who interact with customers directly, ensuring that their insights and contributions are not only recognized but also celebrated. One of the key advantages of this template is that it fosters a feedback-driven environment. Prioritizing frontline workers promotes a culture where valuable insights from the ground can quickly reach the top of the hierarchy, streamlining decision-making processes and ensuring that strategies are based on real-world experiences.
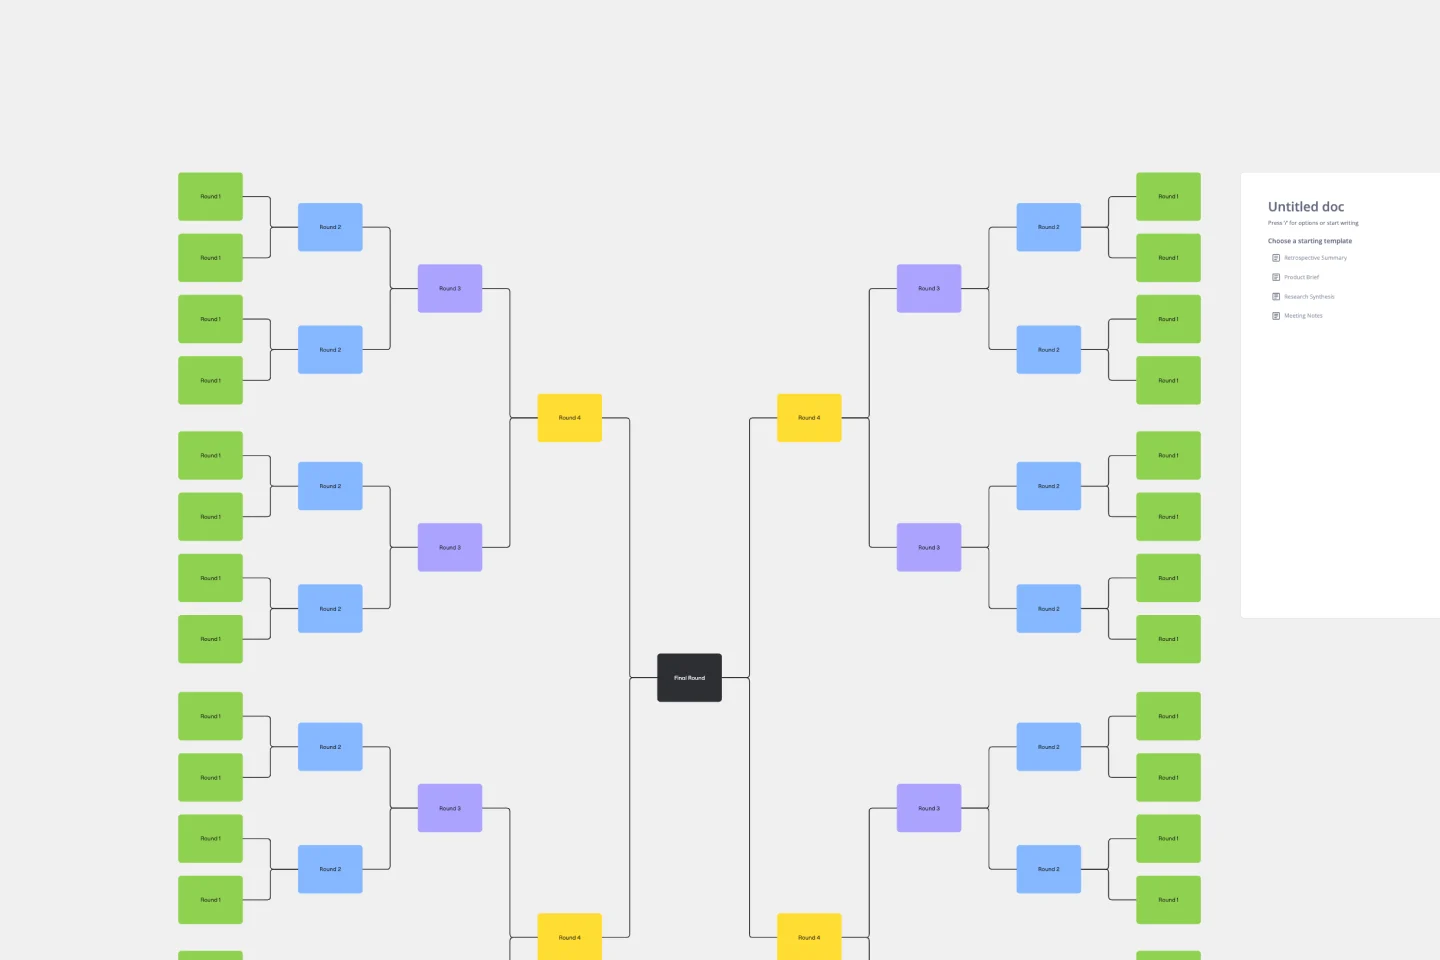
Bracket Template
Works best for:
Diagramming
The Bracket Template is a dynamic visualization tool that helps to organize and rank ideas, entities, or teams in a sequential and competitive manner. It is structured like a tree, starting with multiple entries on either side, which then face off in successive rounds, leading to a single winner or conclusion. One of its standout benefits is its ability to simplify complex decision-making processes. Breaking down choices into smaller, head-to-head comparisons, makes the path to a final decision clearer, ensuring clarity and fostering engagement among participants. Moreover, the Bracket Template is particularly useful when there are multiple options to consider and when there is a need to compare and contrast those options. It is an effective way to streamline decision-making, making it easier and more efficient.
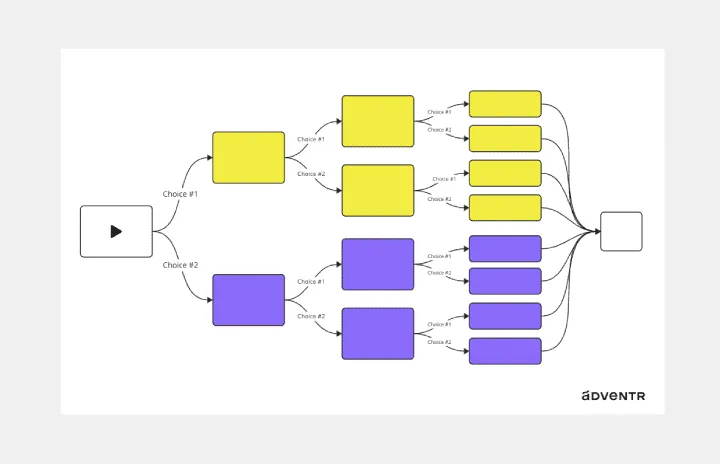
Interactive Video Storyboard Canvas
Works best for:
Diagramming
The Interactive Video Storyboard Canvas template offers a visual framework for planning and storyboarding interactive video content. It provides elements for outlining scenes, defining interactions, and visualizing user pathways. This template enables teams to design engaging and immersive video experiences, facilitating collaboration and alignment among content creators and stakeholders. By promoting creativity and interactivity, the Interactive Video Storyboard Canvas empowers teams to create compelling video narratives that captivate audiences and drive engagement.
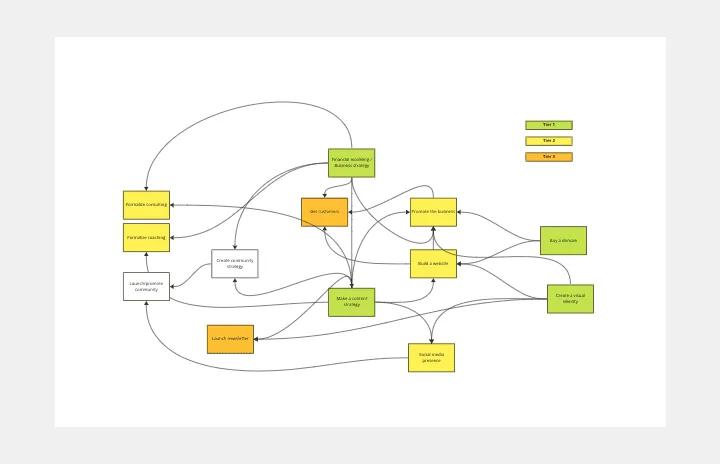
Interrelationship Diagram
Works best for:
Diagramming
The Interrelationship Diagram template is a visual tool for analyzing and illustrating complex relationships between variables or elements within a system. It provides a structured framework for mapping out connections, dependencies, and interactions. This template enables teams to visualize patterns, identify causal relationships, and uncover insights into system behavior. By promoting systems thinking and understanding of interdependencies, the Interrelationship Diagram empowers organizations to make informed decisions and drive effective solutions to complex problems.