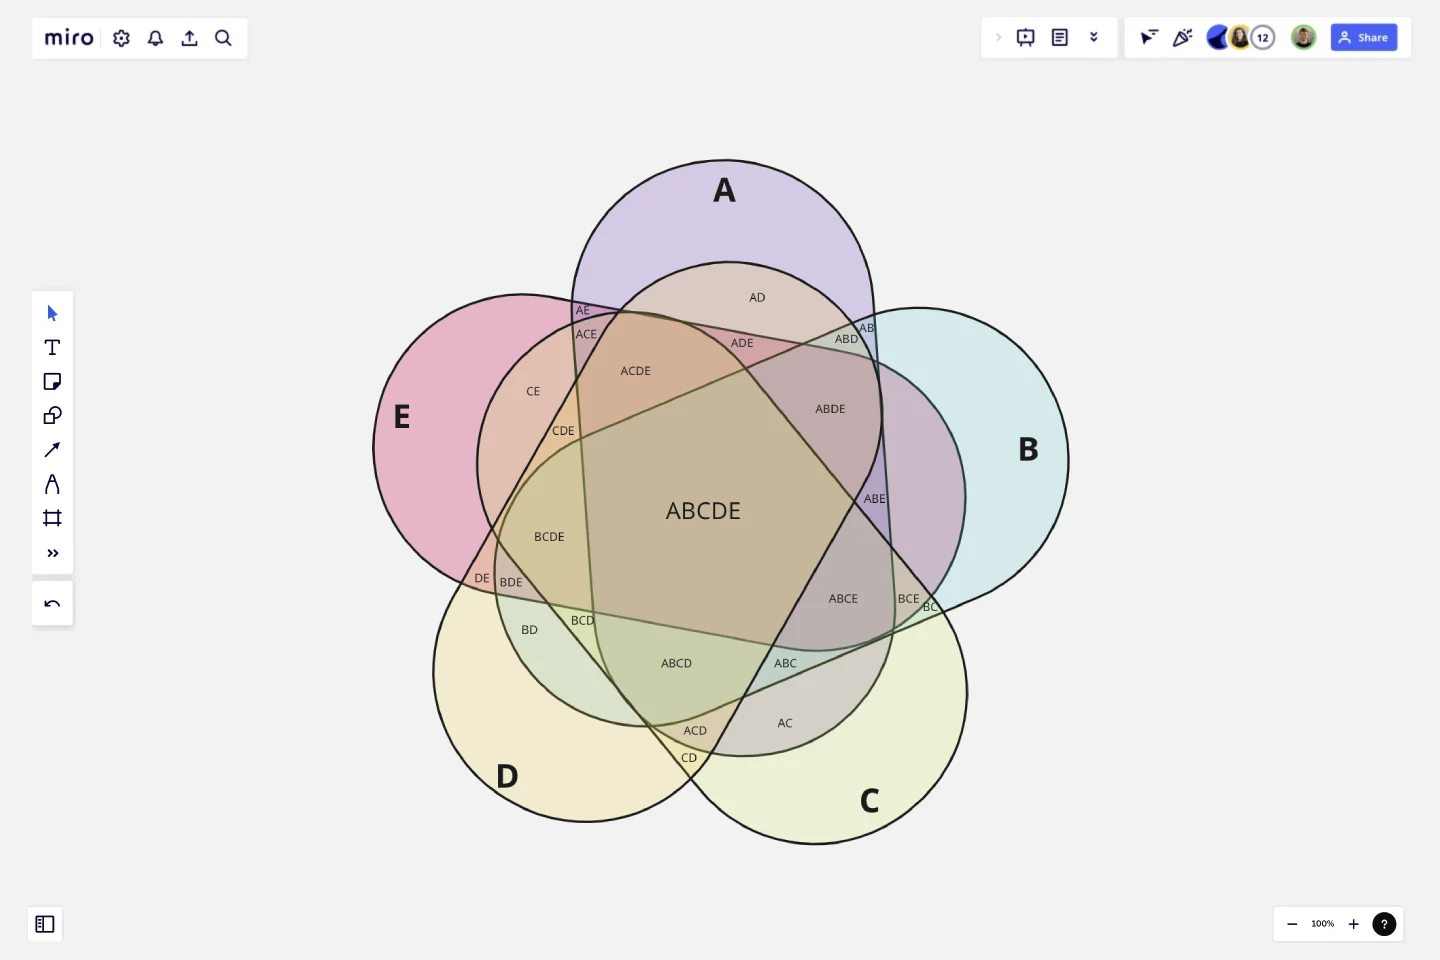
5-Set Venn Diagram
Five-set Venn diagram using congruent ellipses in a radially symmetrical arrangement devised by Branko Grünbaum.
These can help anyone in a role where there is need to visually see commonality between 5 items. E.g seeing what roles and responsibilities a team of five have in common.
This template was created by Sam.
Get started with this template right now.
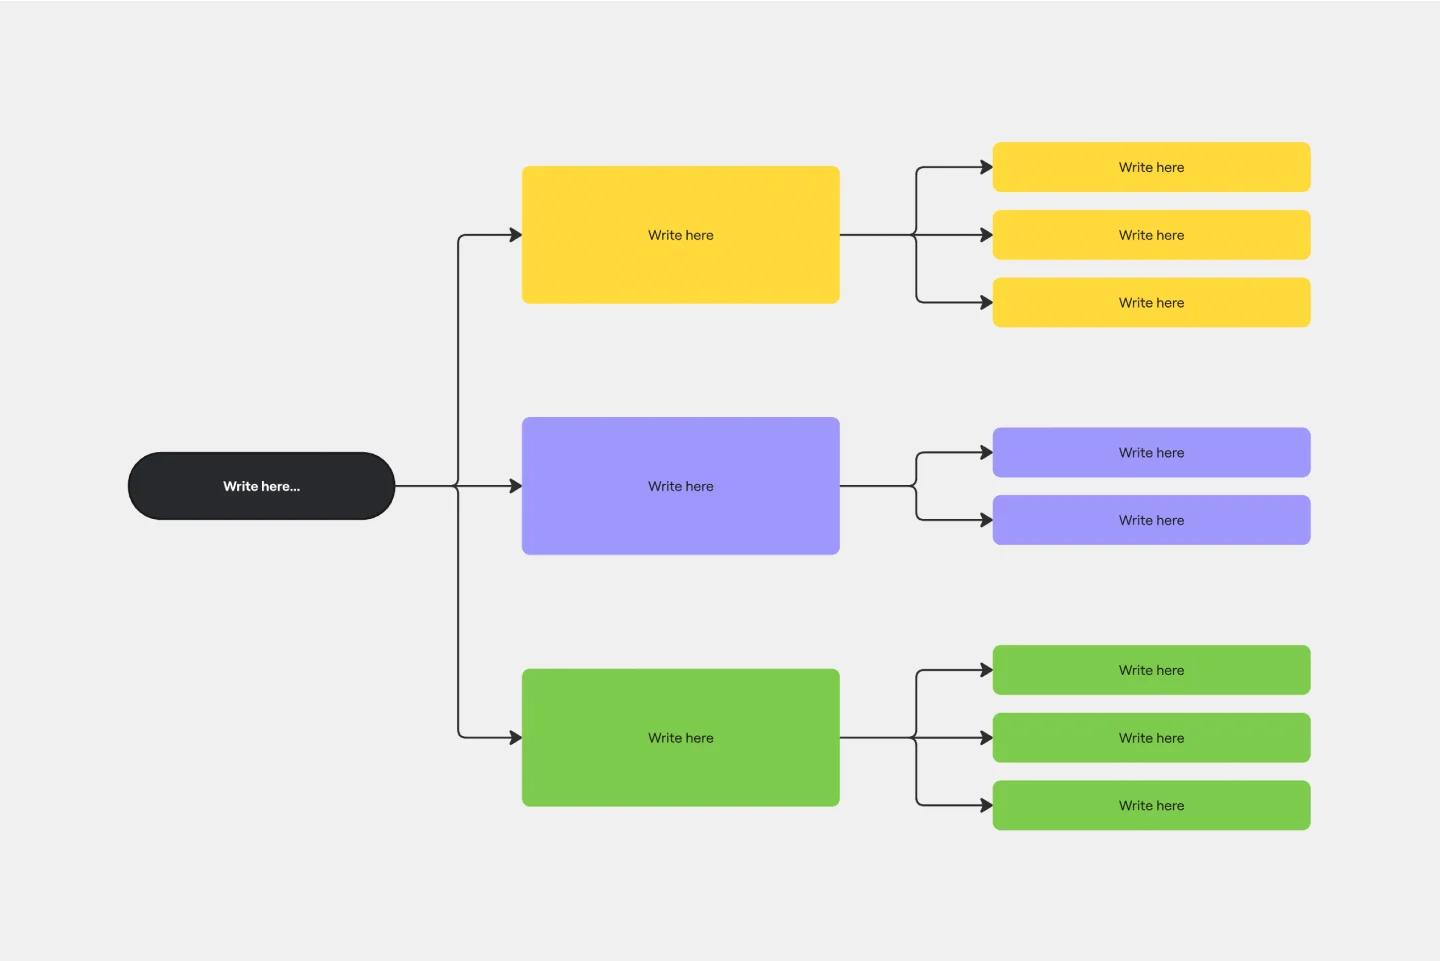
Brace Map Template
Works best for:
Diagramming, Planning
Transform your brainstorming and planning tasks with Miro's Brace Map Template. This powerful visual thinking tool clarifies complex concepts by creating a visual hierarchy that organizes each element precisely. The central idea connects seamlessly to sub-elements through intuitive braces, providing an easily understandable framework. This clarity enhances individual understanding and fosters collaborative efforts, allowing teams to navigate complex ideas with precision and coherence. The Brace Map Template will enable you to organize your thoughts efficiently and solve complexities visually.
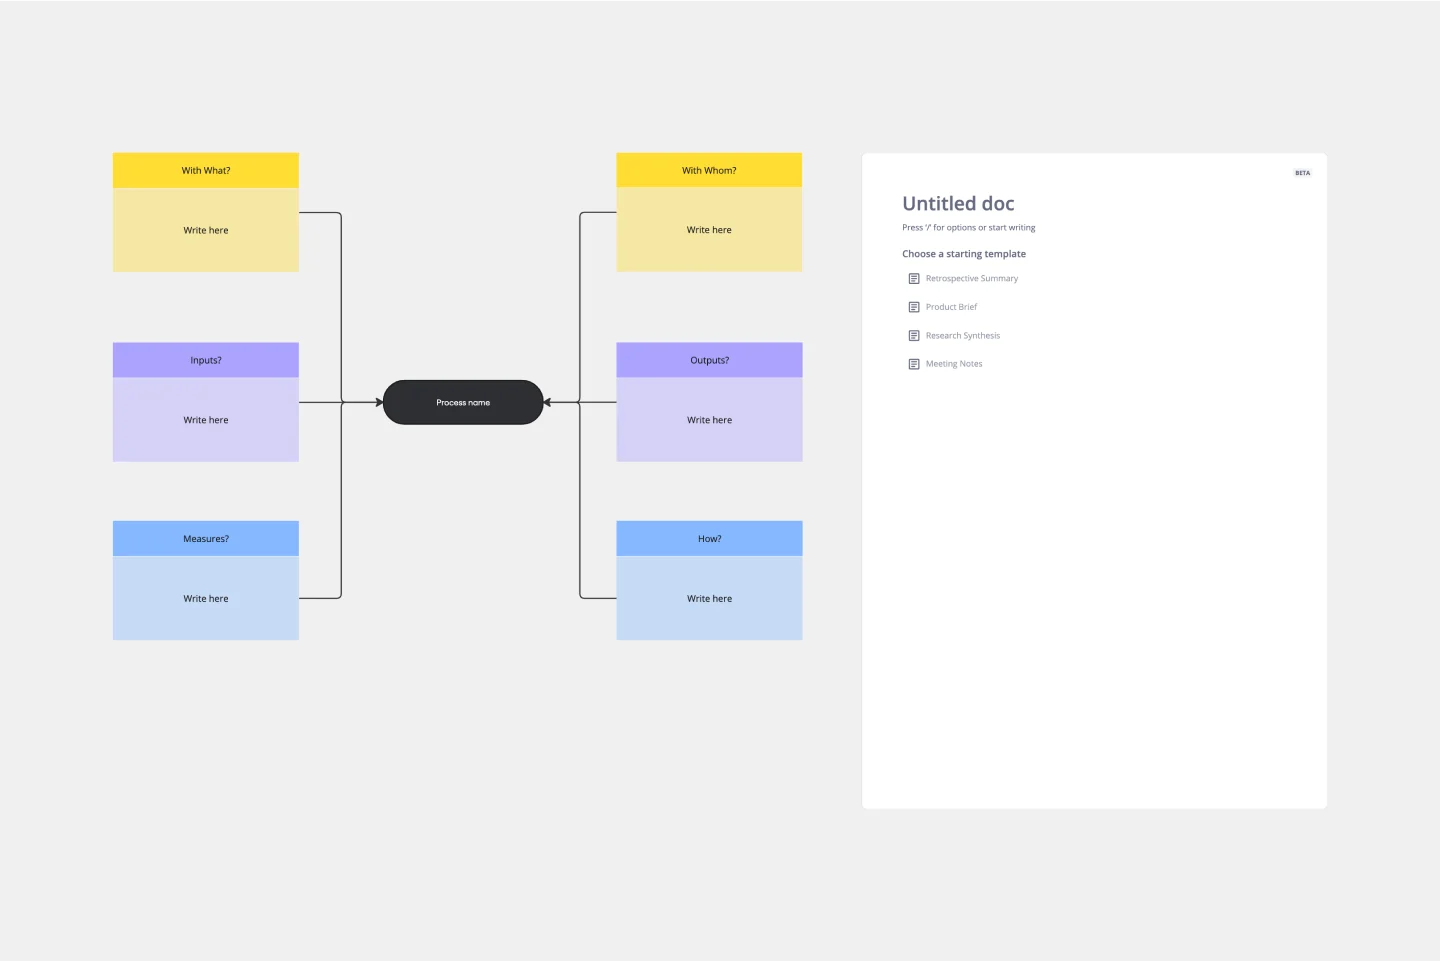
Turtle Diagram Template
Works best for:
Diagramming
The Turtle Diagram Template is an essential tool for capturing the essence of a process. It offers many benefits, but one stands out: it fosters clear and comprehensive communication within teams. By breaking down processes into digestible components, the template creates a common ground for discussion. It helps team members unfamiliar with certain processes or from different departments collaborate effectively by ensuring everyone's on the same page about the inputs, outputs, roles, resources, and procedures. This is crucial for organizations that aim to maintain coherence in quality management practices and drive collective efforts toward operational excellence.
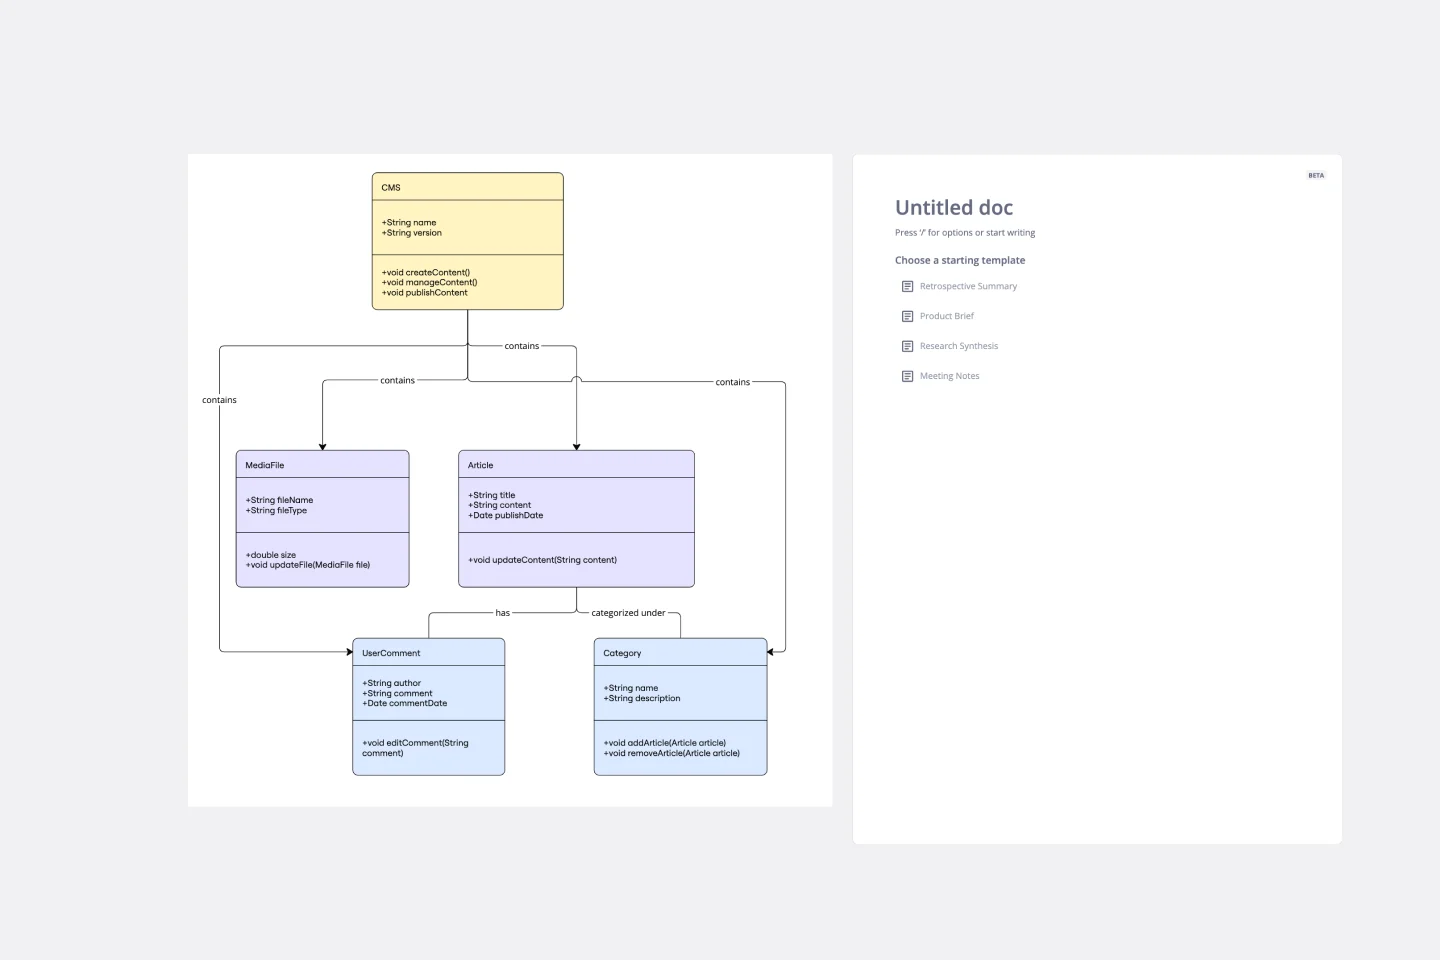
UML Class Content Management System (CMS) Template
Works best for:
UML
The UML Class Content Management System CMS Template simplifies documenting and designing the architecture of a Content Management System. It allows for the creation of UML class diagrams to visualize the structure of a CMS. Teams can efficiently map out key classes and their interactions, such as how users create, manage, and publish digital content. The template's integration into Miro's collaborative platform allows for real-time teamwork, customization, and easy sharing of feedback. This streamlines the documentation process and is valuable for software development projects aiming to develop or refine a CMS.
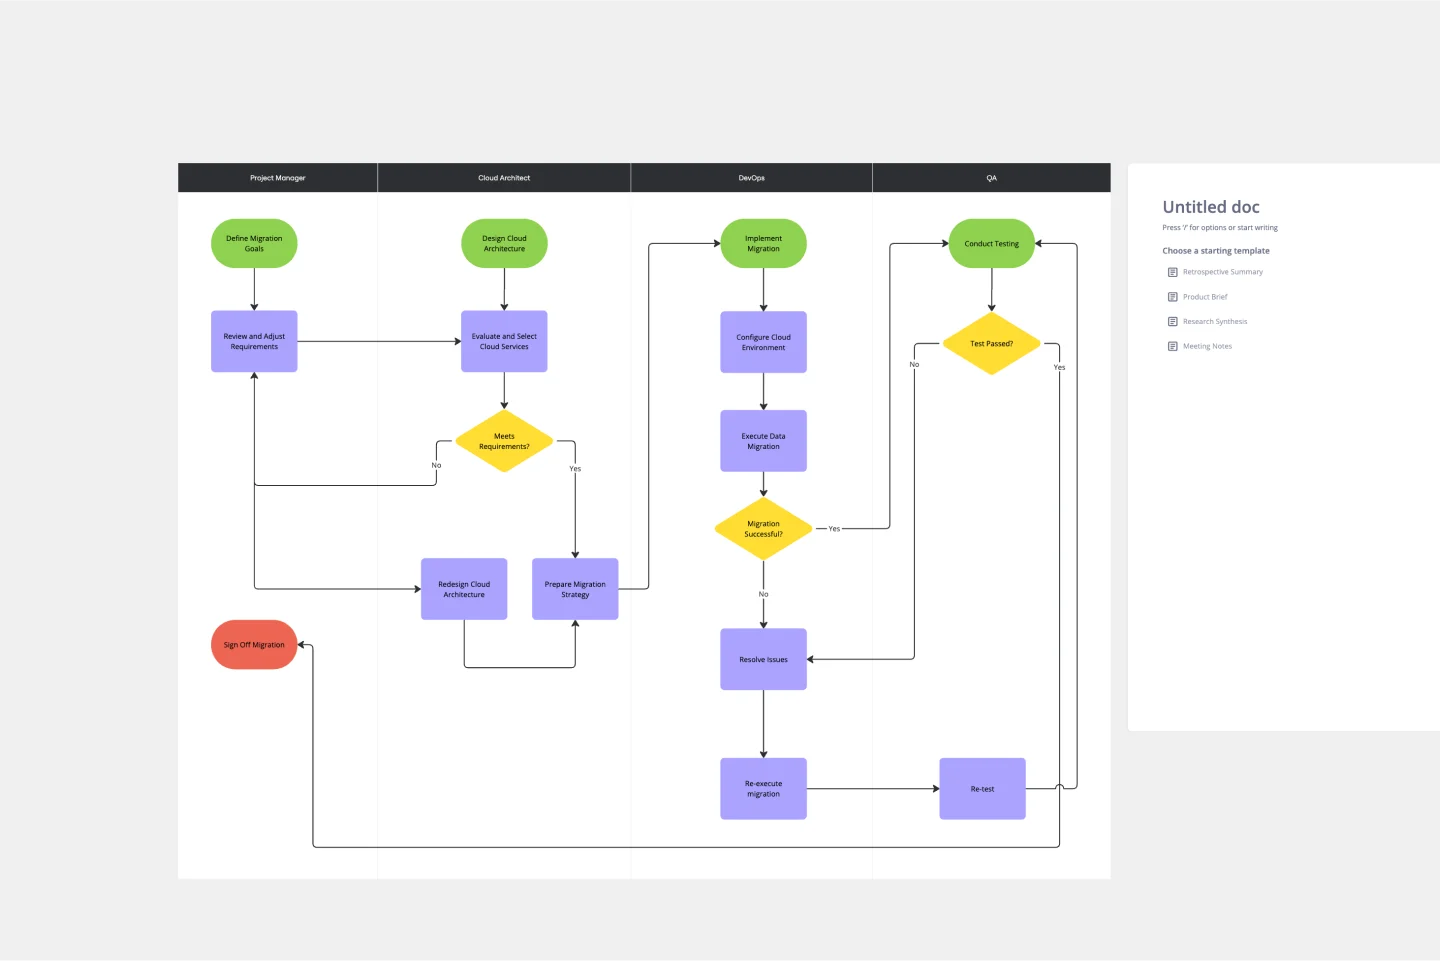
On-Premise to Cloud Migration Process Flowchart Template
Works best for:
Flowcharts
The On-Premise to Cloud Migration Process Flowchart Template is a strategic tool designed to streamline the transition from traditional on-premise systems to more flexible, scalable cloud-based solutions. This template acts as a visual roadmap, guiding teams through each phase of the migration process with clarity and precision. By breaking down the migration into manageable steps, it ensures a comprehensive approach, minimizing risks and aligning with best practices for cloud adoption.
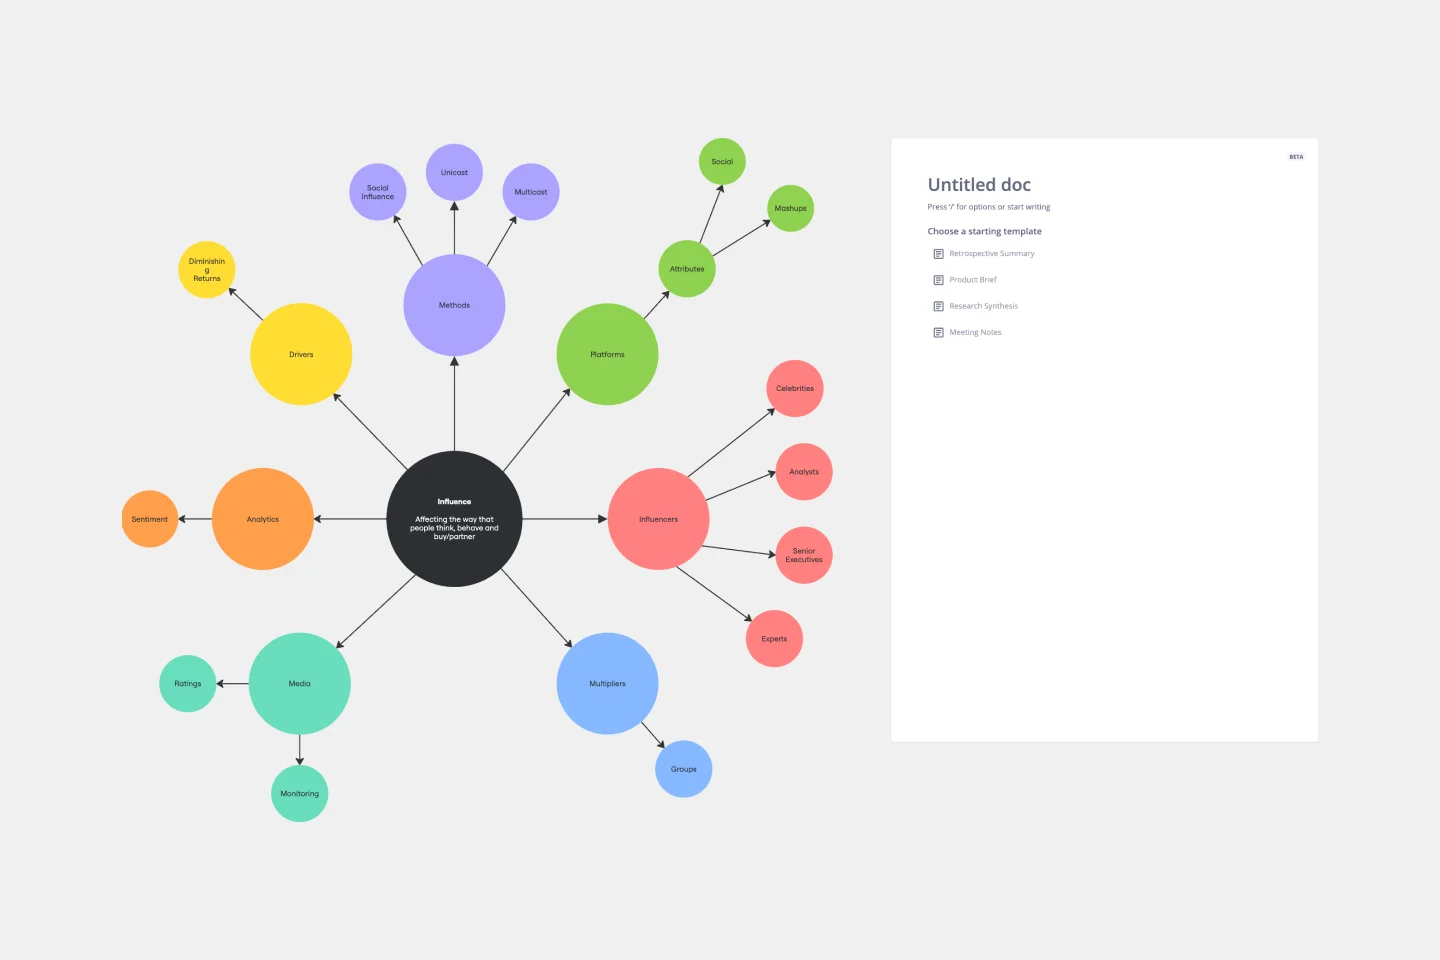
Cluster Diagram Template
Works best for:
Diagramming
The Cluster Diagram Template is a valuable tool for organizing and connecting ideas, concepts, and information in a visually compelling and coherent manner. The template's design centers on grouping related ideas around a core concept, creating a transparent and hierarchical structure. This clustering not only aids in breaking down complex information into manageable segments but also significantly enhances the process of idea generation and brainstorming. A structured yet flexible visual framework encourages deeper engagement and more precise understanding, making it an essential asset for teams and people looking to bring order to their creative and analytical processes.
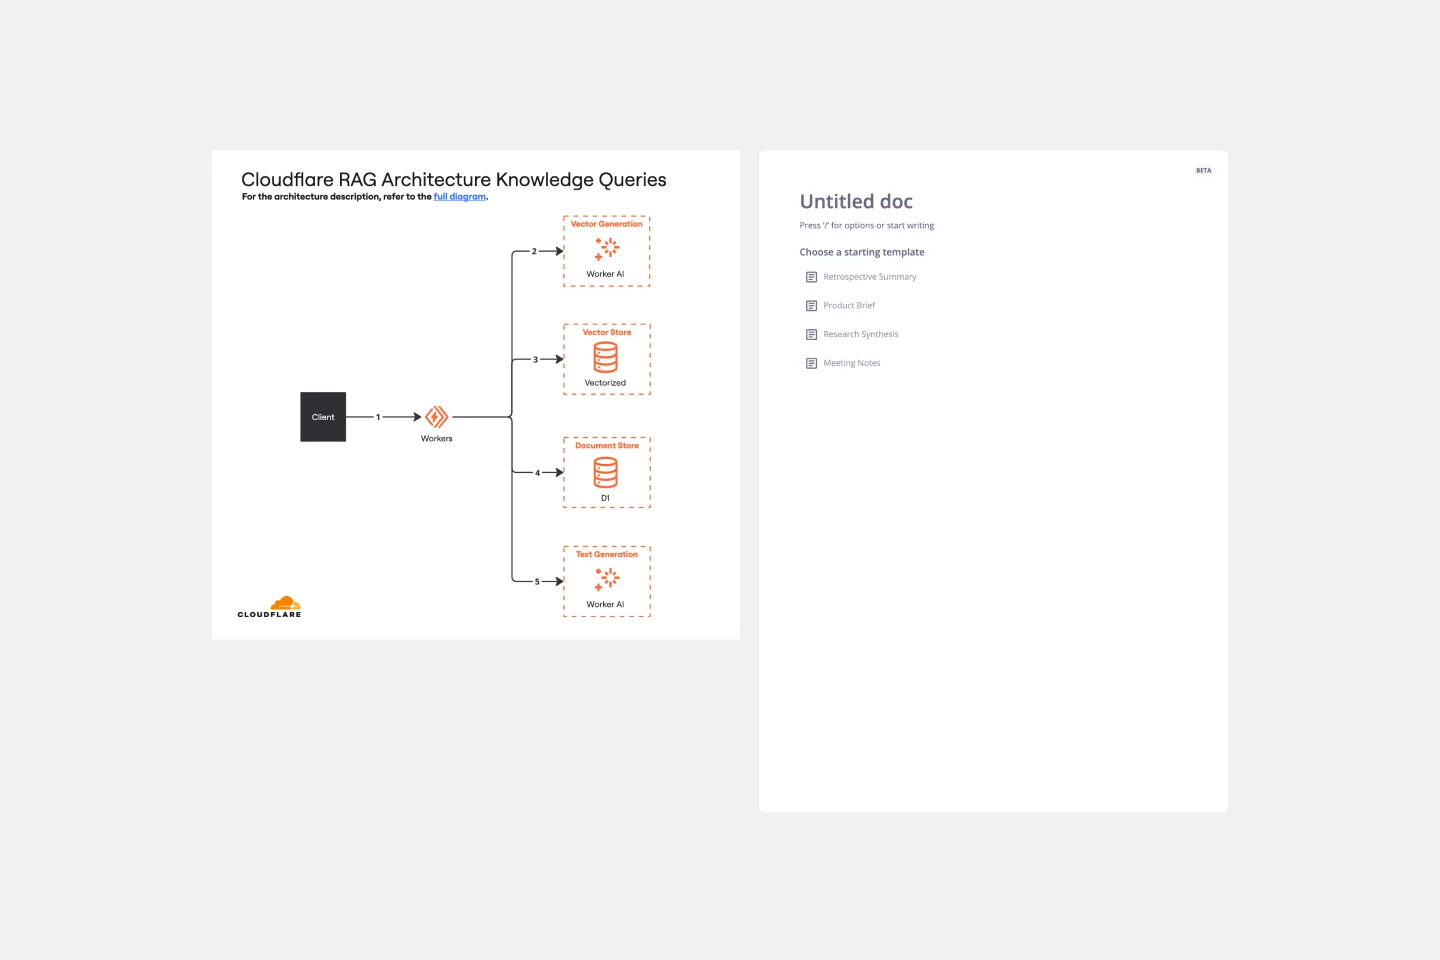
Cloudflare RAG Architecture Knowledge Queries Template
The Cloudflare RAG Architecture Knowledge Queries template is a cutting-edge tool designed to streamline the process of diagramming and understanding the intricate architecture of Cloudflare's Retrieval Augmented Generation (RAG) system. This template is a boon for teams aiming to visualize, query, and optimize Cloudflare's infrastructure collaboratively.