Fishbone RCA
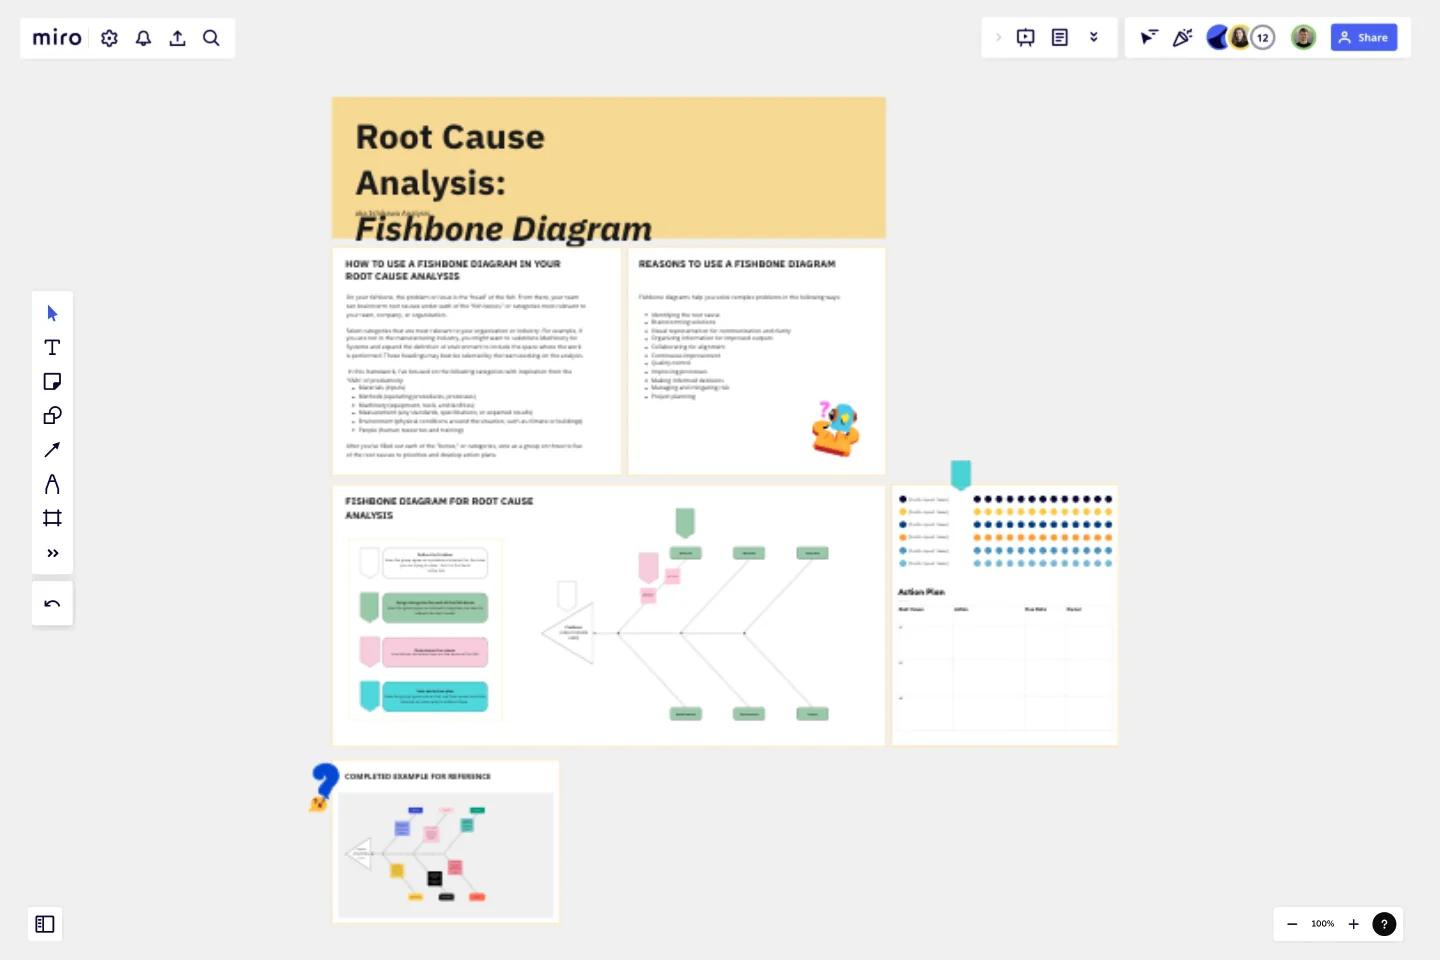
Organizing your team with this Fishbone Diagram template in your next Root Cause Analysis is a systematic way to identify and solve problems.
Also known as the Ishikawa diagram, this technique provides a visual approach to understanding the root causes of complicated issues.
Overview of the Root Cause Analysis: Fish Diagram Template
The Fish Diagram is a visual representation of causal relationships, designed to uncover the underlying factors that contribute to a problem. Named after its resemblance to a fish's skeleton, the diagram segments a problem’s causes into different categories, such as People, Process, Equipment, Materials, Environment, and Management. By mapping out these categories, the Fish Diagram offers a holistic view of the issue, helping your team to identify the root cause.
Benefits of the Fish Diagram Template
Visual clarity: The Fish Diagram presents causes and their relationships visually, which facilitates a clear understanding of complex issues for individuals and teams.
Comprehensive analysis: The segmented categories ensure that all potential causes are explored, preventing oversight and leading to a thorough analysis.
Interdisciplinary collaboration: The diagram's structure encourages cross-functional collaboration, bringing together diverse expertise to address the issue.
Identifying root causes: By systematically mapping causes, the Fish Diagram enables the identification of the central issue, resulting in targeted solutions.
How to use the Fish Diagram Methodology
Define the problem: Begin by clearly defining the problem you're analyzing. This precise definition serves as a reference point throughout the process.
Work within the Fish Diagram: Attach your problem statement at the "head" of the fish within the template. Then, select relevant categories to label the "bones" extending from the spine (People, Process, etc.).
Brainstorm causes: Collaboratively brainstorm potential causes within each category, attaching them as branches to the corresponding diagonal lines.
Analyze relationships: Evaluate how causes within different categories might interact or contribute to the problem, adding sub-branches as needed.
Identify the root cause: Examine the diagram to identify the underlying factors that appear most influential. This will help you pinpoint the root cause.
Develop solutions: Based on the root cause, devise strategies to address the issue effectively. Ensure that solutions address the specific categories and sub-causes highlighted on the diagram.
Final thoughts
Whether you're working on a manufacturing issue, a project delay, the solution to a change request or a customer service concern, the Fish Diagram empowers you to see the bigger picture and take targeted action. With this Fish Diagram, you can steer your problem-solving efforts toward effective and lasting solutions with your team.
This templates was created by Project Management GameBoard.
Get started with this template right now.
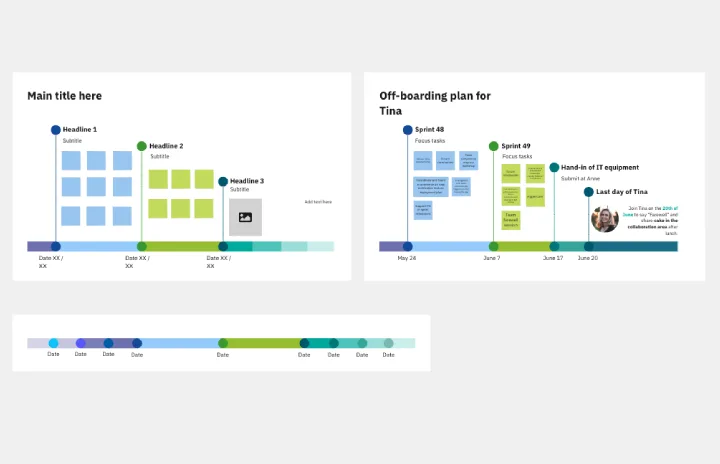
Timeline Design
Works best for:
Timeline, Planning
The Timeline Design template is perfect for creating visually engaging timelines. It helps you showcase project milestones, deadlines, and important events in a clear and attractive format. Ideal for presentations and reports, this template ensures your timeline is both informative and visually appealing.
Timeline Meeting
Works best for:
Timeline, Planning
The Timeline Meeting template is tailored for planning and conducting meetings with a focus on time management. It helps you set clear agendas, allocate time for each topic, and keep track of discussion points. This template ensures your meetings are productive and stay on track.
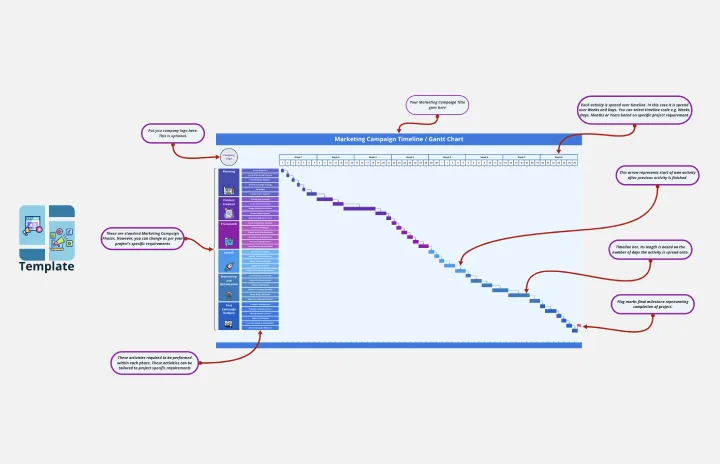
Marketing Campaign Timeline
Works best for:
Timeline, Planning
Plan and execute your marketing strategies seamlessly with the Marketing Campaign Timeline template. This tool allows you to map out every stage of your campaign, from planning to launch and analysis. Visualize key milestones, set deadlines, and track progress to ensure your marketing efforts are well-coordinated and effective. Ideal for marketing teams looking to optimize their campaign management.
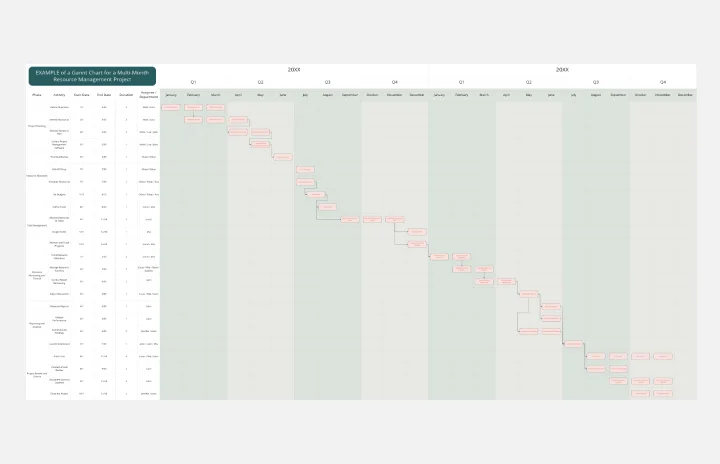
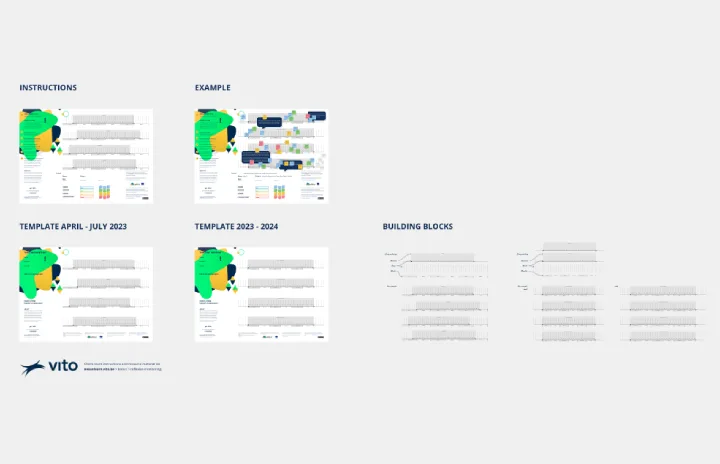
Resource Management Gantt Chart
Works best for:
Strategy, Planning
Efficient resource allocation is crucial for project success. The Resource Management Gantt Chart template helps you plan and manage your resources effectively. Use it to track the availability and allocation of personnel, equipment, and materials throughout your project. This template ensures resources are optimally utilized, reducing waste and avoiding delays, providing a clear overview of assignments and workload balance.
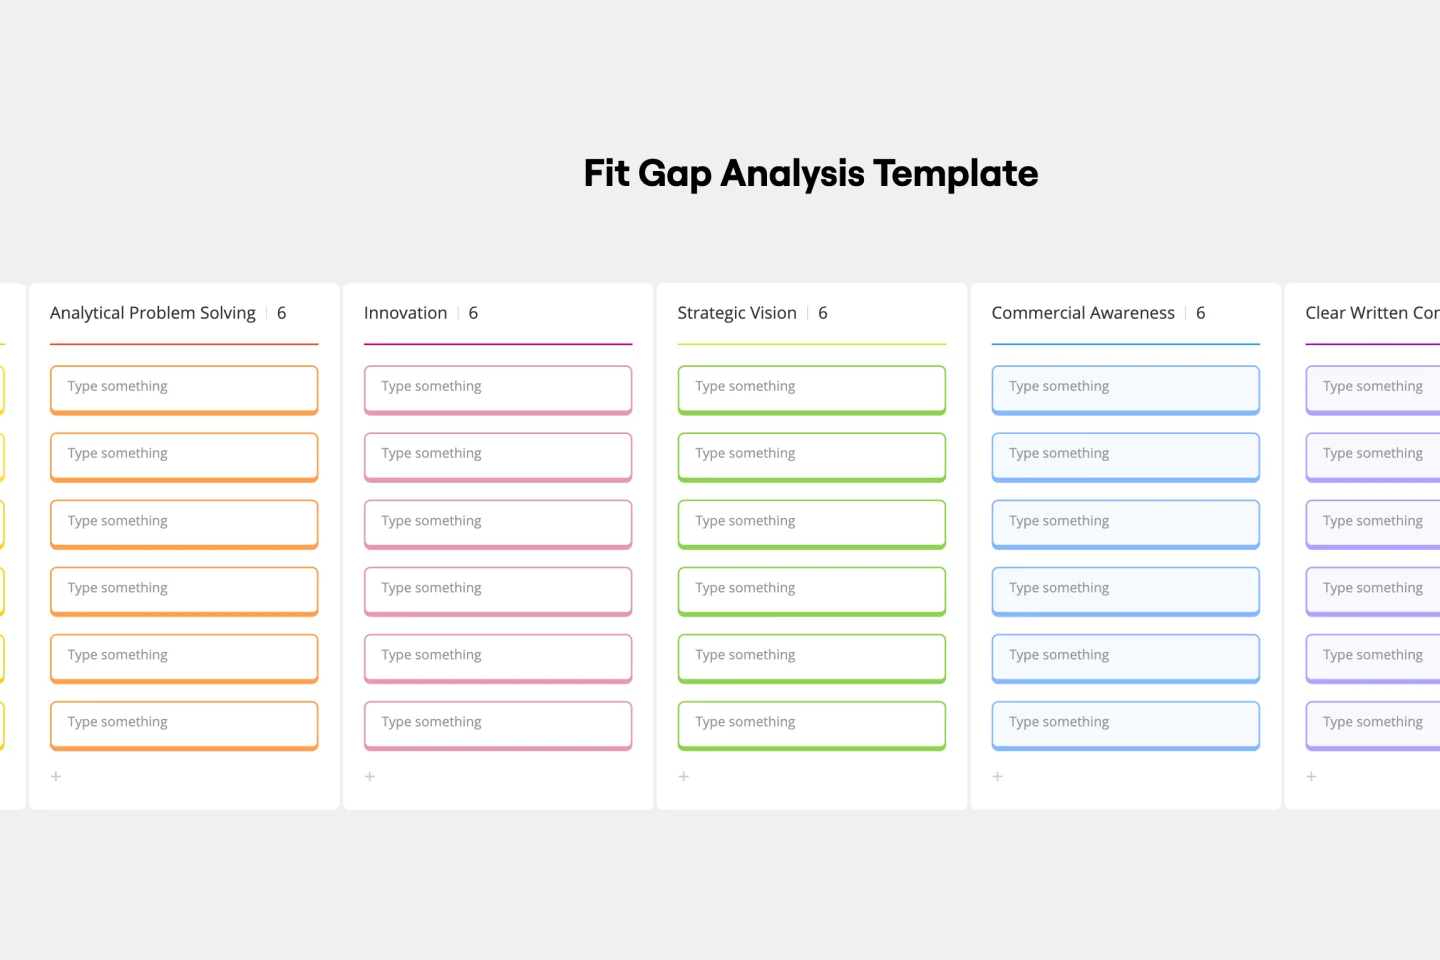
Fit Gap Analysis Template
Works best for:
Strategy, Planning, Management
The Fit Gap Analysis Template is a strategic tool designed to help teams and organizations identify discrepancies between their current state and desired outcomes. By visualizing these gaps, it offers a clear roadmap for improvement, allowing for a focused alignment of resources. One significant benefit of using this template is enhanced clarity; teams can visually discern where they currently stand and plot a precise path toward their goals, ensuring efficient decision-making and effective resource allocation.
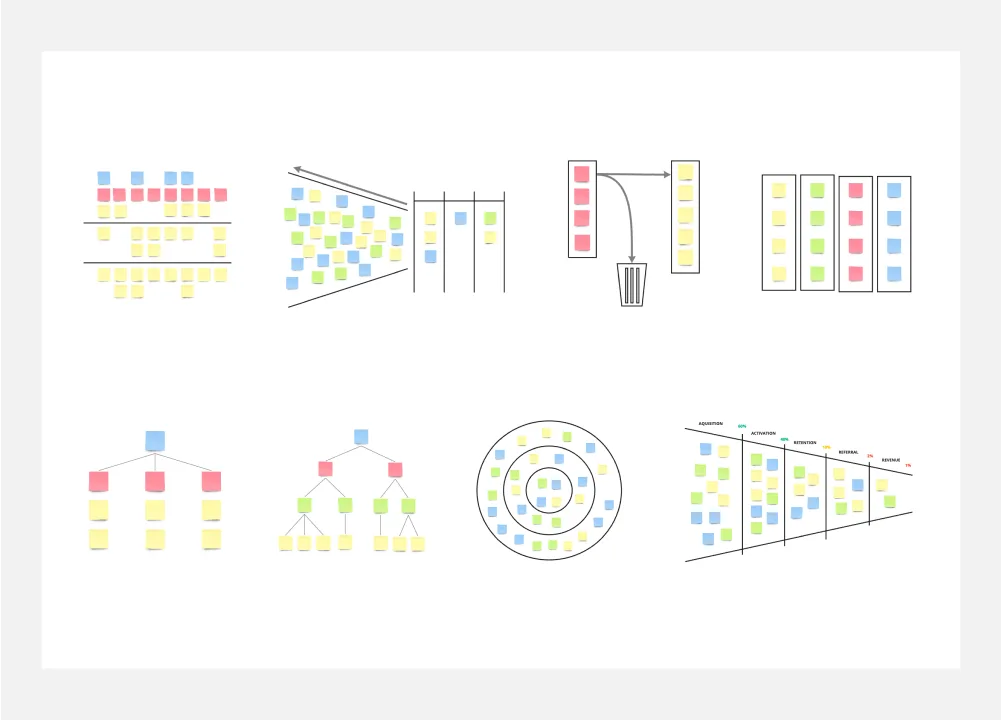
8 Different Ways to Organize Your Backlog
Works best for:
Agile
Explore 8 different techniques for managing and prioritizing work effectively with this template. From prioritization matrices to story mapping, it offers a comprehensive overview of backlog management strategies. By understanding the strengths and limitations of each approach, teams can tailor their backlog organization to optimize workflow, empowering teams to stay organized and focused on delivering value.