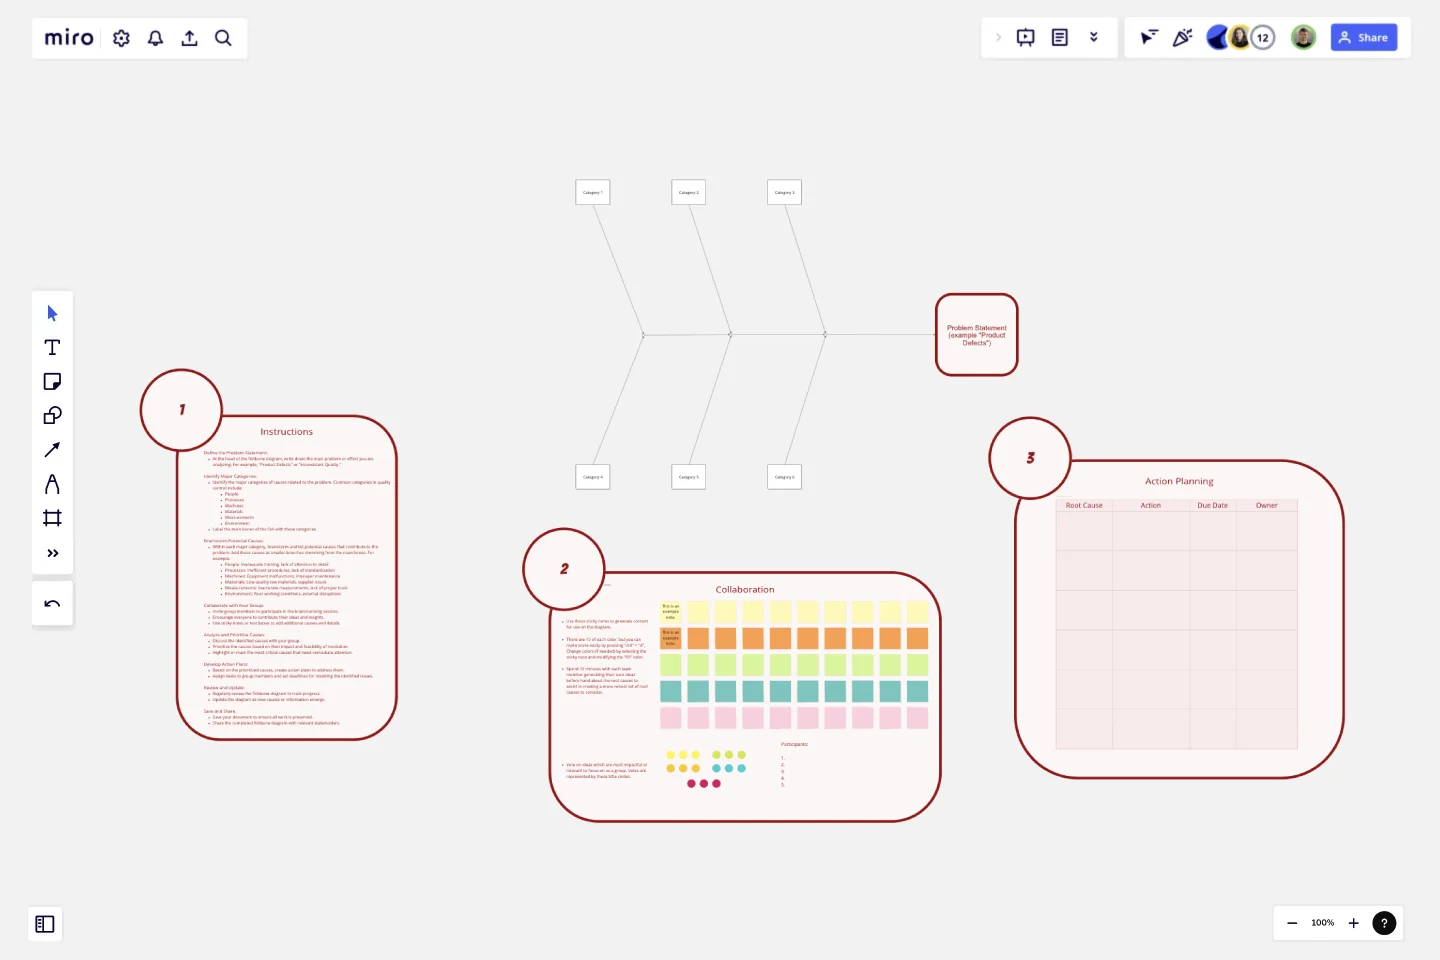
Fishbone Diagram for Quality Control
The Fishbone Diagram for Quality Control template is a specialized tool designed to help quality control teams systematically analyze and identify the root causes of quality-related issues.
Here’s why you should consider using this template:
Key Features:
Problem-Centric Design:
The diagram starts with a clear definition of the problem or effect you are addressing, such as "Product Defects" or "Inconsistent Quality," providing a focused approach to problem-solving.
Major Categories:
The template includes predefined categories relevant to quality control, such as People, Processes, Machines, Materials, Measurements, and Environment. These categories help in organizing potential causes systematically.
Structured Brainstorming:
Each category has branches for listing potential causes, encouraging thorough brainstorming and ensuring that no aspect of the quality control process is overlooked.
Collaborative Framework:
The template is designed for team collaboration, allowing multiple users to contribute their insights and ideas in a structured manner, fostering a comprehensive analysis.
Visual Clarity:
The fishbone (Ishikawa) diagram's visual structure makes it easy to understand the relationships between the problem and its potential causes, facilitating better communication and discussion among team members.
Why Use This Template?
Systematic Problem Analysis:
The Fishbone Diagram for Quality Control template helps in systematically breaking down complex problems into manageable parts, making it easier to identify root causes.
Holistic View:
By considering multiple categories, the template ensures that all possible aspects of the quality control process are examined, leading to a more thorough investigation.
Improved Collaboration:
The template promotes team collaboration, ensuring that diverse perspectives are considered, which can lead to more innovative solutions and a better understanding of the problem.
Enhanced Decision-Making:
The structured approach of the template aids in prioritizing causes based on their impact, helping teams focus on the most critical areas first, thus improving decision-making and action planning.
Effective Communication:
The visual nature of the fishbone diagram makes it easier to communicate findings and strategies to stakeholders, ensuring that everyone is on the same page.
By using the Fishbone Diagram for Quality Control template, teams can effectively analyze quality control issues, identify root causes, and develop targeted action plans to improve product quality and process consistency.
This template was created by Anthony.
Get started with this template right now.
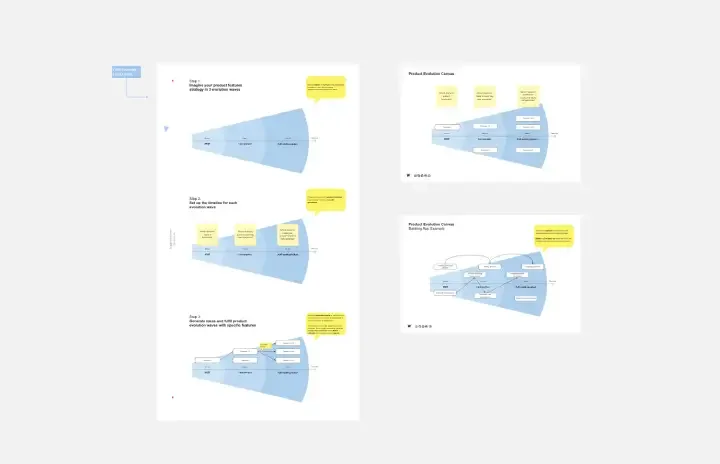
Product Evolution Canvas
Works best for:
Product Management, Planning
The Product Evolution Canvas template aids product managers in planning and executing product evolution strategies. By mapping out current product features, identifying areas for improvement, and setting evolution goals, this template guides product evolution efforts. With sections for analyzing user feedback, prioritizing enhancements, and tracking progress, it facilitates iterative product development and enhancement cycles. This template serves as a roadmap for evolving products to meet evolving customer needs and market demands.
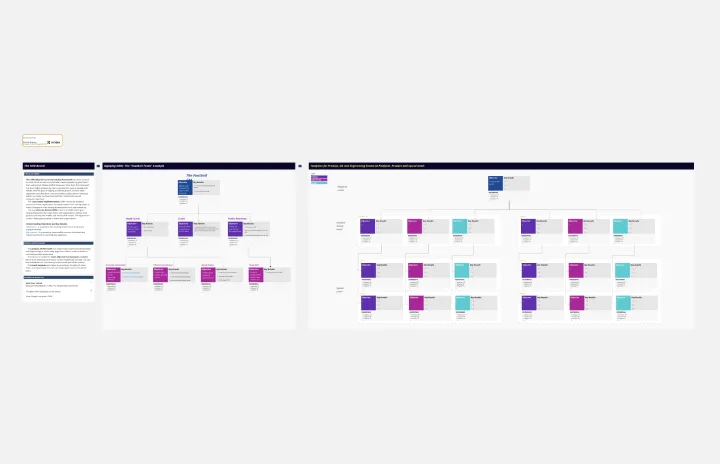
OKR Board for Product, UX and Engineering Teams
The OKR Board for Product, UX, and Engineering Teams template aligns cross-functional teams around common objectives using Objectives and Key Results (OKRs). By setting ambitious goals, defining measurable outcomes, and tracking progress collaboratively, this template fosters alignment and focus. With sections for defining team OKRs, prioritizing initiatives, and monitoring performance, it enables teams to work cohesively towards shared goals. This template serves as a catalyst for driving product innovation and delivering exceptional user experiences.
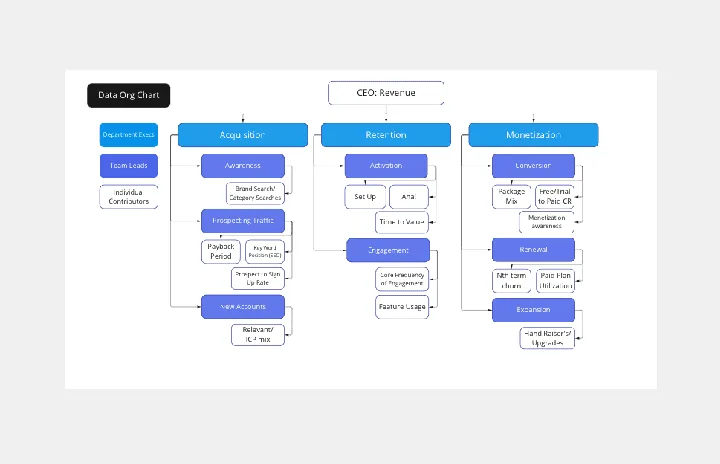
Data Org Chart
Works best for:
Org Charts, Operations, Mapping
The Data Org Chart template provides a visual representation of data-related roles and relationships within an organization. By mapping out data management responsibilities and dependencies, teams can enhance data governance and improve collaboration. With features for customizing data roles and connections, this template empowers teams to optimize data processes and ensure data integrity and compliance.
Epic & Feature Roadmap Planning
Epic & Feature Roadmap Planning template facilitates the breakdown of large-scale initiatives into manageable features and tasks. It helps teams prioritize development efforts based on business impact and strategic objectives. By visualizing the relationship between epics and features, teams can effectively plan releases and ensure alignment with overall project goals and timelines.
VRIO Analysis Template
Works best for:
Diagramming, Strategy
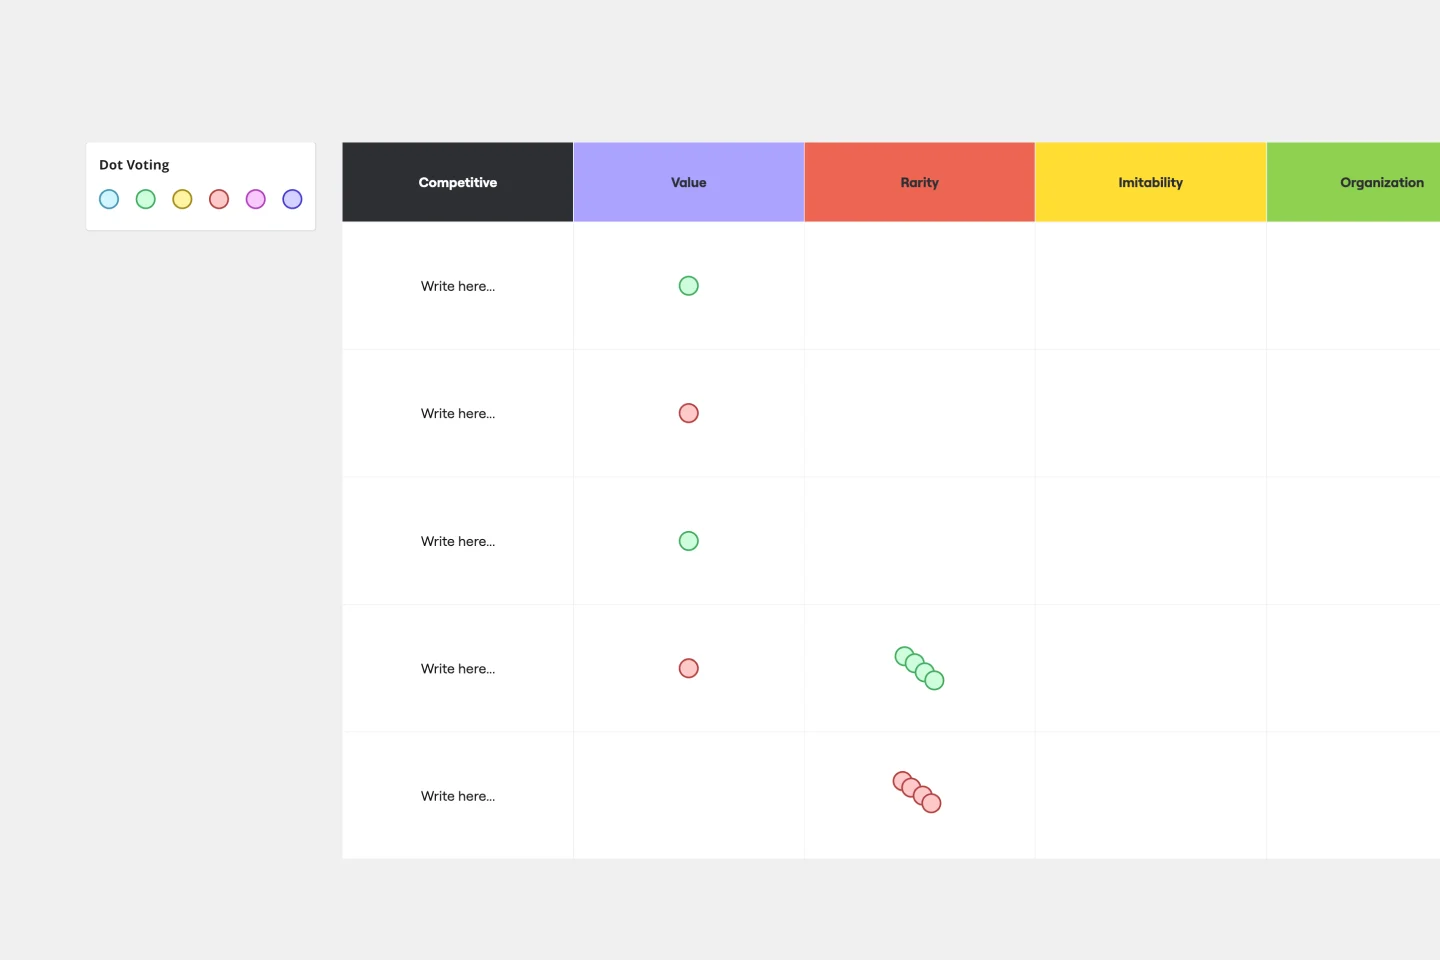
The VRIO Analysis Template is a framework that helps businesses evaluate their resources and capabilities for competitive advantage. It categorizes resources into four areas: Value, Rarity, Imitability, and Organization. This provides a comprehensive view of an organization's strengths and potential weaknesses. The template has the key benefit of offering quick visual insights. Decision-makers can immediately identify and focus on resources that are valuable, rare, hard to imitate, and well-organized. This ensures a sustainable competitive edge and saves time by avoiding lengthy textual analyses.
Features Prioritization Tool
Works best for:
Agile
The Features Prioritization Tool offers a systematic approach to prioritizing product features based on criteria such as value, effort, and strategic alignment. It provides a structured framework for capturing, evaluating, and ranking feature ideas, enabling teams to make informed decisions about what to build next. With customizable scoring mechanisms and visual dashboards, this template empowers product teams to optimize their product roadmap and deliver maximum value to customers, driving competitiveness and market success.