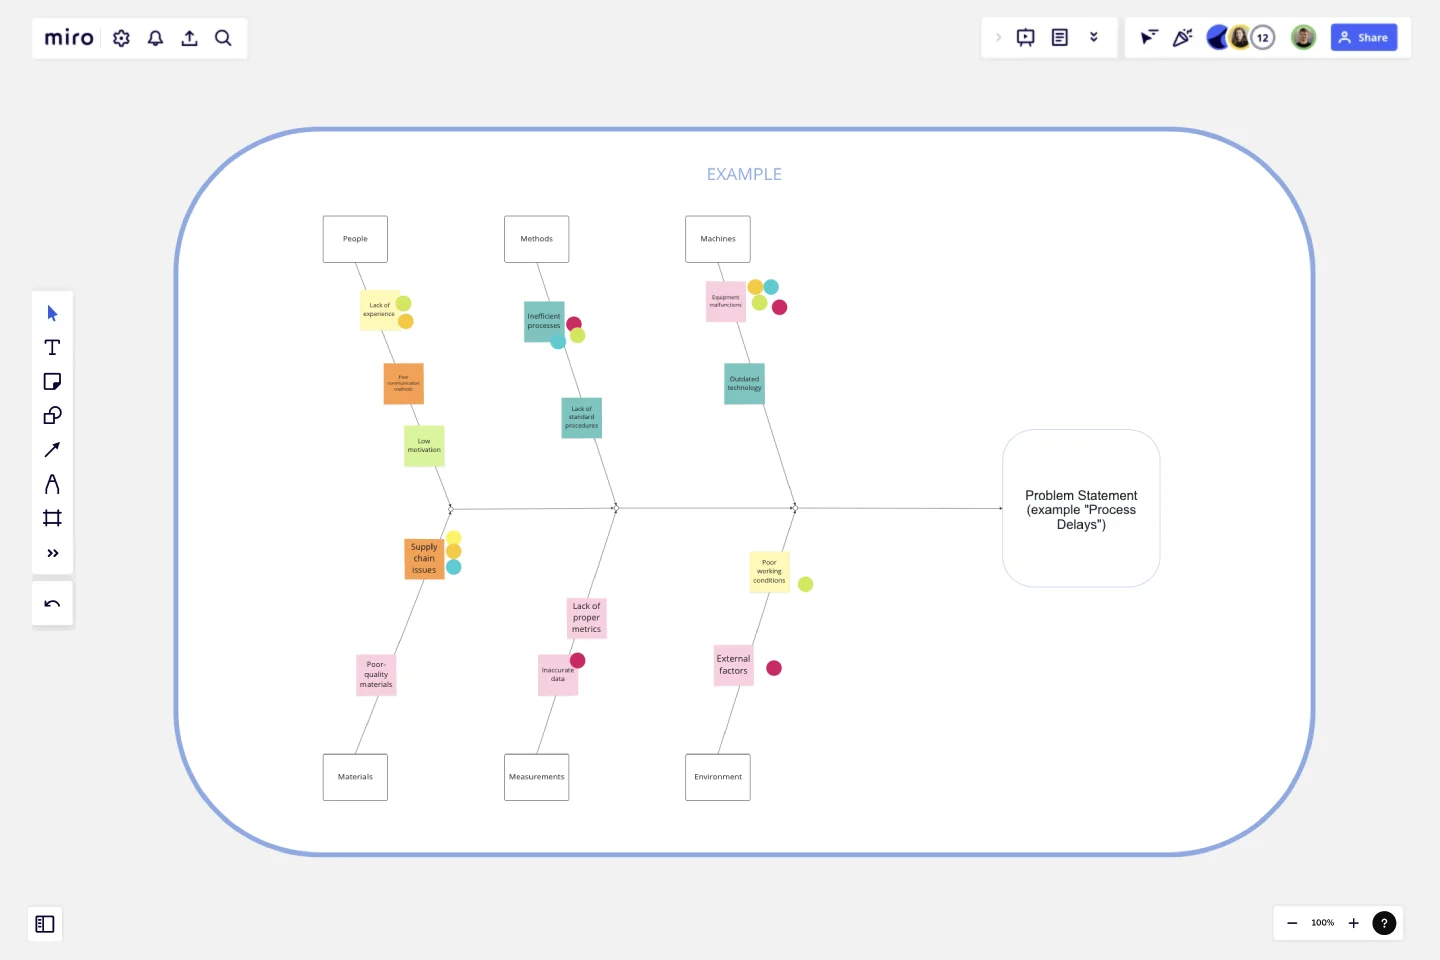
Fishbone Diagram for Process Improvement
The Fishbone Diagram for Process Improvement template is a specialized tool designed to help teams systematically analyze and identify the root causes of process-related issues.
Here’s why you should consider using this template:
Key Features:
Problem-Centric Design:
The diagram starts with a clear definition of the problem or effect you are addressing, such as "Process Delays" or "Inefficiencies," providing a focused approach to problem-solving.
Major Categories:
The template includes predefined categories relevant to process improvement, such as People, Methods, Machines, Materials, Measurements, and Environment. These categories help in organizing potential causes systematically.
Structured Brainstorming:
Each category has branches for listing potential causes, encouraging thorough brainstorming and ensuring that no aspect of the process is overlooked.
Collaborative Framework:
The template is designed for team collaboration, allowing multiple users to contribute their insights and ideas in a structured manner, fostering a comprehensive analysis.
Visual Clarity:
The fishbone (Ishikawa) diagram's visual structure makes it easy to understand the relationships between the problem and its potential causes, facilitating better communication and discussion among team members.
Why Use This Template?
Systematic Problem Analysis:
The Fishbone Diagram for Process Improvement template helps in systematically breaking down complex problems into manageable parts, making it easier to identify root causes.
Holistic View:
By considering multiple categories, the template ensures that all possible aspects of the process are examined, leading to a more thorough investigation.
Improved Collaboration:
The template promotes team collaboration, ensuring that diverse perspectives are considered, which can lead to more innovative solutions and a better understanding of the problem.
Enhanced Decision-Making:
The structured approach of the template aids in prioritizing causes based on their impact, helping teams focus on the most critical areas first, thus improving decision-making and action planning.
Effective Communication:
The visual nature of the fishbone diagram makes it easier to communicate findings and strategies to stakeholders, ensuring that everyone is on the same page.
By using the Fishbone Diagram for Process Improvement template, teams can effectively analyze process issues, identify root causes, and develop targeted action plans to improve process efficiency and effectiveness.
This template was created by Anthony.
Get started with this template right now.
Mandala Chart Template
Works best for:
Planning, Brainstorming, Goal setting
The Mandala Chart Template helps you visualize the relationships between a central theme and its sub-themes. One of the key benefits is how it fosters a holistic understanding of any topic. This perspective ensures every detail is noticed, making it an invaluable asset for those aiming for comprehensive insight and thorough planning or a better understanding of their goals.
Service Blueprint by Liz Possee Corthell
Works best for:
Service Blueprint
Enhance your service design with the Service Blueprint Canvas. This template helps you visualize and analyze the entire service process, from front-stage customer interactions to back-stage support activities. Identify pain points, optimize workflows, and improve customer experiences. Ideal for service designers, managers, and teams focused on delivering exceptional service. The blueprint provides a comprehensive view, facilitating better communication and strategic planning.
Weekly Planner by Elina Schäfer
Weekly Planner template is perfect for organizing your weekly tasks and schedules. It helps you prioritize activities, set deadlines, and manage your time effectively, ensuring you stay productive and on track throughout the week.
Lean Canvas Template
Works best for:
Agile Methodology, Strategic Planning, Agile Workflows
Business opportunities can get dense, cumbersome, and complex, and evaluating them can be a real challenge. Let a lean canvas streamline things and break down your business idea for you and your team. A great tool or entrepreneurs and emerging businesses, this one-page business model gives you an easy, high-level view of your idea — so you can stay focused on overall strategy, identify potential threats and opportunities, and brainstorm the various factors at play in determining your potential profitability in an industry.
Marketing Campaign Timeline
Works best for:
Timeline, Planning
Plan and execute your marketing strategies seamlessly with the Marketing Campaign Timeline template. This tool allows you to map out every stage of your campaign, from planning to launch and analysis. Visualize key milestones, set deadlines, and track progress to ensure your marketing efforts are well-coordinated and effective. Ideal for marketing teams looking to optimize their campaign management.
Four-Circle Venn Diagram by Irfan Rosli
Works best for:
Venn Diagrams
The Four Circle Venn Diagram template offers a robust tool for detailed data comparison involving four sets. Use it to identify common and unique attributes across multiple categories. This template is perfect for complex analysis in research, strategic planning, and education. It helps visualize relationships clearly, making it easier to draw insights and communicate findings. Ideal for professionals and educators needing advanced comparative tools.
