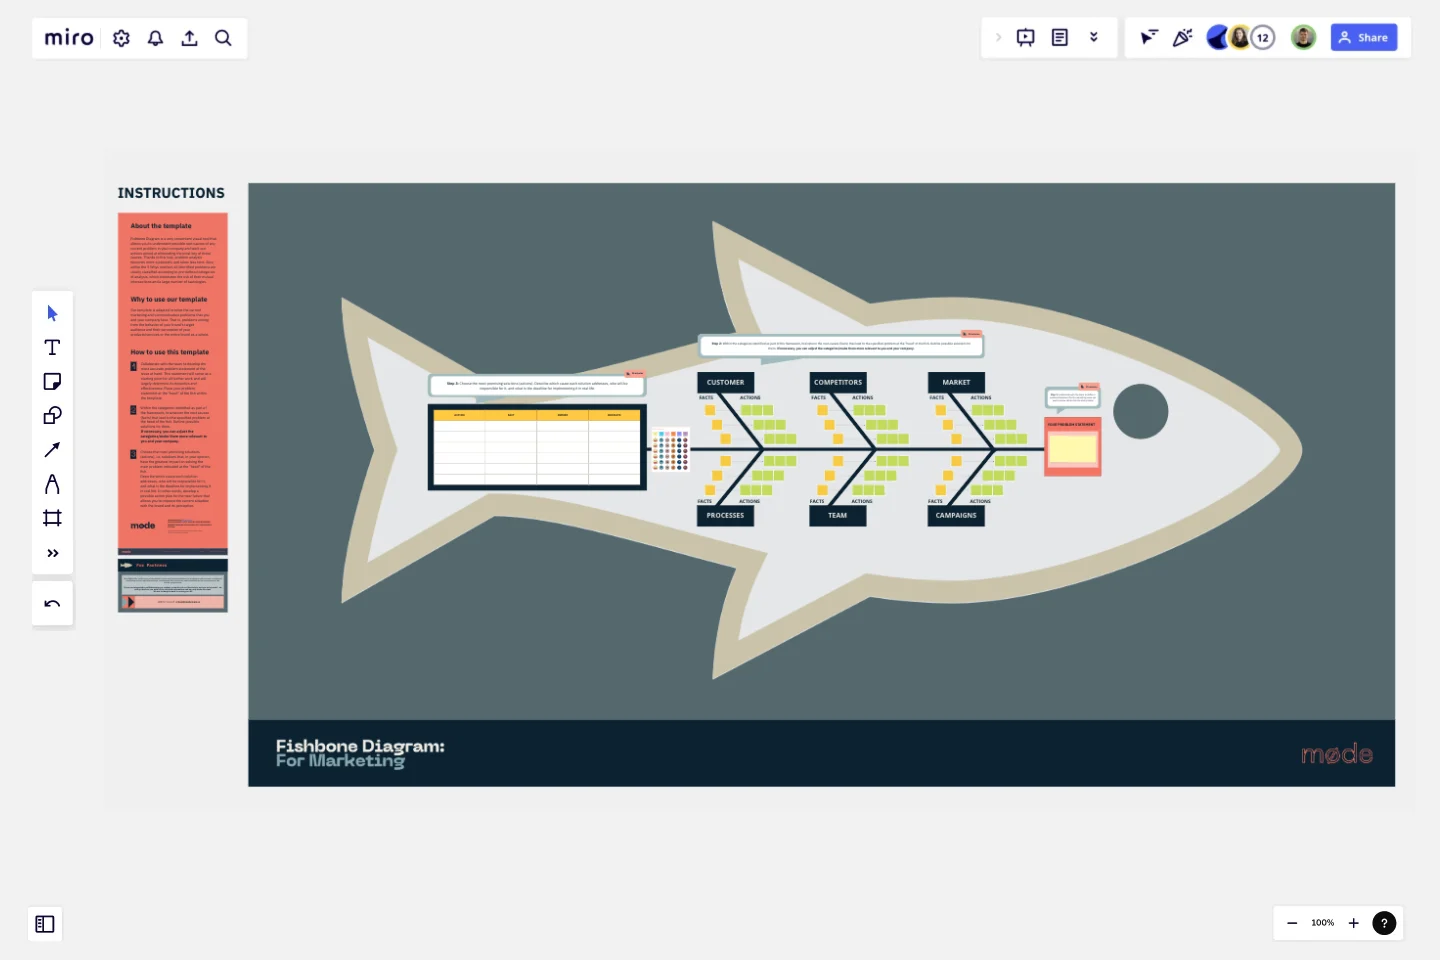
Fishbone Diagram for Marketing
Fishbone Diagram is a very convenient visual tool that allows you to understand possible root causes of any current problem in your company and work out actions aimed at eliminating the most key of these causes.
Thanks to this tool, problem analysis becomes more systematic and takes less time. Also, unlike the 5 Whys method, all identified problems are clearly classified according to pre-defined categories of analysis, which eliminates the risk of their mutual intersections and a large number of tautologies.
Why to use our template
Our template is adapted to solve the current marketing and communication problems that you and your company face. That is, problems arising from the behavior of your brand's target audience and their perception of your products/services or the entire brand as a whole.
How to use this template
Collaborate with the team to develop the most accurate problem statement of the issue at hand. This statement will serve as a starting point for all further work and will largely determine its dynamics and effectiveness.
Within the categories identified as part of the framework, brainstorm the root causes (facts) that lead to the specified problem at the head of the fish. Outline possible solutions for them. If necessary, you can adjust the categories/make them more relevant to you and your company.
Choose the most promising solutions (actions), i.e. solutions that, in your opinion, have the greatest impact on solving the main problem indicated at the "head" of the fish. Describe which cause each solution addresses, who will be responsible for it, and what is the deadline for implementing it in real life. In other words, develop a possible action plan for the near future that allows you to improve the current situation with the brand and its perception.
This template was created by Mode Team.
Get started with this template right now.
Gantt Chart for Project Scheduling
Works best for:
Planning, Strategy
Gantt Chart for Project Scheduling helps you plan and visualize project timelines. It enables you to manage tasks, deadlines, and dependencies, ensuring efficient project execution. Ideal for project managers looking to streamline their scheduling process.
Product Strategy - Understand the "Why"
Works best for:
Product Management, Planning
The Product Strategy Understand the Why template emphasizes the importance of aligning product strategies with business objectives. By defining the "why" behind product initiatives, setting clear goals, and prioritizing initiatives, this template ensures strategic alignment and focus. With sections for articulating vision, setting objectives, and defining success criteria, it provides clarity and direction for product teams. This template serves as a strategic guide for product managers to develop and execute product strategies that drive business growth and customer value.
Timeline Workflow by Reza Zolf
Works best for:
Planning, Strategy
The Timeline Workflow template helps streamline your project workflows. It’s perfect for visualizing processes, identifying bottlenecks, and optimizing tasks. This template enhances team collaboration and ensures smooth project execution.
Fishbone Diagram for Process Improvement
Works best for:
Planning, Strategy
Process improvement is key to enhancing efficiency and productivity. The Fishbone Diagram for Process Improvement template helps you identify the root causes of process inefficiencies. Categorize potential causes into areas such as workflow, resources, technology, and personnel. This structured analysis enables your team to systematically explore and address issues, streamlining processes and boosting overall productivity.
Resource Management Gantt Chart
Works best for:
Strategy, Planning
Efficient resource allocation is crucial for project success. The Resource Management Gantt Chart template helps you plan and manage your resources effectively. Use it to track the availability and allocation of personnel, equipment, and materials throughout your project. This template ensures resources are optimally utilized, reducing waste and avoiding delays, providing a clear overview of assignments and workload balance.
Define Your Product's Target Audience
Works best for:
Product Management, Planning
Too broad an audience? Or trying to target too many audiences? This is a certain path to product failure.
