Fishbone Diagram for Healthcare
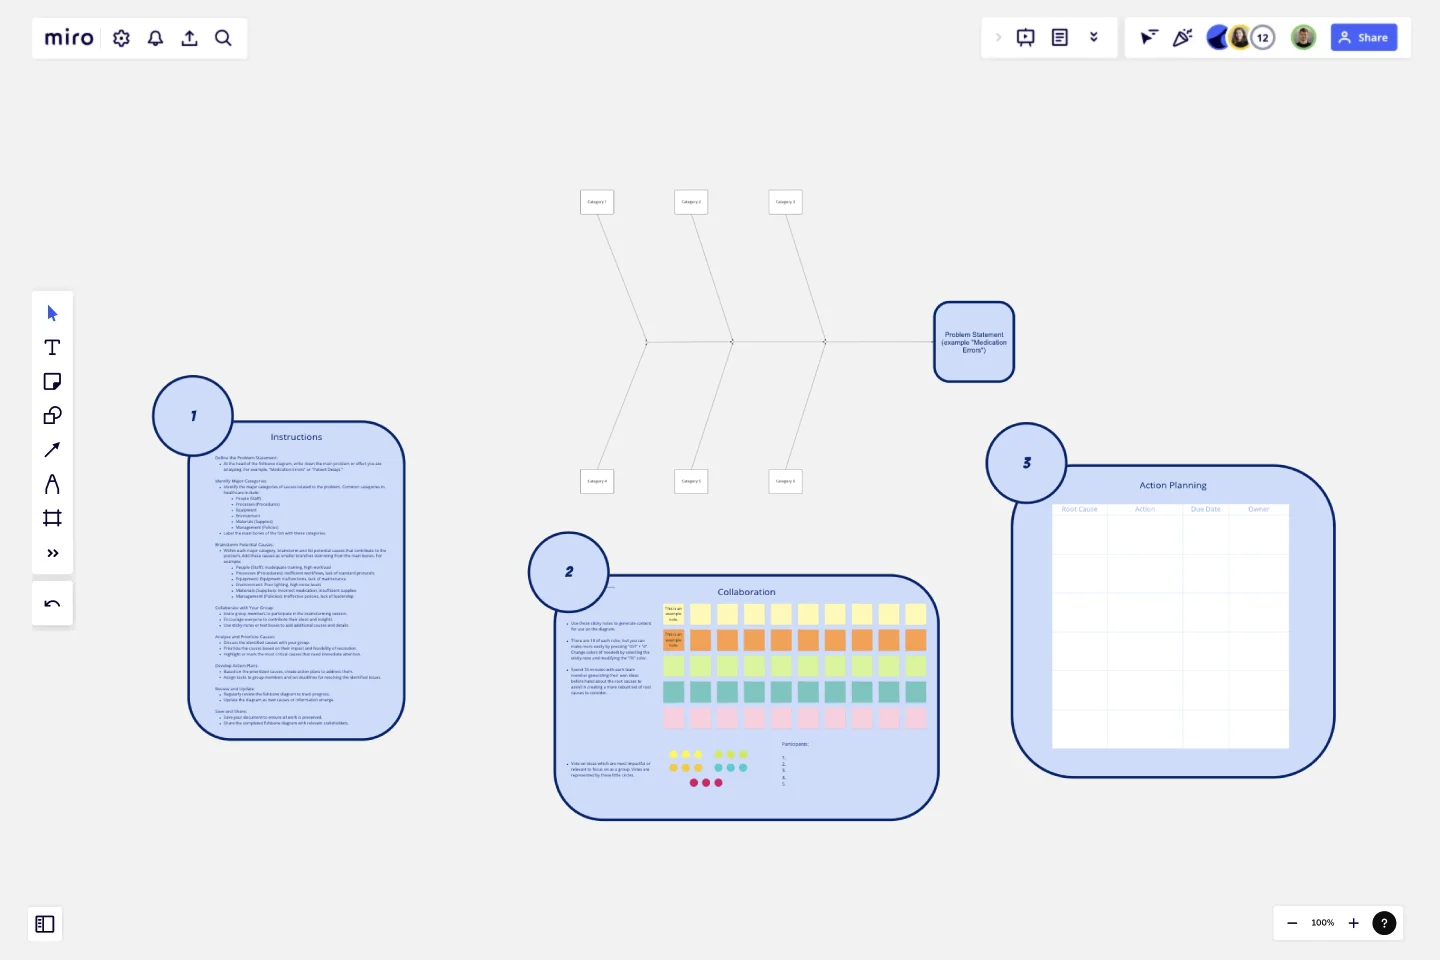
The Fishbone Diagram for Healthcare template is a specialized tool designed to help healthcare teams systematically analyze and identify the root causes of issues within healthcare settings.
Here’s why you should consider using this template:
Key Features:
Problem-Centric Design:
The diagram starts with a clear definition of the problem or effect you are addressing, such as "Medication Errors" or "Patient Delays," providing a focused approach to problem-solving.
Major Categories:
The template includes predefined categories relevant to healthcare, such as People (Staff), Processes (Procedures), Equipment, Environment, Materials (Supplies), and Management (Policies). These categories help in organizing potential causes systematically.
Structured Brainstorming:
Each category has branches for listing potential causes, encouraging thorough brainstorming and ensuring that no aspect of the healthcare process is overlooked.
Collaborative Framework:
The template is designed for team collaboration, allowing multiple users to contribute their insights and ideas in a structured manner, fostering a comprehensive analysis.
Visual Clarity:
The fishbone (Ishikawa) diagram's visual structure makes it easy to understand the relationships between the problem and its potential causes, facilitating better communication and discussion among team members.
Why Use This Template?
Systematic Problem Analysis:
The Fishbone Diagram for Healthcare template helps in systematically breaking down complex healthcare problems into manageable parts, making it easier to identify root causes and areas for improvement.
Holistic View:
By considering multiple categories, the template ensures that all possible aspects of the healthcare process are examined, leading to a more thorough and comprehensive investigation.
Improved Collaboration:
The template promotes team collaboration, ensuring that diverse perspectives from different roles and departments are considered. This can lead to more innovative solutions and a better understanding of the problem.
Enhanced Decision-Making:
The structured approach of the template aids in prioritizing causes based on their impact, helping teams focus on the most critical areas first. This improves decision-making and action planning, leading to more effective interventions.
Effective Communication:
The visual nature of the fishbone diagram makes it easier to communicate findings and strategies to stakeholders, ensuring that everyone involved has a clear understanding of the issues and proposed solutions.
By using the Fishbone Diagram for Healthcare template, teams can effectively analyze healthcare-related issues, identify root causes, and develop targeted action plans to improve patient care, operational efficiency, and overall quality of service.
This template was created by Anthony.
Get started with this template right now.
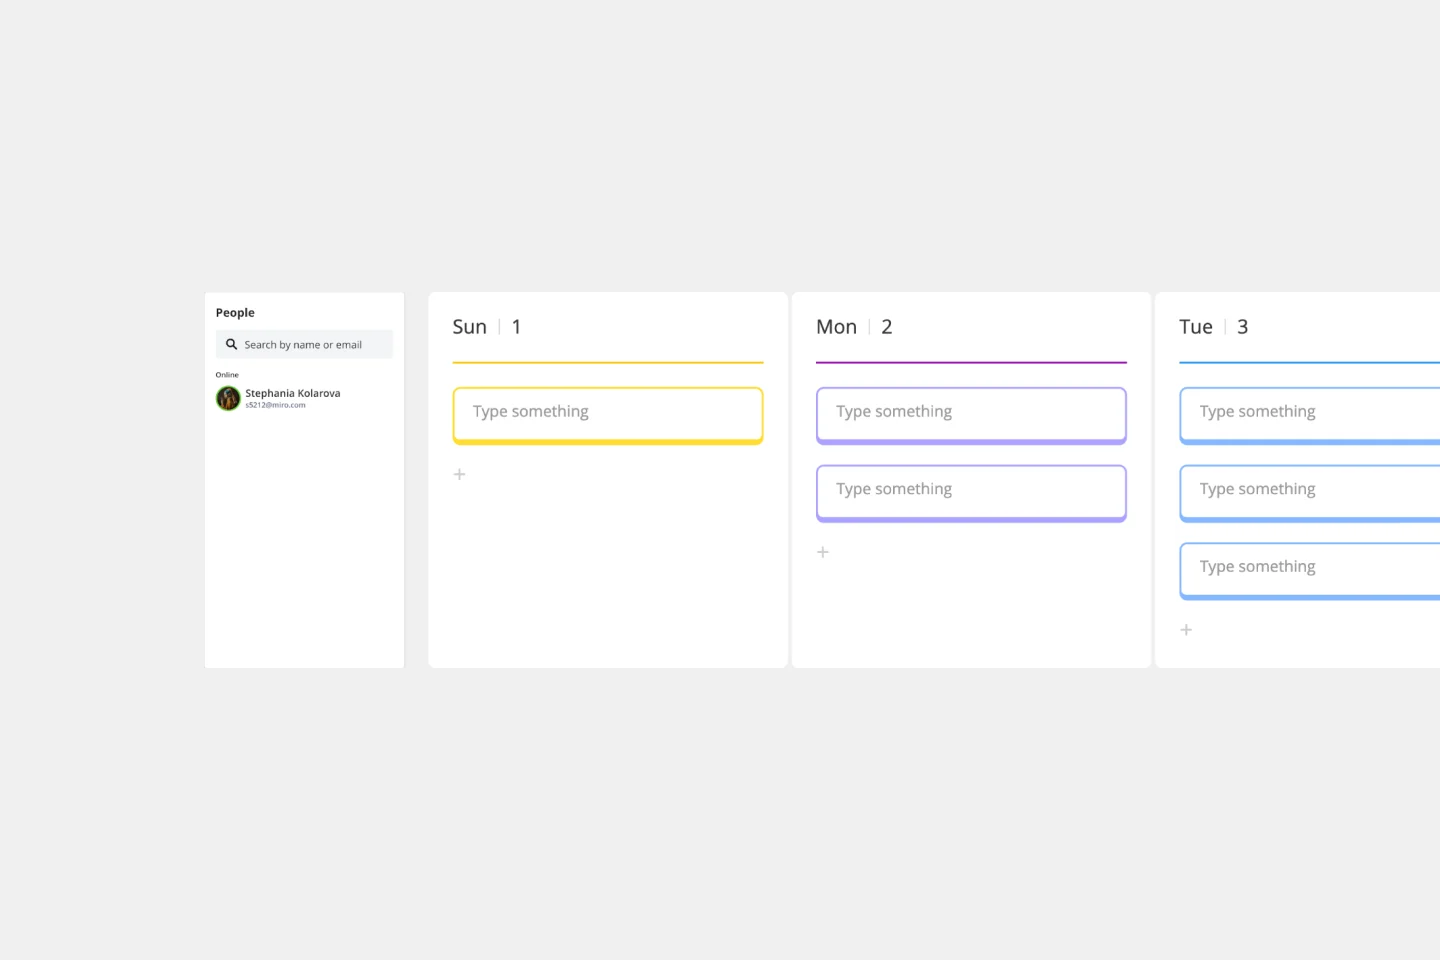
Weekly Planner Template
Works best for:
Business Management, Project Planning
A weekly planner is a schedule that outlines your plans and activities for the week ahead. It helps you manage your time, keep track of your tasks, and organize your team on a day-to-day basis. Unlike traditional planners, which are often non-customizable, this weekly planner can be modified to suit your specific needs.
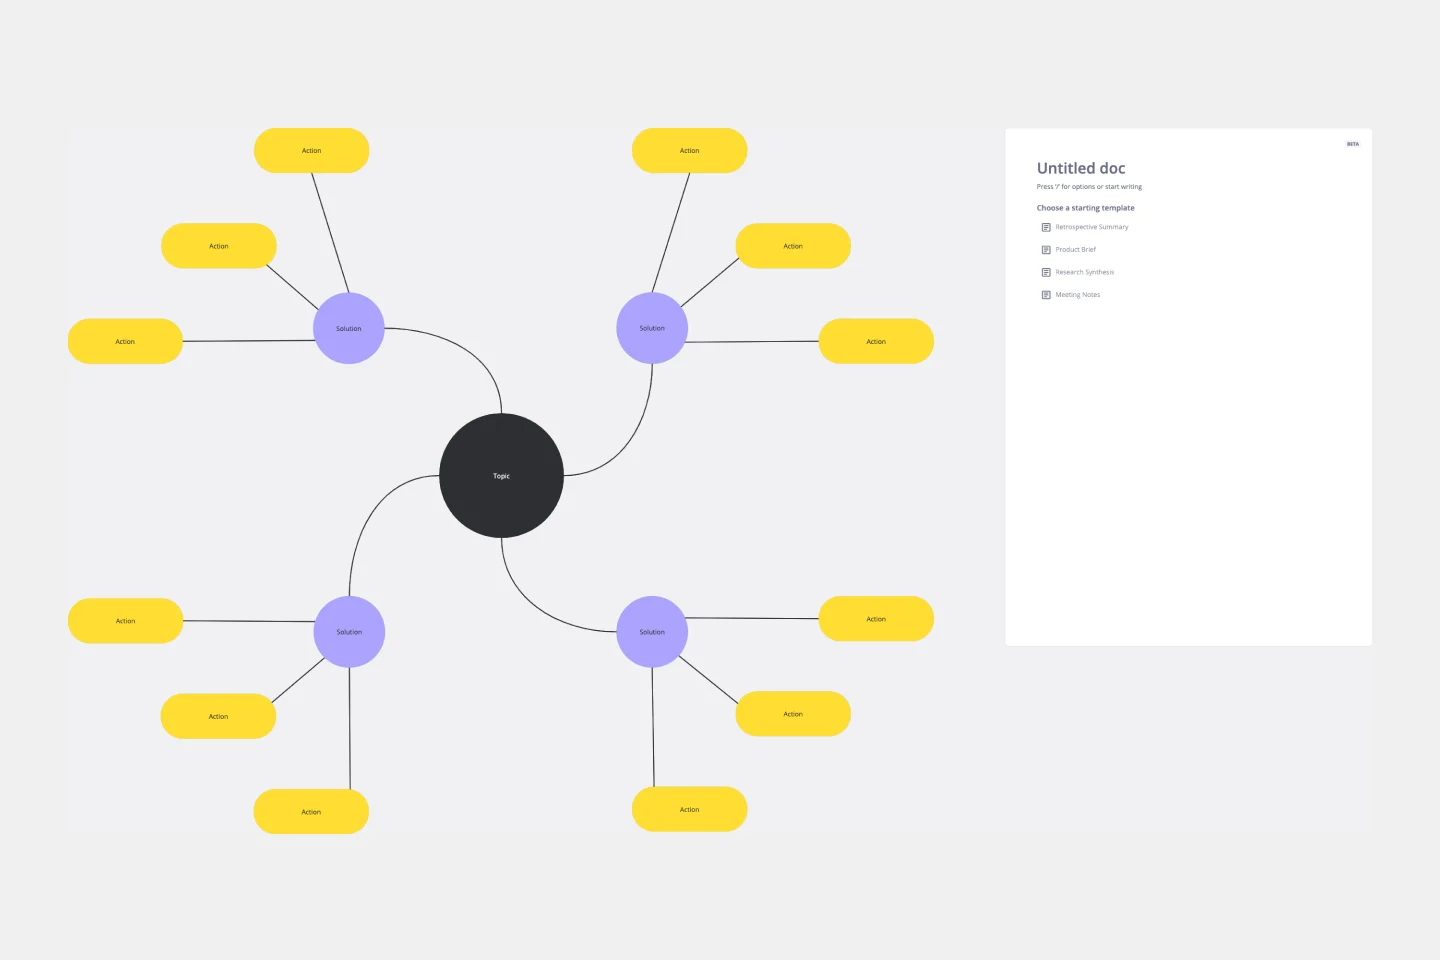
Spider Diagram Template
Works best for:
Diagramming, Mapping
Perfect for brainstorming sessions, project planning, or simply organizing thoughts, the Spider Diagram Template allows you to create 'legs' branching out from a central idea, representing related topics or subtopics.
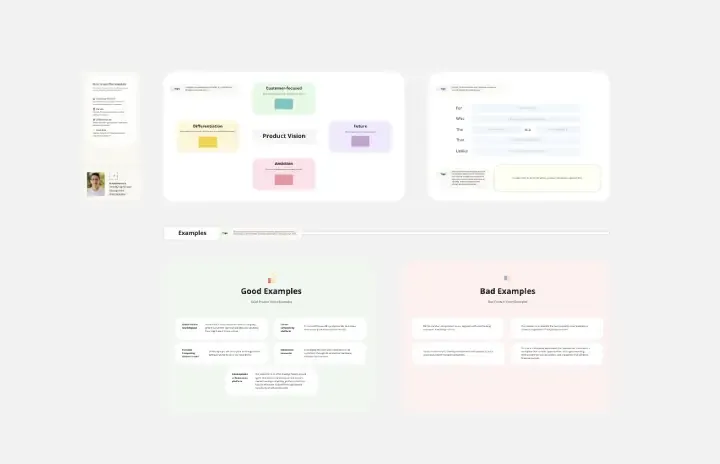
Product Vision & Differentiation Strategy Template
Works best for:
Product Management, Planning
The Product Vision & Differentiation Strategy Template assists product managers in crafting compelling product visions and differentiation strategies. By articulating product goals, unique value propositions, and competitive advantages, this template guides strategic planning and execution. With sections for defining target markets and assessing market dynamics, it enables product managers to create differentiated products that resonate with customers. This template serves as a roadmap for achieving market leadership and sustainable growth through product innovation.
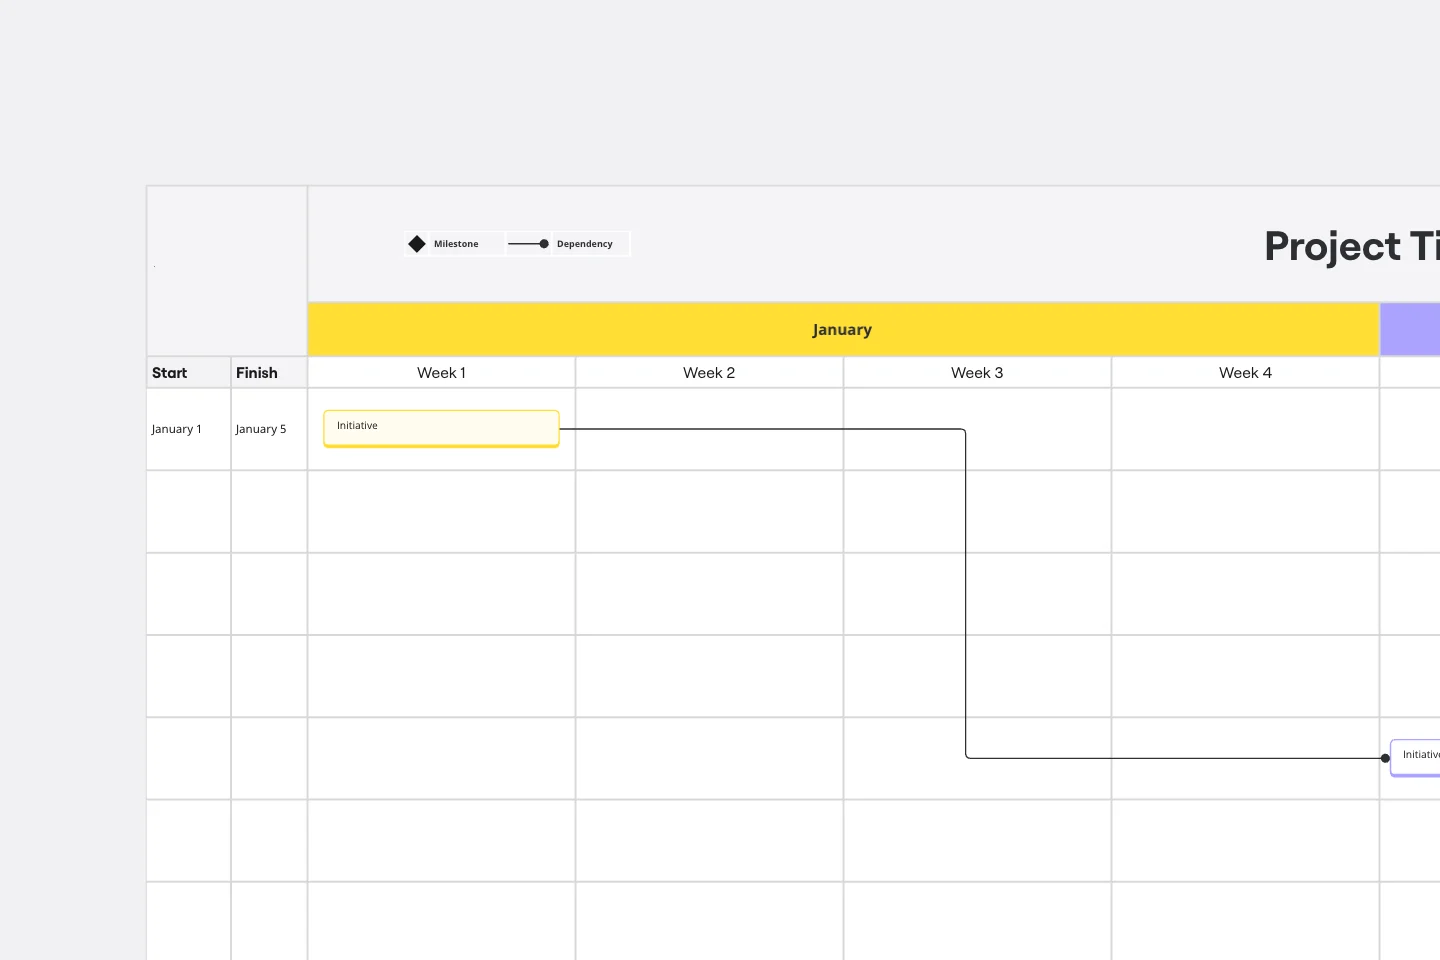
Gantt Chart Template
Works best for:
Project Management, Mapping, Roadmaps
Simplicity, clarity, and power — that’s what make Gantt charts such a popular choice for organizing and displaying a project plan. Built upon a horizontal bar that represents the project progress over time, these charts break down projects by task, allowing the whole team to see the task status, who it’s assigned to, and how long it will take to complete. Gantt charts are also easily shareable among team members and stakeholders, making them great tools for collaboration.
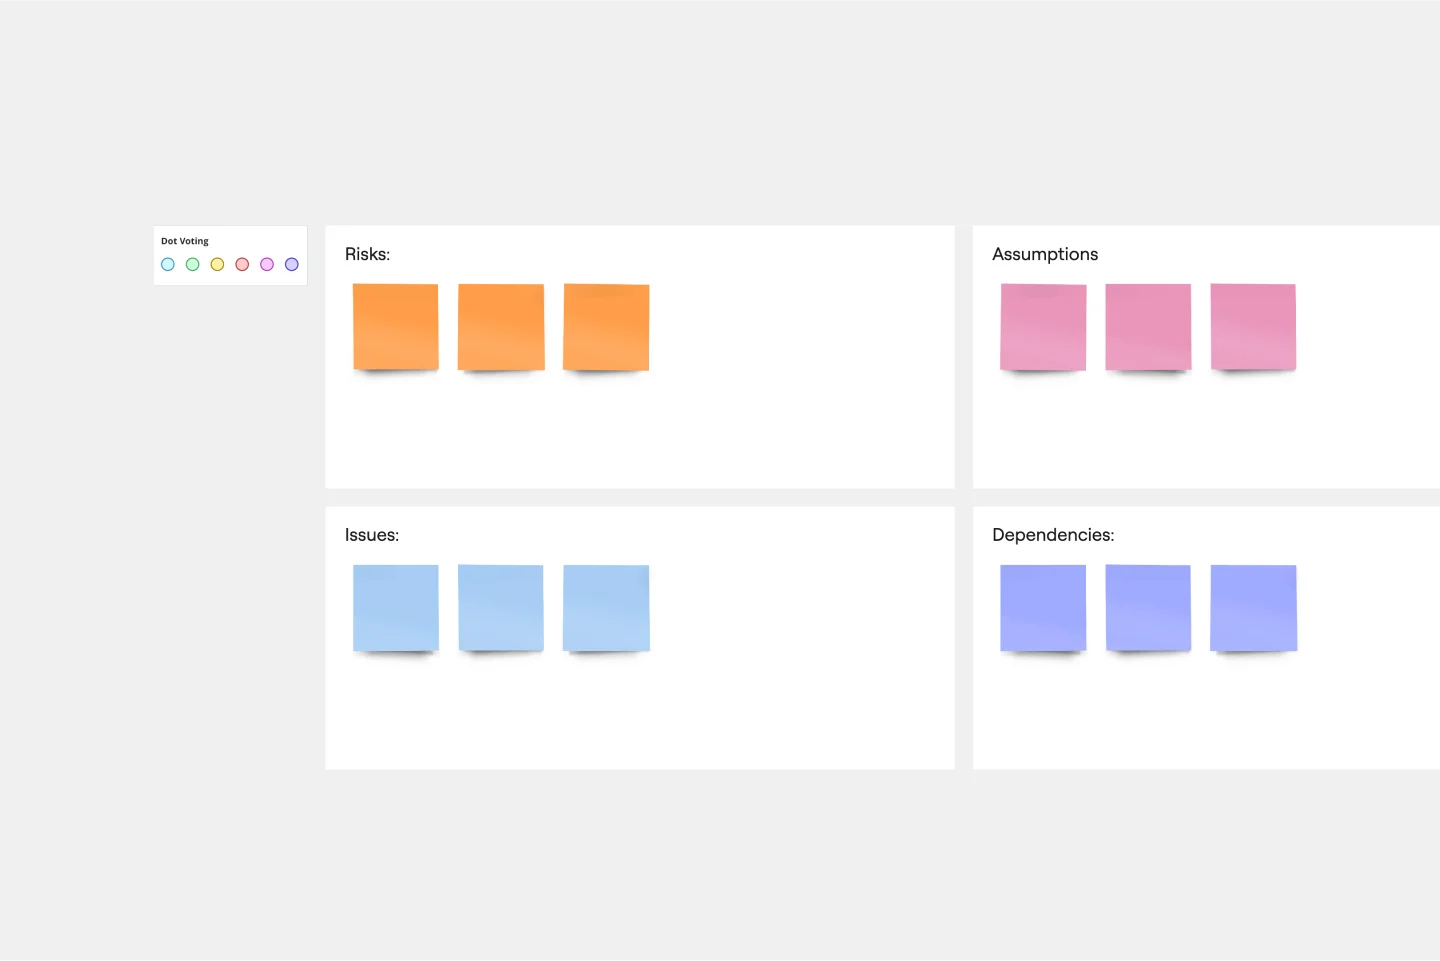
RAID Log Template
Works best for:
Agile Methodology, Project Management, Agile Workflows
Use the RAID Log template to better understand potential risks, assumptions, issues, and dependencies relating to an upcoming project. With this information, you can make effective contingency plans and prepare your resources accordingly. You’ll know what could go wrong throughout the project and how to fix the problem.
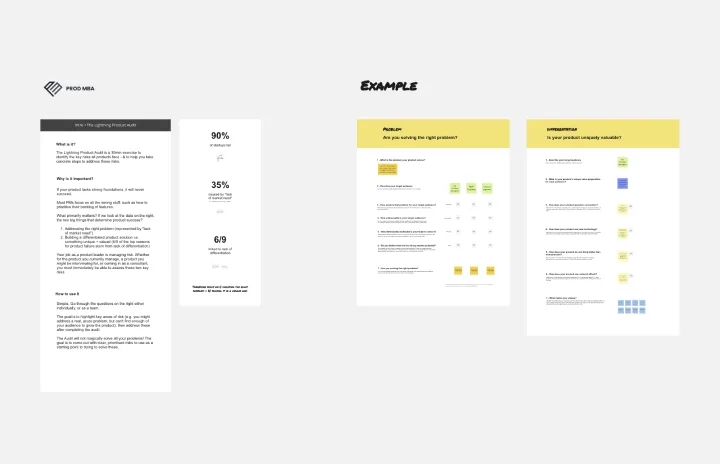
The Lightning Product Audit
Works best for:
Product Management, Planning
The Lightning Product Audit template streamlines product evaluation processes with a comprehensive framework. By assessing key areas such as market fit, user experience, and feature performance, this template enables teams to identify strengths, weaknesses, and areas for improvement swiftly. With sections for conducting SWOT analysis, user feedback review, and competitive benchmarking, it facilitates data-driven decision-making and prioritization. This template serves as a catalyst for refining product strategies and driving continuous improvement.