Fishbone Diagram for Service Improvement
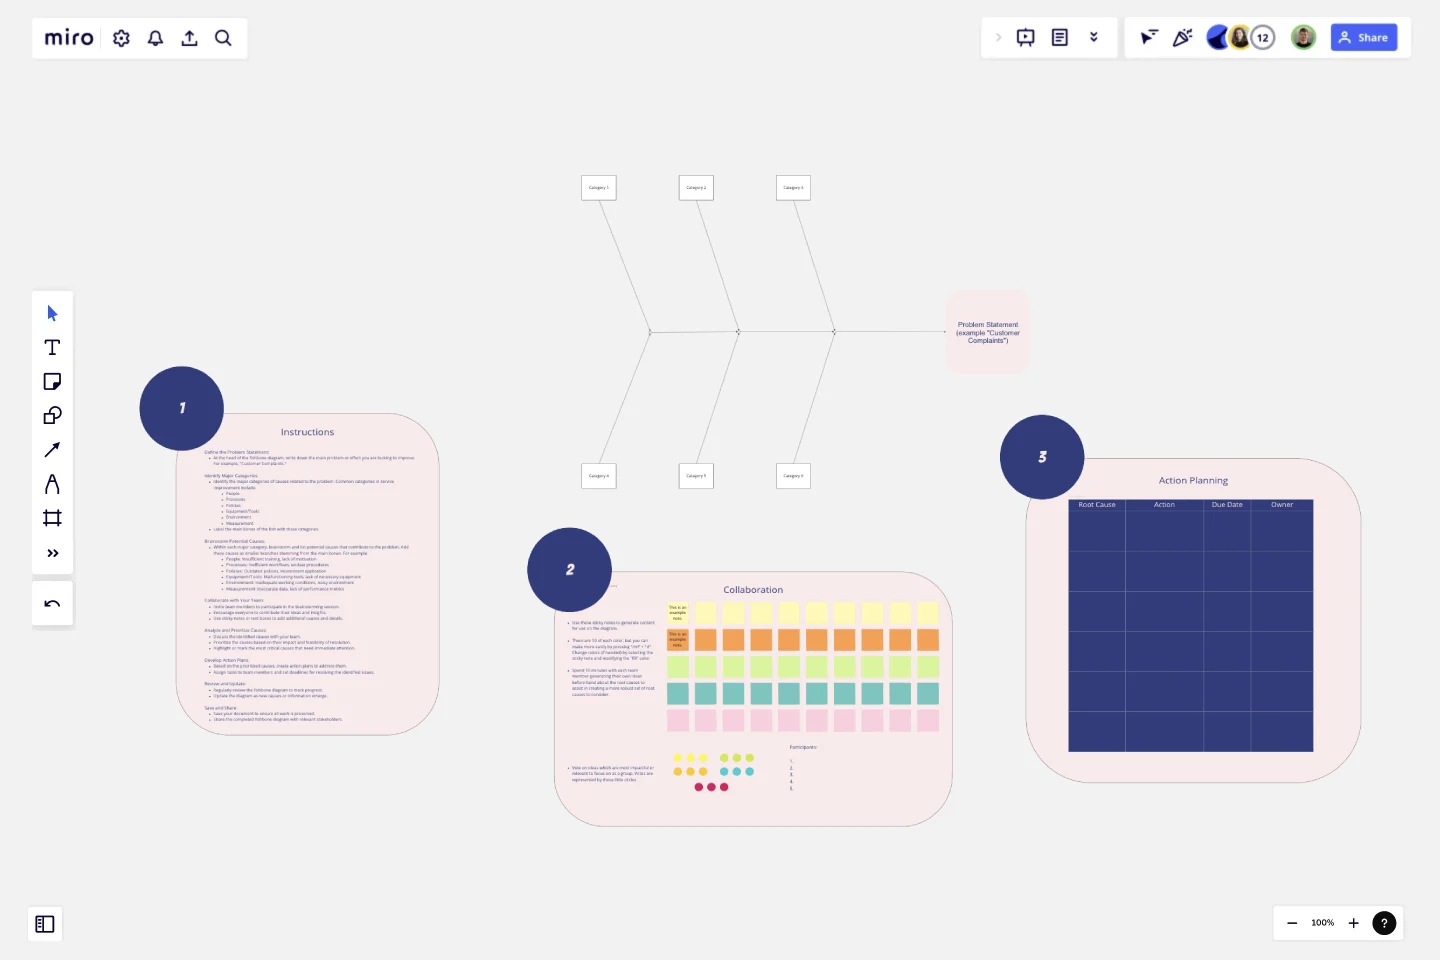
The Fishbone Diagram for Service Improvement template is a structured tool designed to help teams systematically analyze and identify the root causes of service-related issues.
Here’s why you should consider using this template:
Key Features:
Problem-Centric Design:
The diagram starts with a clear definition of the problem or effect you are addressing, such as "Customer Complaints" or "Service Delays," providing a focused approach to problem-solving.
Major Categories:
The template includes predefined categories relevant to service improvement, such as People, Processes, Policies, Equipment/Tools, Environment, and Measurement. These categories help in organizing potential causes systematically.
Structured Brainstorming:
Each category has branches for listing potential causes, encouraging thorough brainstorming and ensuring that no aspect of the service process is overlooked.
Collaborative Framework:
The template is designed for team collaboration, allowing multiple users to contribute their insights and ideas in a structured manner, fostering a comprehensive analysis.
Visual Clarity:
The fishbone (Ishikawa) diagram's visual structure makes it easy to understand the relationships between the problem and its potential causes, facilitating better communication and discussion among team members.
Why Use This Template?
Systematic Problem Analysis:
The Fishbone Diagram for Service Improvement template helps in systematically breaking down complex problems into manageable parts, making it easier to identify root causes.
Holistic View:
By considering multiple categories, the template ensures that all possible aspects of the service process are examined, leading to a more thorough investigation.
Improved Collaboration:
The template promotes team collaboration, ensuring that diverse perspectives are considered, which can lead to more innovative solutions and a better understanding of the problem.
Enhanced Decision-Making:
The structured approach of the template aids in prioritizing causes based on their impact, helping teams focus on the most critical areas first, thus improving decision-making and action planning.
Effective Communication:
The visual nature of the fishbone diagram makes it easier to communicate findings and strategies to stakeholders, ensuring that everyone is on the same page.
By using the Fishbone Diagram for Service Improvement template, teams can effectively analyze service issues, identify root causes, and develop targeted action plans to improve service quality and customer satisfaction.
This template was added by Anthony.
Get started with this template right now.
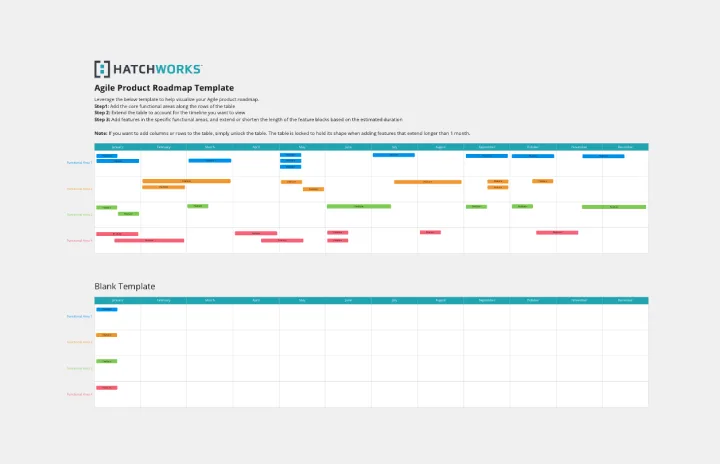
Agile Product Roadmap by HatchWorks
Works best for:
Product Management, Roadmap
Enhance your agile workflow with the Agile Product Roadmap by HatchWorks. This template helps you plan and track product development in agile sprints, ensuring continuous delivery and improvement. Use it to align teams, prioritize features, and adapt quickly to changes. Ideal for agile teams aiming to maintain flexibility and efficiency in their product development process, ensuring timely and iterative delivery of enhancements.
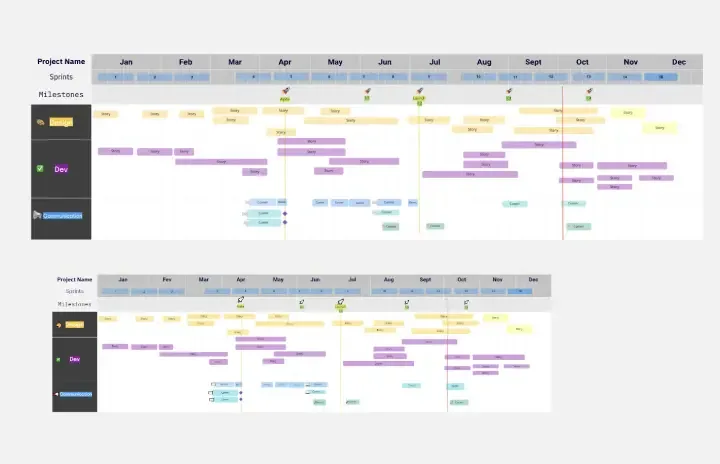
Project - Timeline & Key Infos
Works best for:
Agile, Project Management
The Project - Timeline & Key Infos template provides a visual framework for planning and tracking project timelines, milestones, and key information. It enables teams to align on project objectives, allocate resources, and monitor progress effectively. With customizable timelines and informative dashboards, this template empowers project managers and stakeholders to stay organized and informed throughout the project lifecycle, ensuring successful delivery within scope, time, and budget constraints.
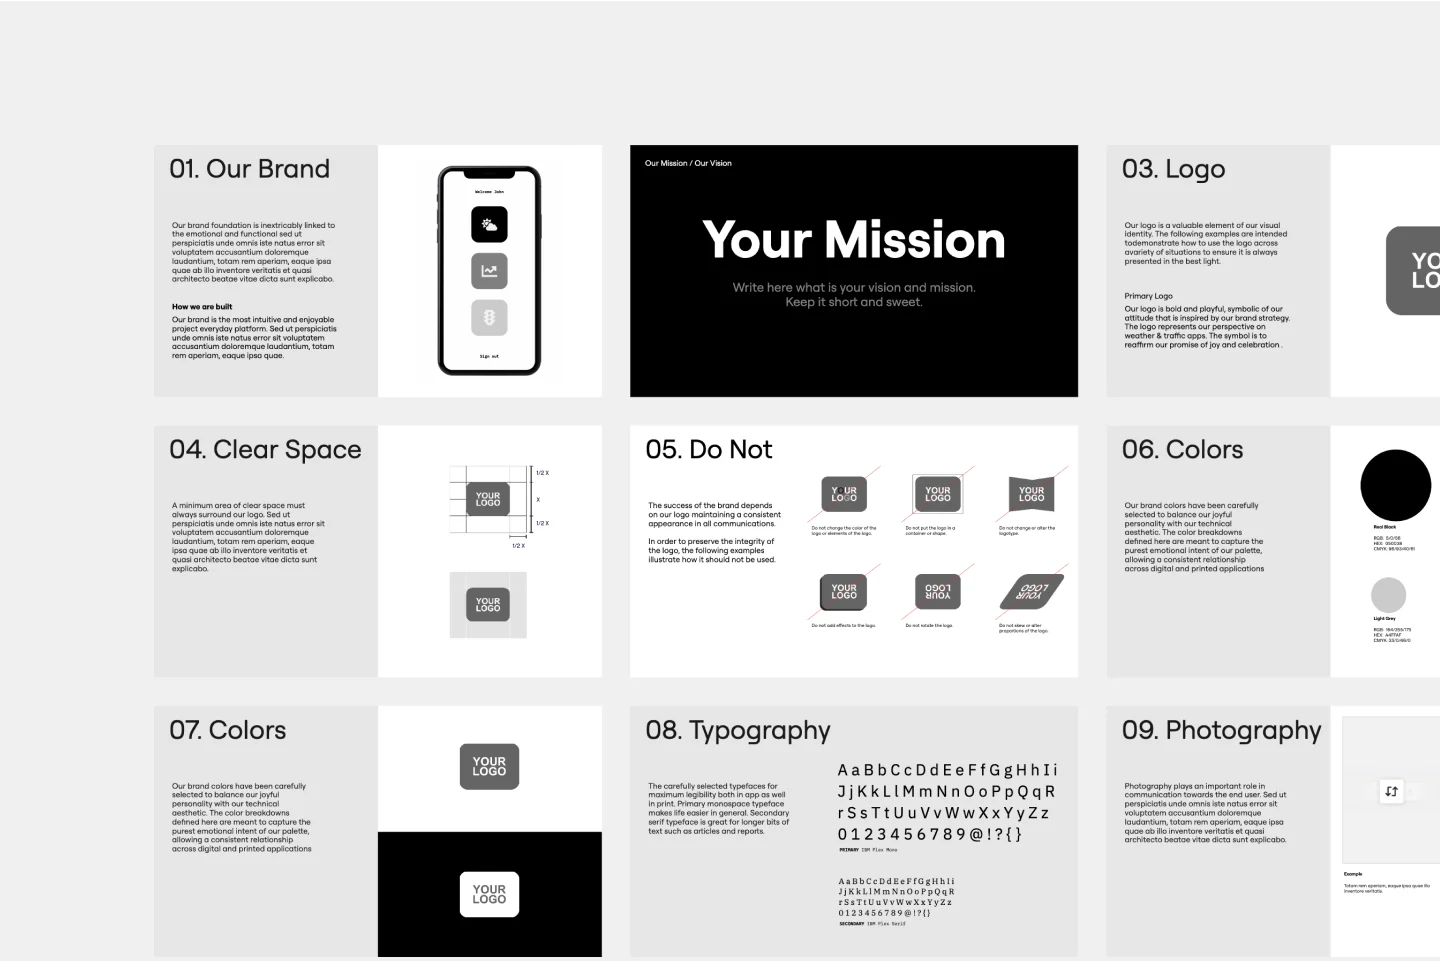
Brand Guidelines Template
Works best for:
Design, Marketing, Documentation
What makes a strong brand? It’s having a well-defined personality, expressed with consistency at every touchpoint, and brand guidelines can help you do it. Brand guidelines are a clear list of rules—all the dos and don’ts—that cover details like colors, fonts, logo usage, photography, and brand voice. They help ensure that employees across a whole company or organization know how to display or speak about the brand. Miro’s whiteboard tool is the perfect canvas for creating brand guidelines, sharing them, and updating them.
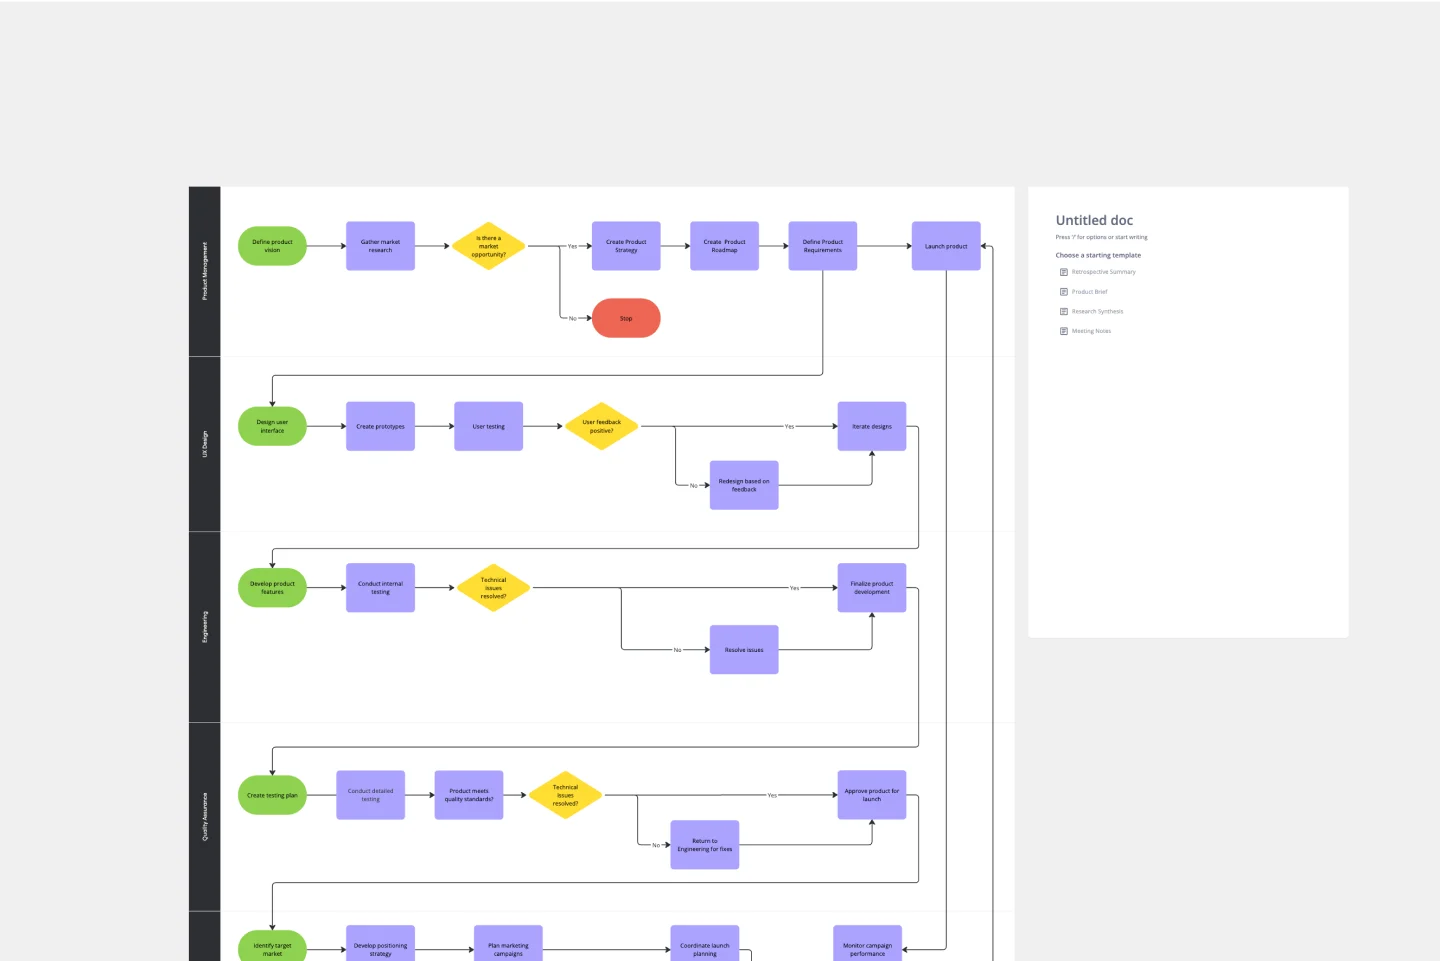
Product Development Process Flowchart Template
The Product Development Process Flowchart Template is a strategic tool designed to guide teams through the intricate journey of bringing a new product to market. This template serves as a visual roadmap, outlining each critical step in the product development lifecycle, from initial concept and design to testing, refinement, and eventual launch. It's structured to foster clarity, ensuring that all team members are aligned and aware of their roles and responsibilities at every phase.
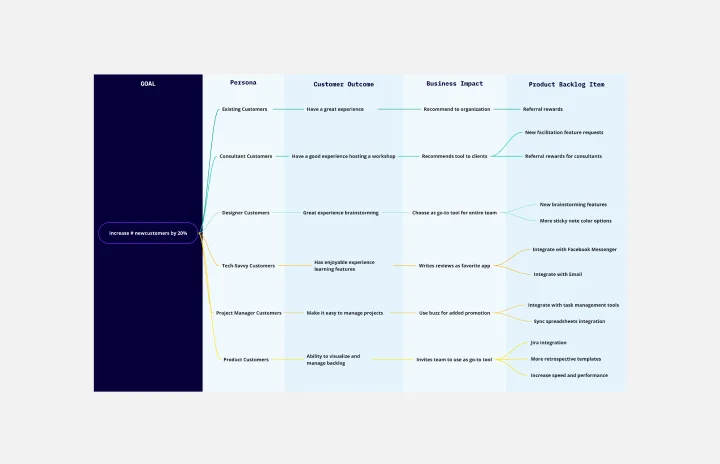
Outcome Mapping Template
Works best for:
Diagrams, Mapping, Project Management
Use Miro’s outcome mapping template to improve your operational efficiency. Outcome mapping will help you visualize all the possible strategic outcomes for your upcoming project, allowing you to see into the black box to identify any potential challenges along the way.
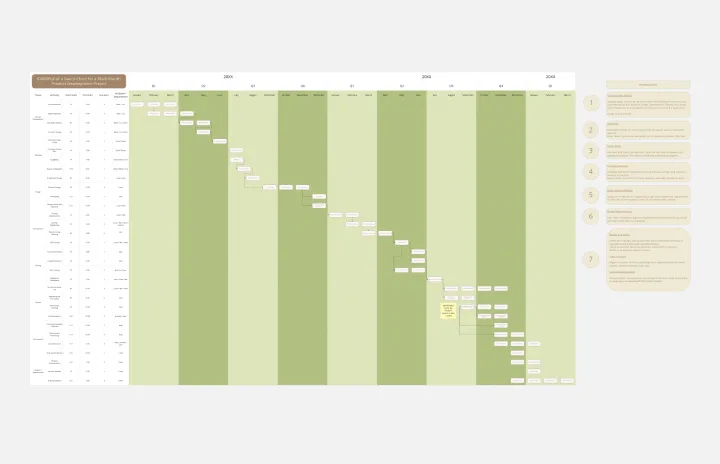
Product Development Gantt Chart
Works best for:
Gantt Chart, Planning
Developing a new product involves many steps and stakeholders. The Product Development Gantt Chart template helps you manage this complex process efficiently. Use it to outline each phase of development, set timelines, and assign responsibilities. Track progress and make adjustments as needed to stay on schedule. This template provides a clear visual representation, coordinating tasks for a successful product launch.