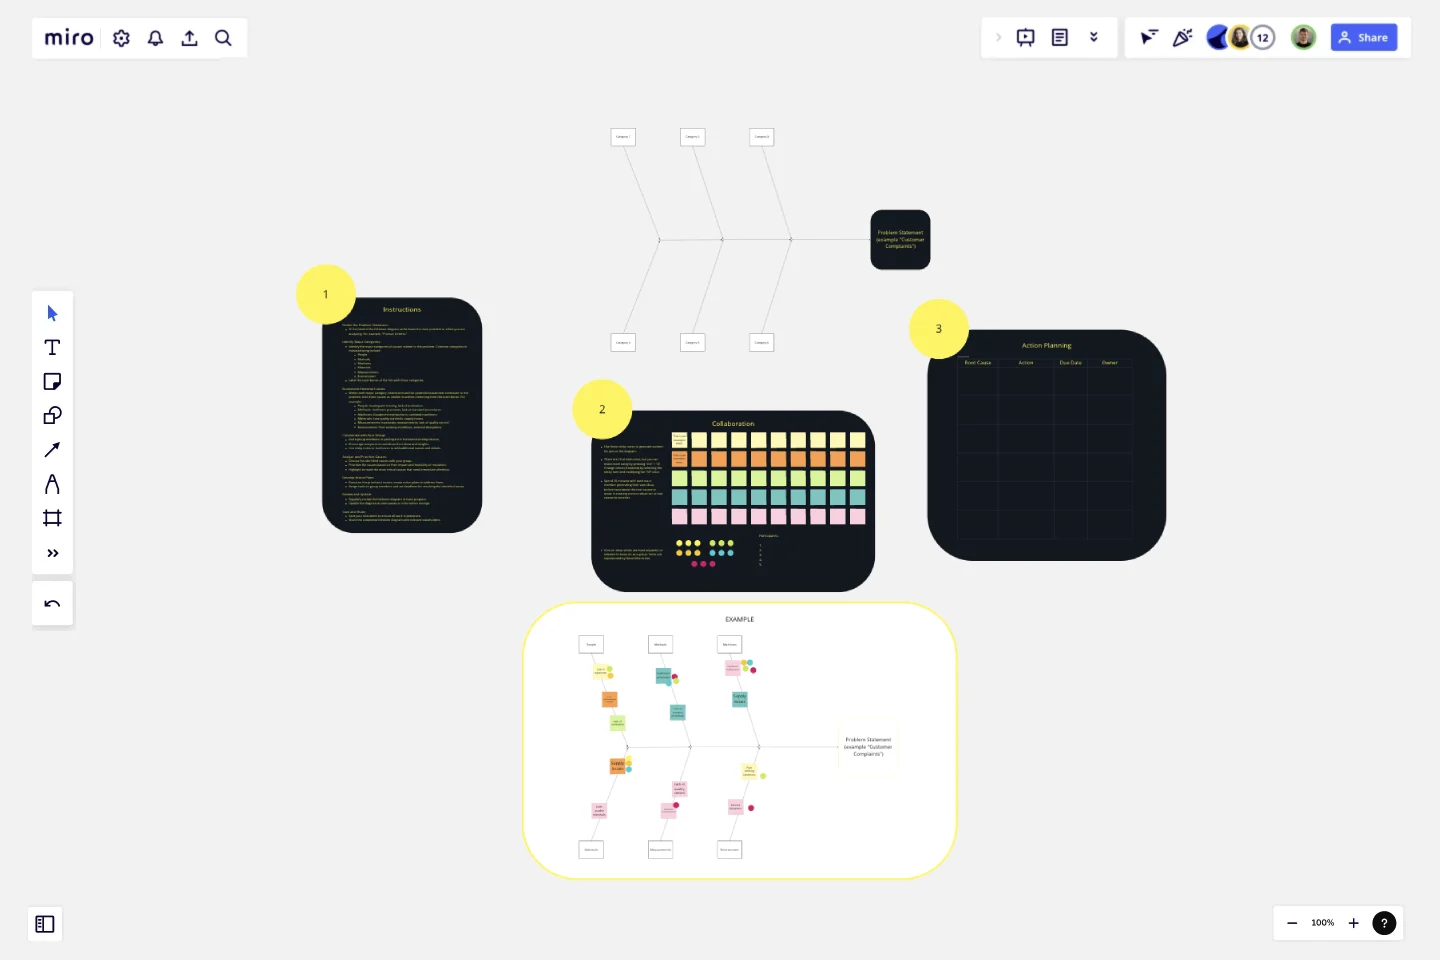
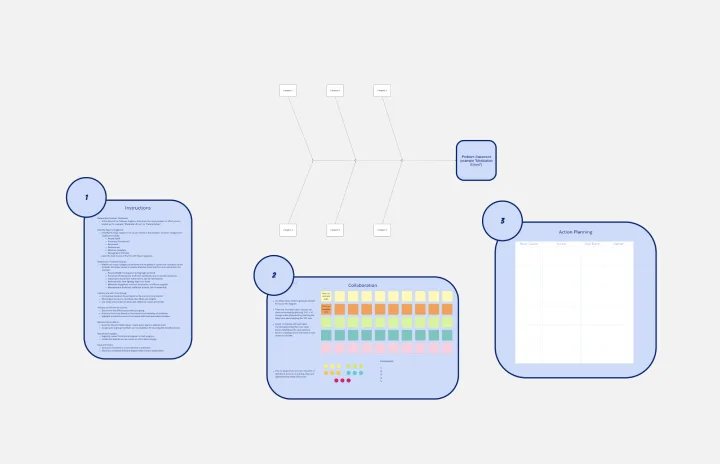
Fishbone Diagram for Manufacturing
The Fishbone Diagram for Manufacturing template is a specialized tool designed to help teams systematically analyze and identify the root causes of manufacturing-related issues.
Here’s why you should consider using this template:
Key Features:
Problem-Centric Design:
The diagram starts with a clear definition of the problem or effect you are addressing, such as "Product Defects" or "Production Delays," providing a focused approach to problem-solving.
Major Categories:
The template includes predefined categories relevant to manufacturing, such as People, Methods, Machines, Materials, Measurements, and Environment. These categories help in organizing potential causes systematically.
Structured Brainstorming:
Each category has branches for listing potential causes, encouraging thorough brainstorming and ensuring that no aspect of the manufacturing process is overlooked.
Collaborative Framework:
The template is designed for team collaboration, allowing multiple users to contribute their insights and ideas in a structured manner, fostering a comprehensive analysis.
Visual Clarity:
The fishbone (Ishikawa) diagram's visual structure makes it easy to understand the relationships between the problem and its potential causes, facilitating better communication and discussion among team members.
Why Use This Template?
Systematic Problem Analysis:
The Fishbone Diagram for Manufacturing template helps in systematically breaking down complex problems into manageable parts, making it easier to identify root causes.
Holistic View:
By considering multiple categories, the template ensures that all possible aspects of the manufacturing process are examined, leading to a more thorough investigation.
Improved Collaboration:
The template promotes team collaboration, ensuring that diverse perspectives are considered, which can lead to more innovative solutions and a better understanding of the problem.
Enhanced Decision-Making:
The structured approach of the template aids in prioritizing causes based on their impact, helping teams focus on the most critical areas first, thus improving decision-making and action planning.
Effective Communication:
The visual nature of the fishbone diagram makes it easier to communicate findings and strategies to stakeholders, ensuring that everyone is on the same page.
By using the Fishbone Diagram for Manufacturing template, teams can effectively analyze manufacturing issues, identify root causes, and develop targeted action plans to improve production quality and efficiency.
This template was created by Anthony.
Get started with this template right now.
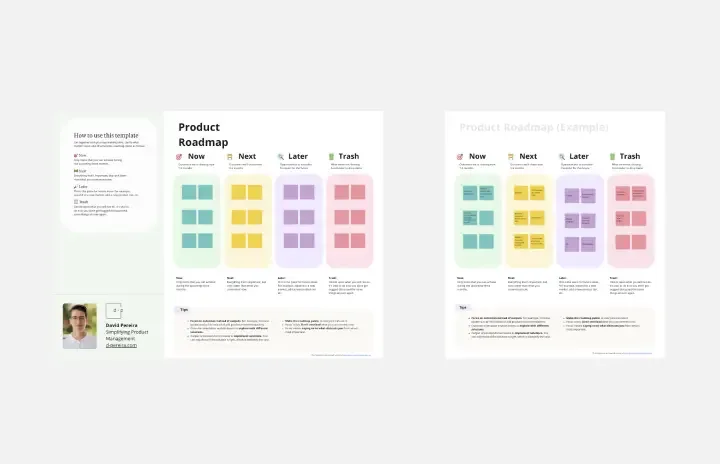
Product Roadmap (Now, Next, Later, Trash)
Works best for:
Planning, Mapping
The Product Roadmap (Now, Next, Later, Trash) template allows teams to organize their product development initiatives into four distinct categories: current priorities, upcoming features, future plans, and discarded ideas. By visualizing the roadmap in this manner, teams can maintain focus on immediate objectives while keeping an eye on future opportunities and managing stakeholder expectations effectively.
Fishbone Diagram for Healthcare
Works best for:
Fishbone Diagram
Ensuring high-quality care in healthcare settings requires a thorough understanding of root causes behind issues. The Fishbone Diagram for Healthcare template helps you analyze potential causes of problems in areas like patient care, staff performance, and administrative processes. This structured approach facilitates comprehensive analysis and collaborative problem-solving, ultimately leading to improved healthcare outcomes and patient satisfaction.
Daily Schedule Template
Works best for:
Planning, Project Management
The Daily Schedule Template is a vital tool for managing daily routines efficiently. It helps plan and organize tasks, appointments, and priorities with great precision. Its adaptability allows users to allocate time efficiently, adjust schedules as per changing priorities, and navigate the day with ease. With this template, individuals can integrate daily activities with their broader goals, contributing meaningfully to their overall success.
Porter's Five Forces Template
Works best for:
Leadership, Strategic Planning, Market Research
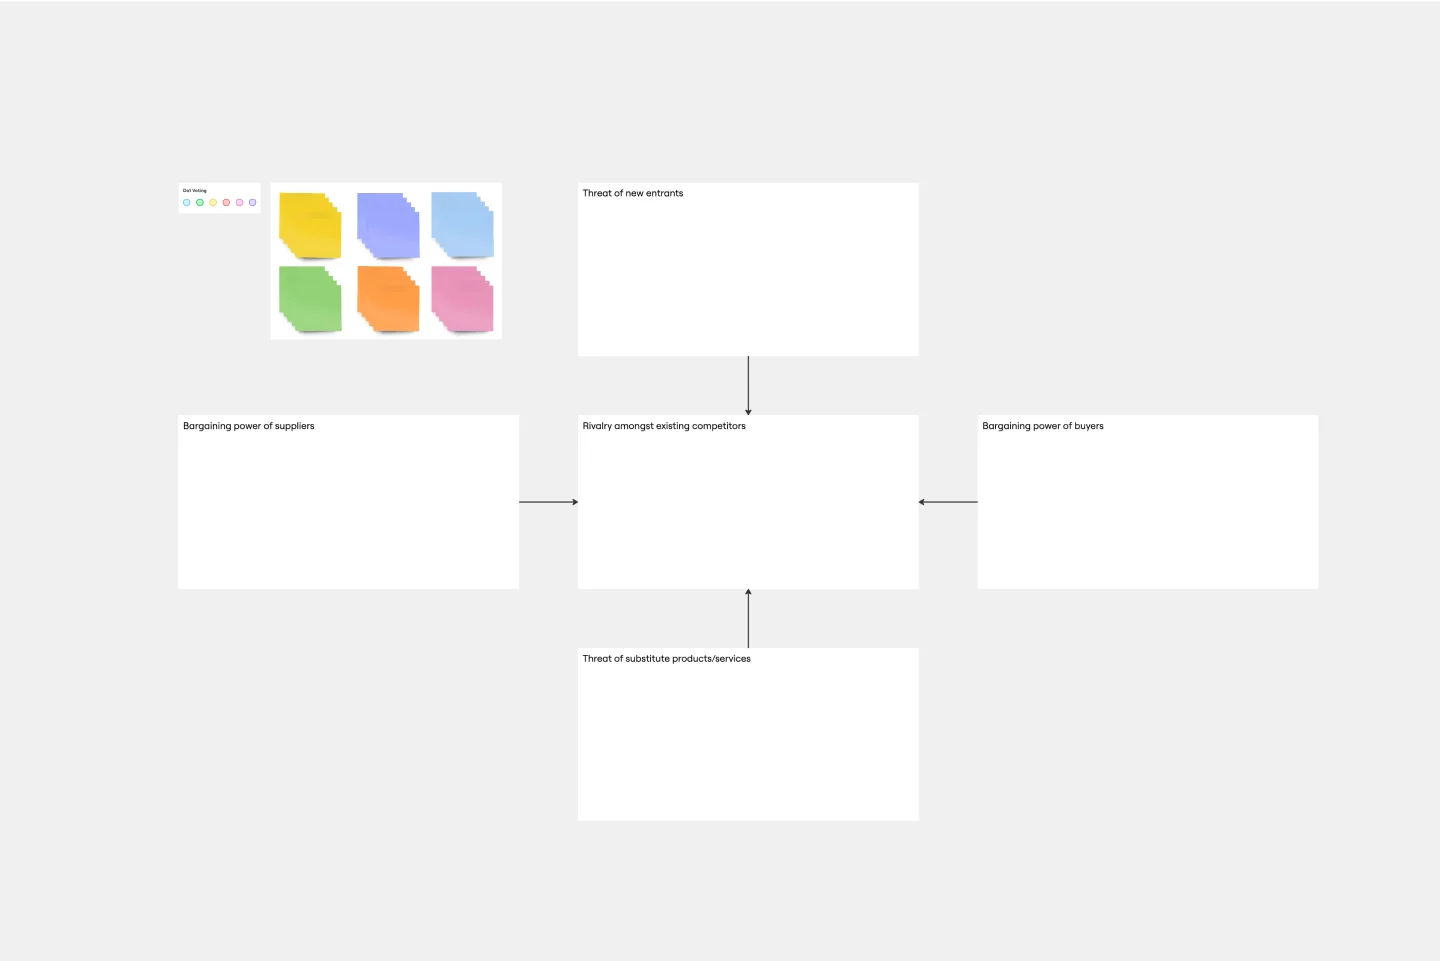
Developed by Harvard Business School professor Michael Porter, Porter’s Five Forces has become one of the most popular and highly regarded business strategy tools available for teams. Use Porter’s Five Forces to measure the strength of your current competition and decide which markets you might be able to move into. Porter’s Five Forces include: supplier power, buyer power, rivalry among existing competitors, the threat of substitute products or services, the threat of substitute products and services, and the threat of new entrants.
All-in-one PI Planning
Works best for:
Agile
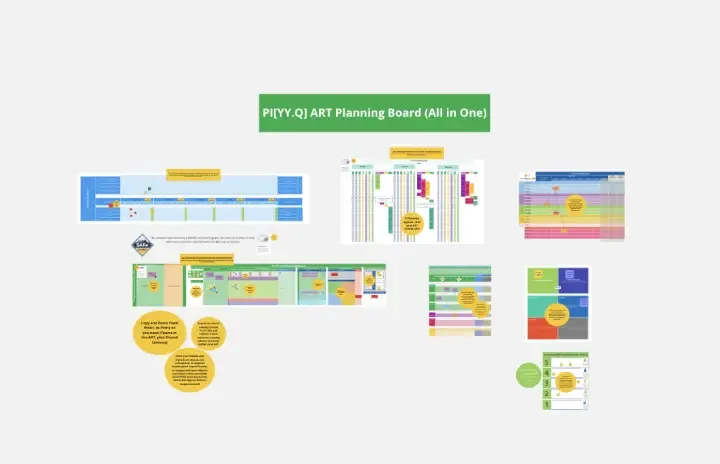
The All-in-one PI Planning template streamlines the SAFe Program Increment (PI) Planning process by providing a comprehensive framework for teams to collaboratively plan and align on objectives and dependencies. It integrates essential elements such as PI Objectives, Team Breakouts, and Program Board, enabling teams to visualize, prioritize, and coordinate work effectively. This template empowers Agile Release Trains to deliver value predictably and efficiently, driving alignment and synchronization across the organization.
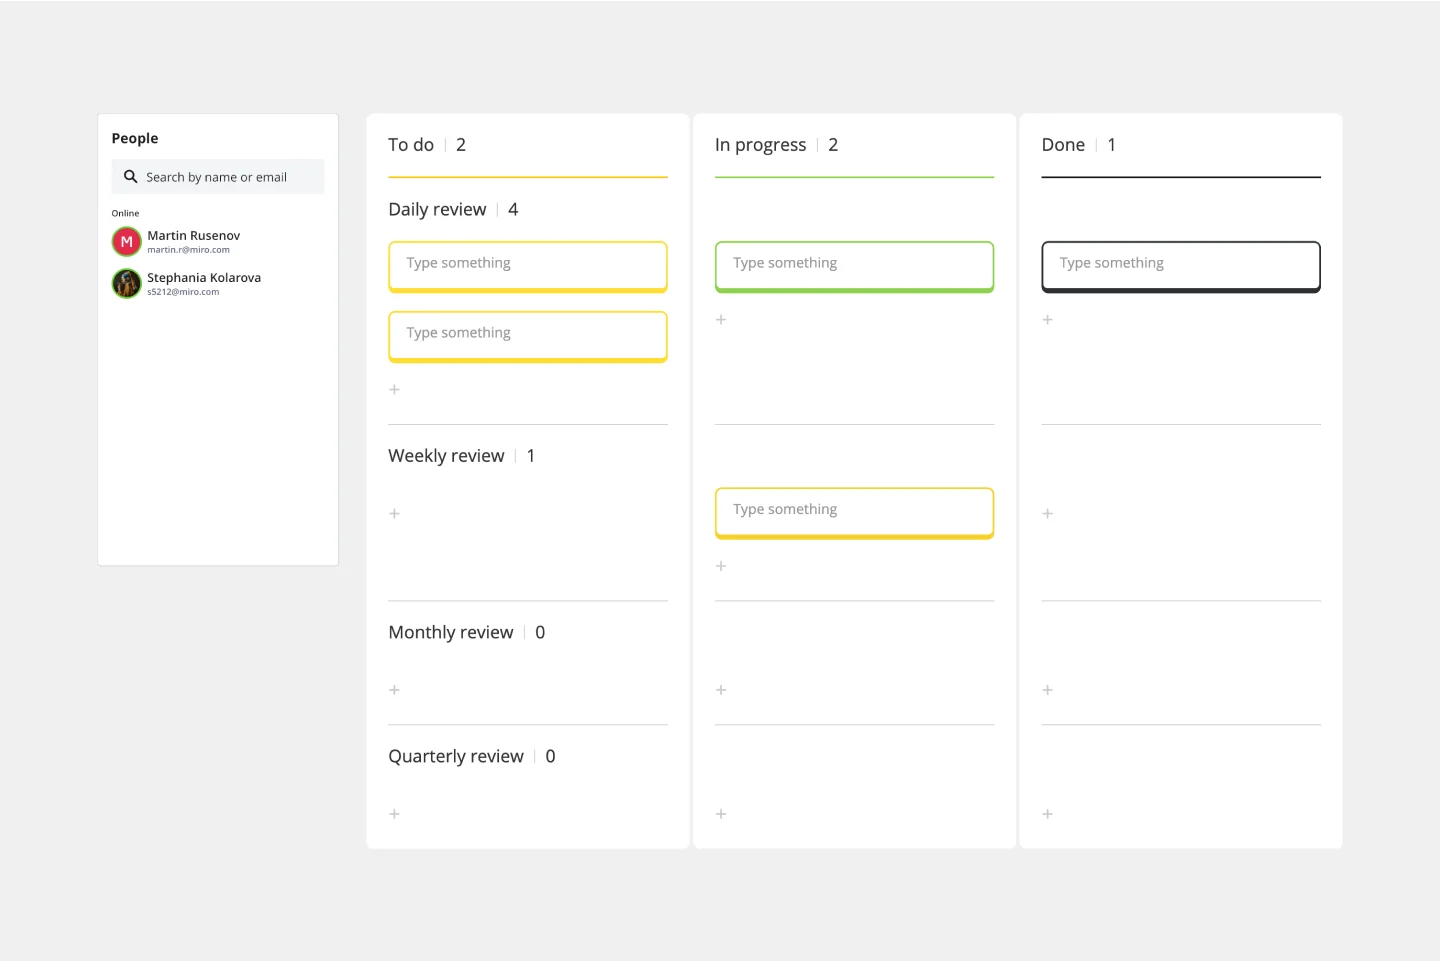
Action Plan Template
Works best for:
Education, Project Management, Project Planning, Kanban
Why create an action plan? Long-term business strategies and goals are only good if you can make them a reality—by accomplishing every small task along the way. An action plan lists those tasks and lays them out in clear detail. It helps you keep everything in order, make sure nothing is missed, and get stakeholders on the same page to complete a project quickly and effectively. This template will help you write an action plan that’s SMART: Specific, Measurable, Actionable, Realistic, and Time-bound.