Fibonacci Scale Template
Estimate how much effort it takes to perform tasks and assign teams during a work sprint efficiently with the Fibonacci Scale Template.
About the Fibonacci Scale Template
The Fibonacci scale is a series of numbers based on the Fibonacci sequence (0, 1, 2, 3, 5, 8, 13, 21, etc.). In the context of Agile, these numbers are used to estimate and agree upon the amount of effort required to complete a specific task. At the beginning of an Agile sprint, a team will discuss the various tasks that need to be completed and assign points to each task based on the Fibonacci scale.
What is the Fibonacci scale?
The Fibonacci sequence contains numbers that exhibit exponential growth, where each number is the sum of the two previous ones. That’s why Agile teams have come to use the Fibonacci scale for business because it’s easier to evaluate task efforts when you don’t have many numbers close to each other to choose from, as opposed to an even scoring scale. When managing a team, it’s often important to estimate how long it might take to complete a given task. More complex tasks are assigned more points, and smaller tasks are assigned fewer points. Managers can then review and prioritize tasks depending on their points. The Fibonacci scale is used to assign those point values.
How does the Fibonacci scale work?
The numbers in the Fibonacci scale are based on the Fibonacci sequence. In this sequence of numbers, each number is the summation of the two previous numbers. In the context of Scrum, the numbers represent the level of complexity and degree of difficulty involved in completing a task. For example, a task assigned “0” points would be very simple and quick to complete, a task assigned “1” point would be slightly more complex or time-consuming, and so on and so forth. Since the Scrum approach generally works in one-week sprints, it’s unlikely that many tasks will be assigned “21.”
Why use the Fibonacci scale?
The Fibonacci scale is a useful tool for a variety of reasons. For one, its growth is exponential. When estimating how long it might take to complete a task, estimating time for shorter tasks is much easier than estimating time for longer tasks. An exponential scale reflects that growing uncertainty. As you move up the scale, the numbers quickly become much larger.
Relatedly, the Fibonacci scale forces your team to make a choice. For example, when estimating time for a complex task, you ask, “is it an 8, 13, or 21?” and there is no in-between. This intuitive anchoring mechanism cuts down on debate and helps you make clear judgment calls.
Overall, the Fibonacci scale is a powerful method to ensure that work is distributed evenly and can help ensure that everyone is accurate when estimating the work and time involved in a project. If your team uses this approach on an ongoing basis, you will likely become more accurate and avoid overcommitting during each sprint.
How to use the Fibonacci Scale Template in Miro
Start selecting our ready-made Fibonacci Scale Template. It will help you visualize your team’s tasks, evaluate efforts and prioritize them.
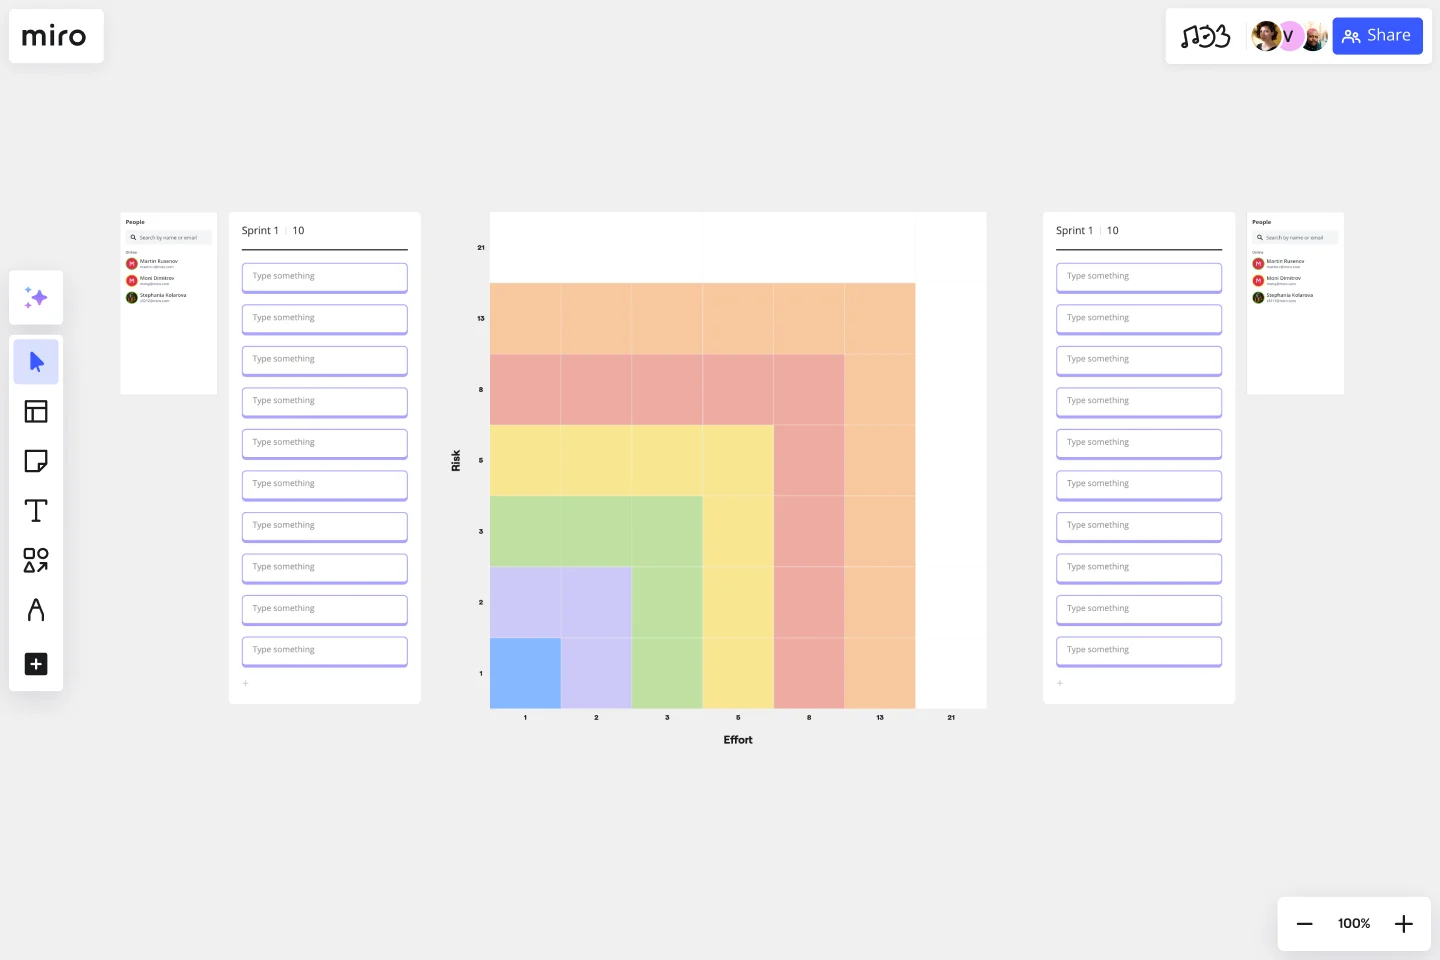
The Fibonacci Scale Template is divided into three sections:
User stories
Here is where you list tasks or user stories you want to estimate. If you use Jira, import stories as cards directly with the Jira app. Afterward, discuss with your team the risk and effort for each story.
Fibonacci Scale
Place the stories previously added to the sprint onto the Fibonacci scale matrix. Following your discussion, add them to the appropriate region according to their effort and risk levels.
To get perspectives and assess correctly how much effort and risk a task might take, allow each member to vote on the tasks with a unique emoji or sticker.
Priorities
Based on the Fibonacci scores and the team's prioritization, copy or drag stories onto the priorities frame. Be mindful of your team's capacity, and prioritize taking everyone’s opinions and schedules into consideration.
If you’re finding it hard to estimate task points, Artem Shein, Agile coordinator, created an interesting and fun template to help you and your team give points to tasks. Try it out!
Example of the Fibonacci Scale Template in action
Let’s say you are launching different product functionalities. You have user stories that look like this:
Service catalog
Calendar integration
Video integrations
Live cursors
After everyone has added their tasks to the Fibonacci scale, these are the points each task has:
Calendar integration: 8
Live cursors: 5
Video integration: 3
Service catalog: 2
To prioritize this list, start with the tasks with the least effort and lower risk. Those are the ones that your team will be able to deliver quicker. Afterward, list the ones that range from medium to high effort.
If you think a task that is higher up on the scale might not require so much effort, discuss it with your team to see what you can do to make its completion easier. You can also use Miro's Planning Poker tool to do better estimations with your team.
Create your priority list according to your team’s feedback and assign each task to its owner via Jira cards or tagging the stickies on your Fibonacci Scale Template.
Get started with this template right now.

Storyboard Template
Works best for:
Design Thinking
While storyboard is typically associated with planning out scenes for a movie or TV show, it’s been widely adopted throughout the business world. A storyboard is a sequence of illustrations that are used to develop a story. You can use the Storyboarding template anytime you’d like to really put yourself in a customer or user’s position and understand how they think, feel, and act. This tactic can be especially useful when you know there’s a problem or inefficiency with an existing process. You can storyboard existing processes or workflows and plan how you would like them to look in the future.
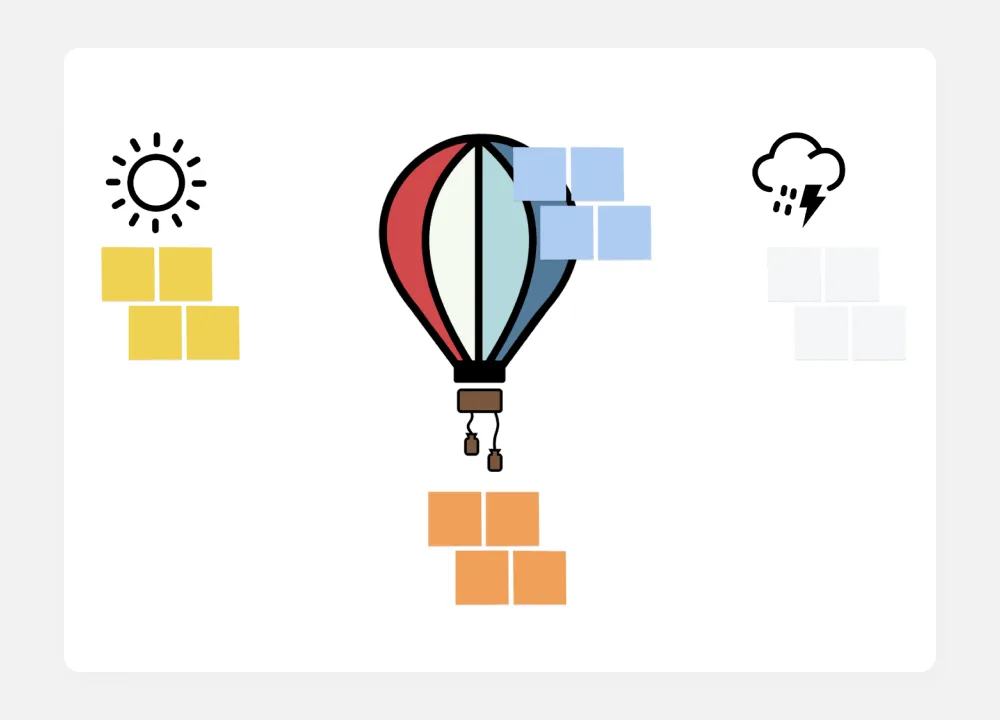
The Hot Air Balloon Retrospective
The Hot Air Balloon is a simple activity for helping the team identify things that makes them move faster, and things that slow them down.
Agile Transition Plan Template
Works best for:
Agile Methodology, Agile Workflows
An Agile transformation roadmap can help you, your team, and your organization transition from rigid compliance-heavy methods to the more flexible Agile way of doing things incrementally. From requirements to integrations to security, you can map out your organization's moving parts as “swim lanes” that you can then update regularly. Use your roadmap as a way to tell the story of how you see your product growing over a period of time. Get buy-in without overselling and keep your roadmap simple, viable and measurable. By using an Agile transformation roadmap, you can avoid getting bogged down in details and instead invest in big-picture strategic thinking.
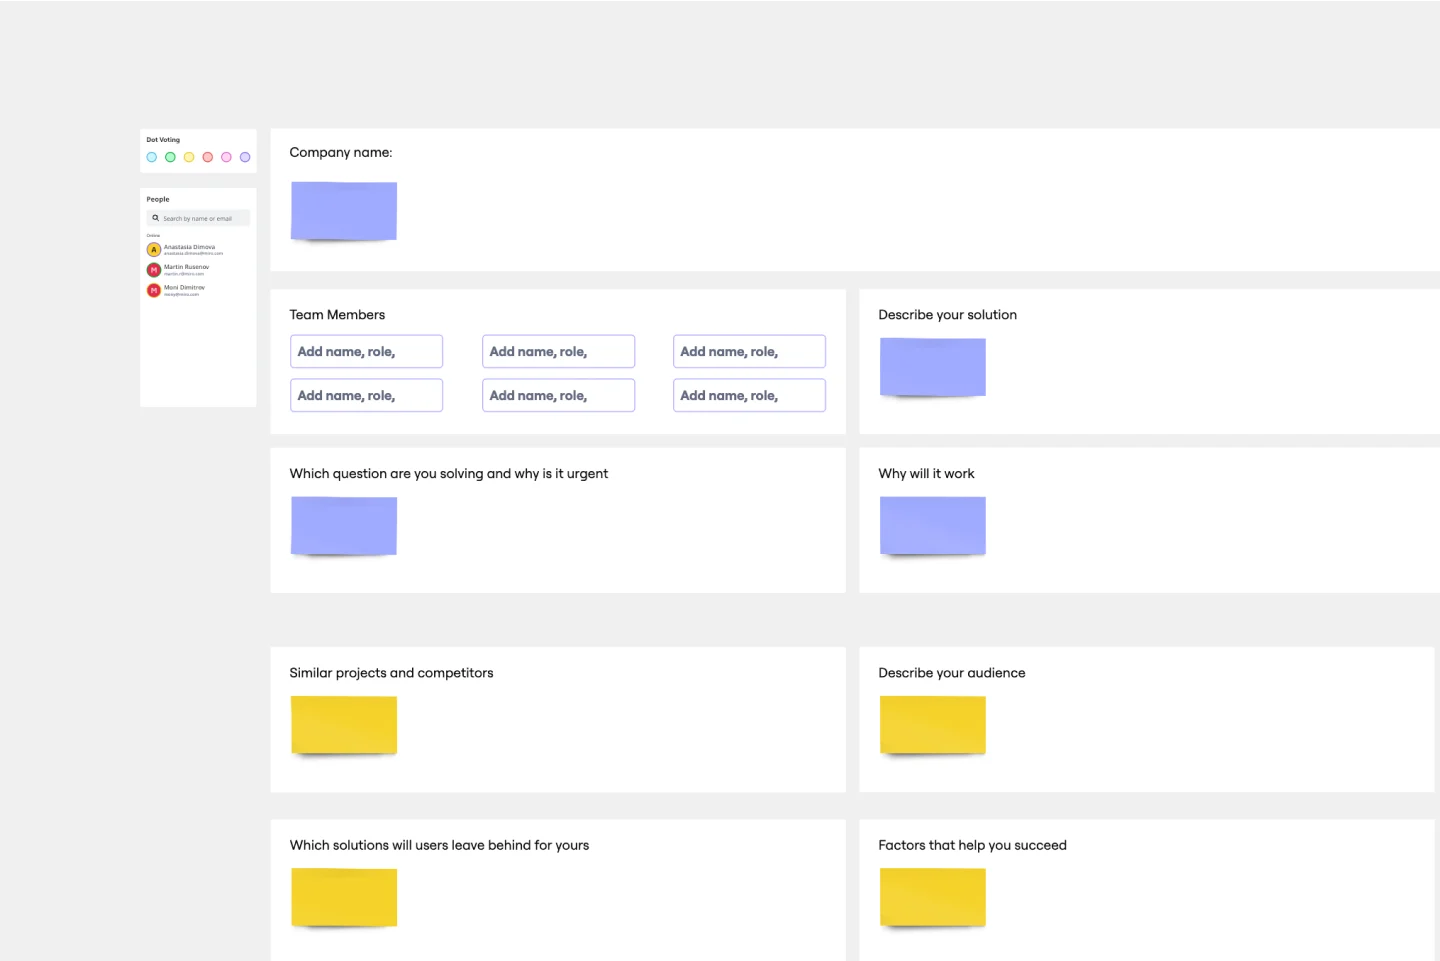
Startup Canvas Template
Works best for:
Leadership, Documentation, Strategic Planning
A Startup Canvas helps founders express and map out a new business idea in a less formal format than a traditional business plan. Startup Canvases are a useful visual map for founders who want to judge their new business idea’s strengths and weaknesses. This Canvas can be used as a framework to quickly articulate your business idea’s value proposition, problem, solution, market, team, marketing channels, customer segment, external risks, and Key Performance Indicators. By articulating factors like success, viability, vision, and value to the customer, founders can make a concise case for why a new product or service should exist and get funded.
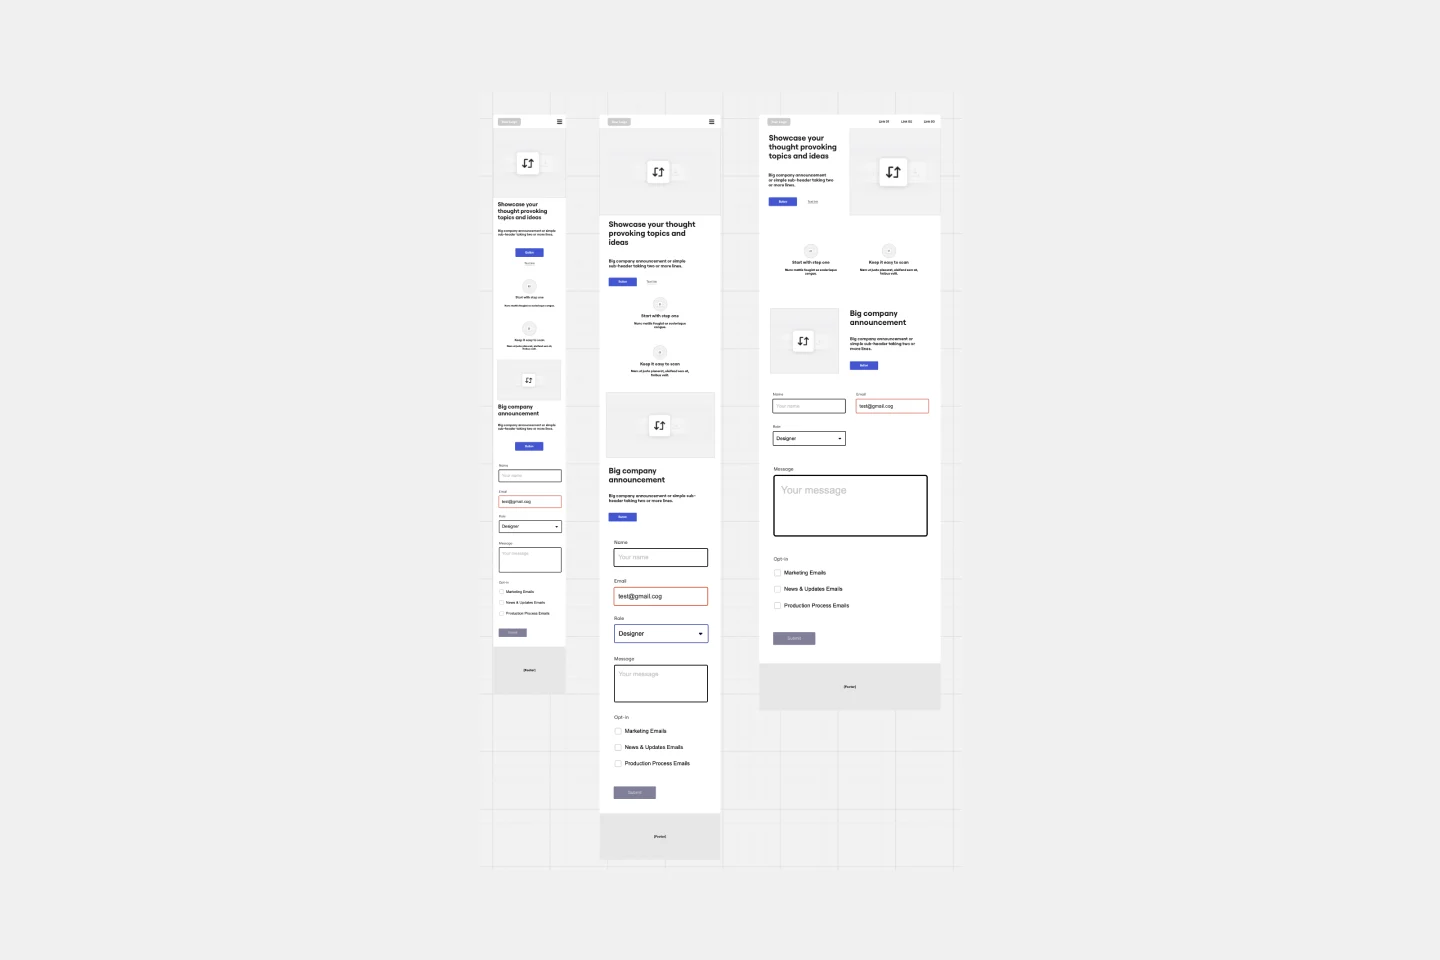
Website Wireframing Template
Works best for:
Wireframes, User Experience
Wireframing is a method for designing a website at the structural level. A wireframe is a stylized layout of a web page showcasing the interface elements on each page. Use this Wireframe Template to iterate on web pages quickly and cheaply. You can share the wireframe with clients or teammates and collaborate with stakeholders. Wireframes allow teams to get stakeholder buy-in without investing too much time or resources. They help ensure that your website’s structure and flow will meet user needs and expectations.
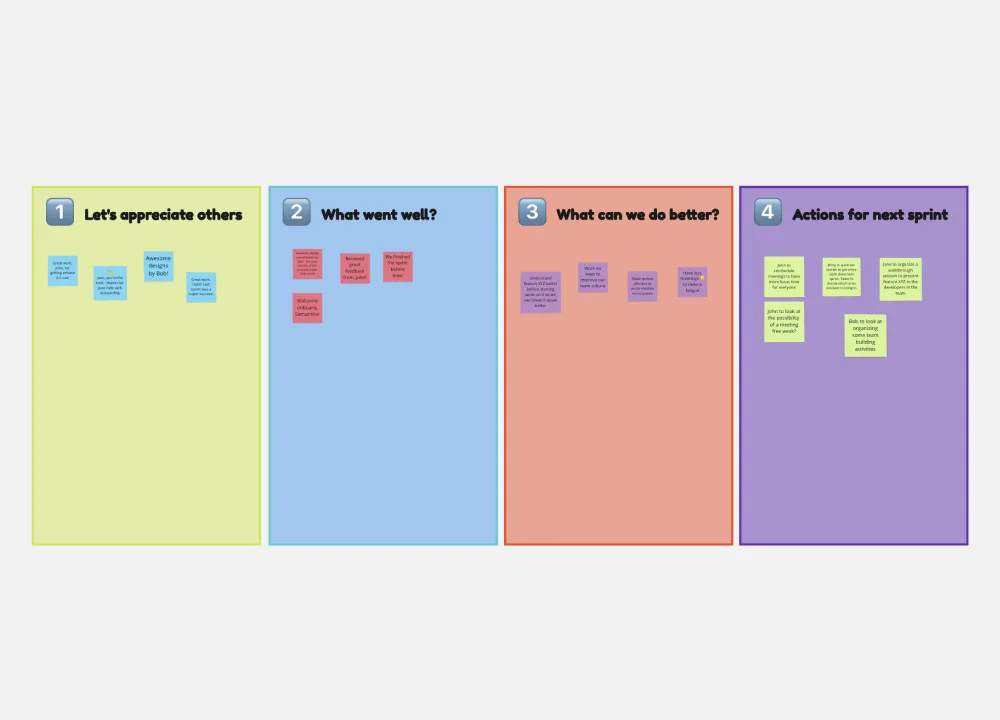
The 4-Step Retrospective
Works best for:
Retrospectives, Agile Methodology, Meetings
The 4-Step Retrospective template offers a simple yet effective framework for conducting retrospectives. It provides steps for reflecting on what went well, what didn't go well, what could be improved, and action planning. This template enables teams to systematically review past iterations, identify areas for growth, and implement actionable improvements. By promoting a structured approach to reflection and improvement, the 4-Step Retrospective empowers teams to drive continuous learning and enhancement effectively.