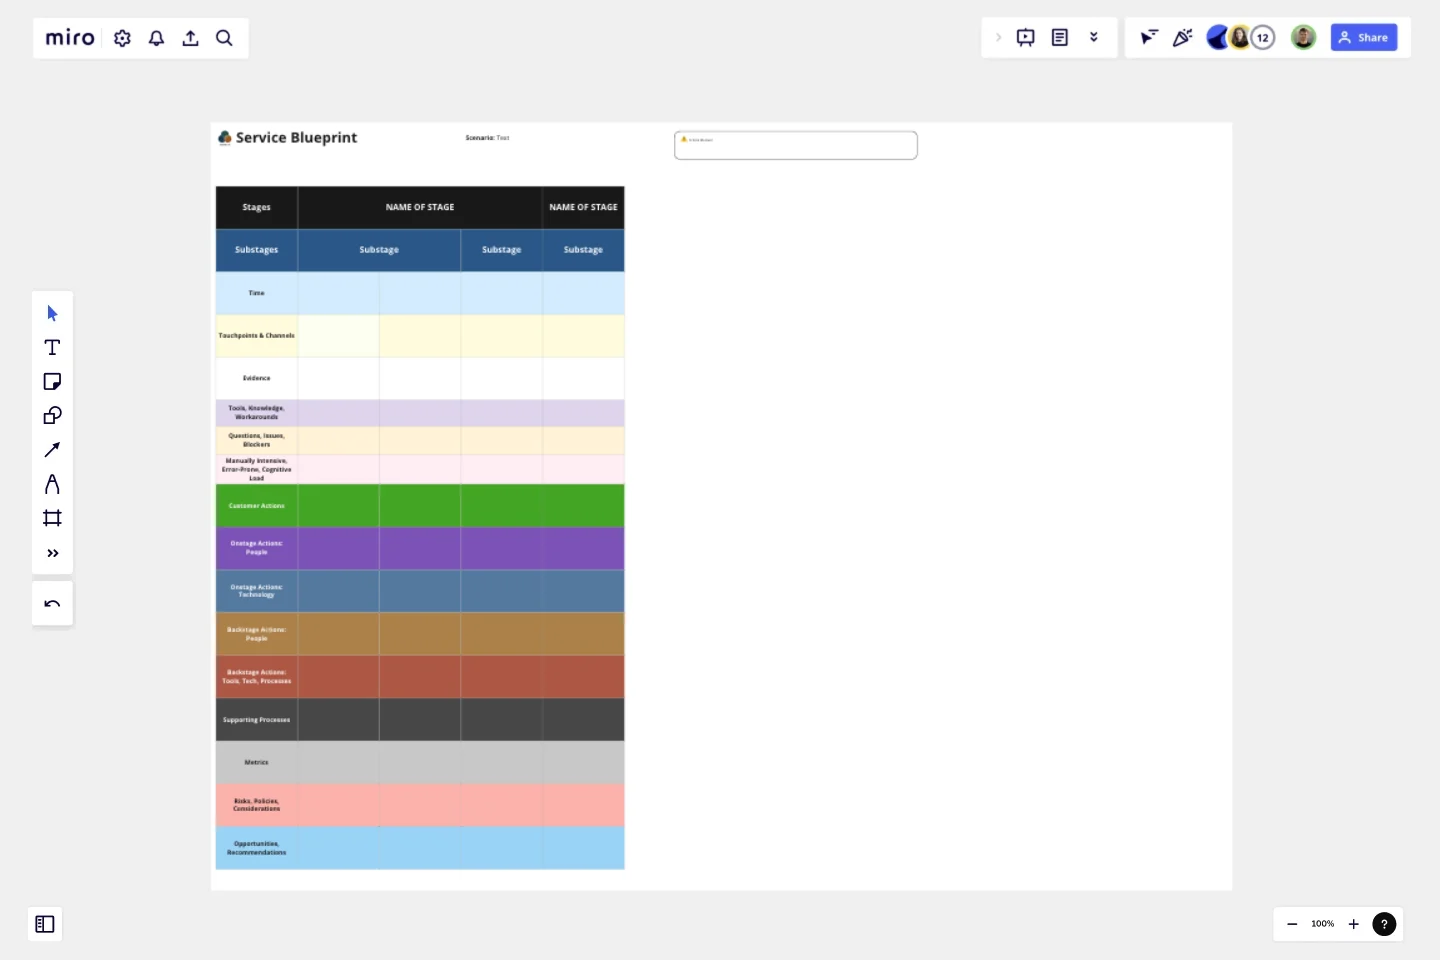
Expanded Service Blueprint
It uses Miro's table widget so that you can easily reorder columns and merge cells across columns (as the example shows).
This has standard swim lanes, but adds:
Touchpoints, Channels - where or how is the customer interacting with us?
Aspects of Larry Marine's Task Analysis approach, including what I'm calling his Task Detractors - 3 swim lanes for tools, knowledge, workarounds; questions, issues, blockers; manually intensive, error-prone, and cognitive load. Looking at these details surfaces way opportunities to improve the flow and experience.
Metrics - how did we measure this or what numbers/data did we see related to this step? For the future state, what will we measure and how (success criteria)?
Risks, Policies, Considerations - I believe companies don't document current/potential risk enough. This might include laws and regulations we should consider.
Opportunities, Recommendations - Early insights and suggestions, step by step.
When would I use this?
Service design and service blueprinting.
After qualitative CX or UX research such as observations studies, contextual inquiry, interviews, and IDIs.
In the workshop to finalize your current or future state service blueprint.
Because your customer journey map isn't telling enough of the story.
Why doesn't this show emotions, feelings, or quotes?
It's already rather tall!
You can add emojis to the Customer Actions line if you'd like to summarize or show how they are likely to feel during that step.
This isn't a CJM. The focus is more on experiences and the interplay with our Onstage and Backstage people, processes, props, and systems.
This template was created by Debbie Levitt.
Get started with this template right now.
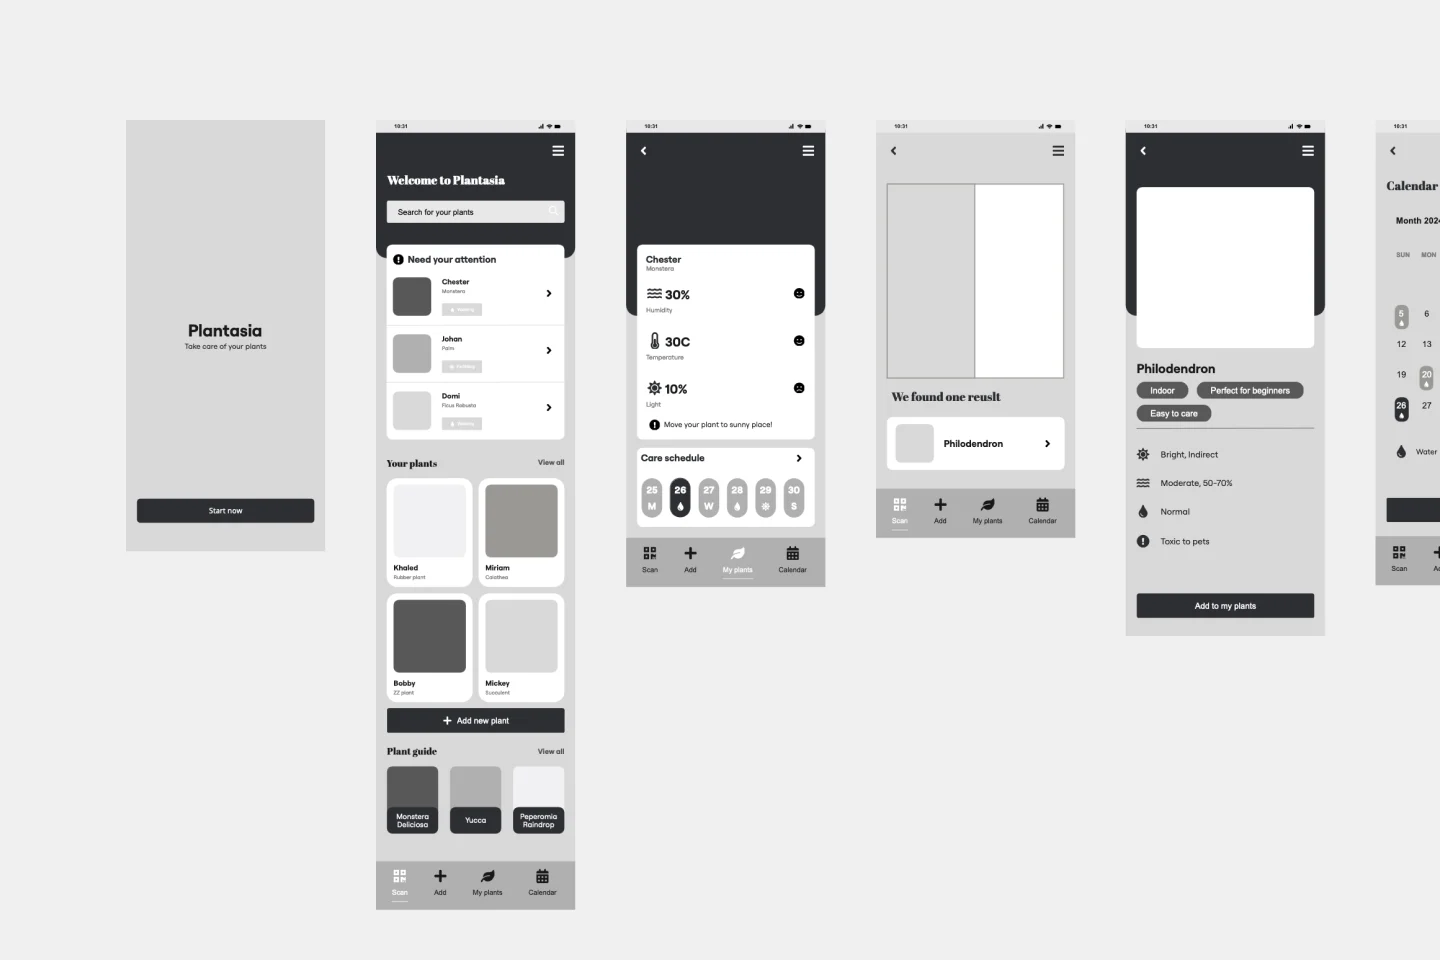
Plant Care App Wireframe Template
Works best for:
Wireframe, UX, Design
The Plant Care App Wireframe template provides a multi-screen app wireframe along with all the necessary design pages to get started. You can easily customize the wireframe to meet the specific needs of your client or personal project. Add, remove, or adjust screens to create a smooth user flow, and personalize the design by modifying colors, typography, and layouts. Leverage our AI-powered features to further enhance your app design.
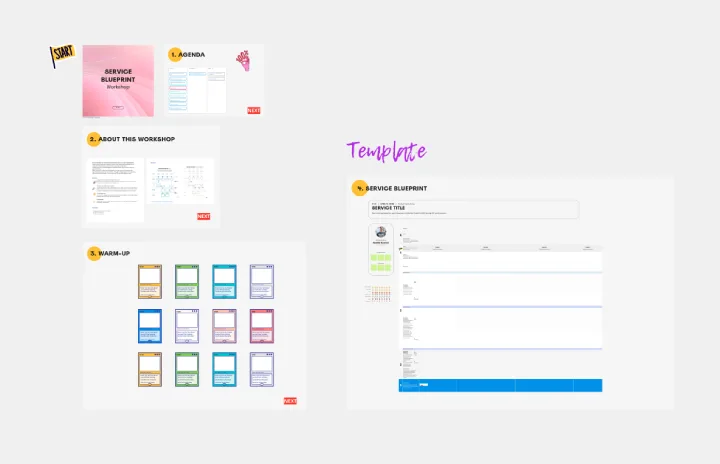
Service Blueprint Workshop
Works best for:
Research & Design
The Service Blueprint Workshop by Lidia Olszewska is designed for collaborative service design sessions. This template helps teams visualize service processes, identify pain points, and brainstorm solutions. Use it to align cross-functional teams, improve service delivery, and ensure a seamless customer experience. It's ideal for workshops aimed at service optimization, fostering collaboration, and strategic planning in service design.
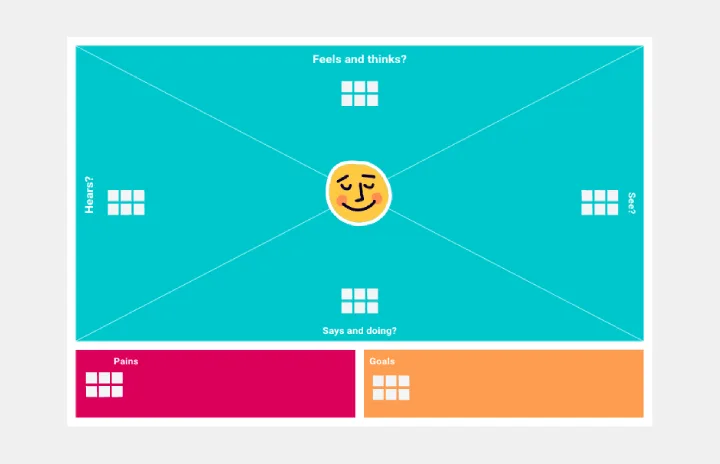
Empathy Map by Medicenjuande
Works best for:
Market Research, Research & Design
Empathy Map template provides a clear way to visualize user insights. By understanding what users think, feel, and experience, you can design products that truly resonate. This template is perfect for UX teams focused on user-centered design.
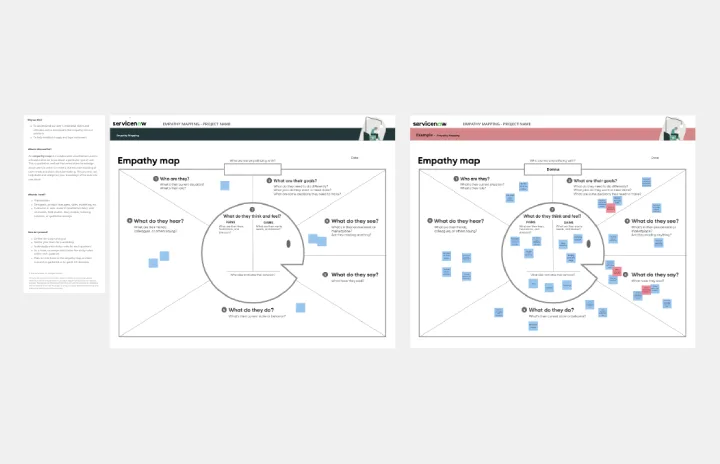
Empathy Mapping by ServiceNow
Works best for:
Research & Design, Market Research
The Empathy Mapping template helps teams capture detailed user insights. By understanding user perspectives, you can improve product features and customer satisfaction. This template is perfect for user research and product development.
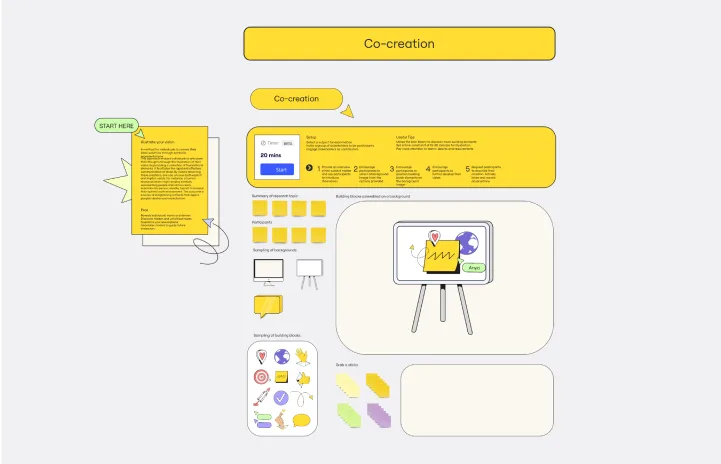
Co-Creation Template
Works best for:
Design
The Co-Creation Template enables the visual expression of ideas using essential elements. Analysis of these creations identifies explicit and implicit needs. For instance, a human resources team may use symbols to envision their ideal work environment. The output reflects people's desires and expectations.
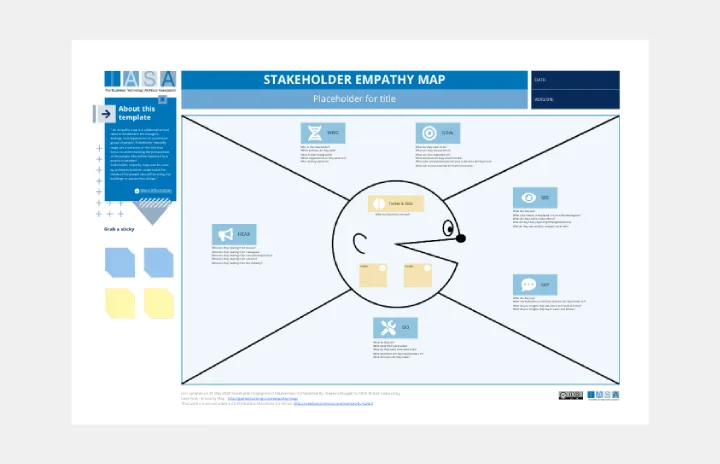
Stakeholder Empathy Map by IASA
Works best for:
Market Research, Research & Design
Stakeholder Empathy Map Template is designed to understand the perspectives of stakeholders. It helps you capture their needs, concerns, and motivations, ensuring your projects align with stakeholder expectations and foster better collaboration.