Entity Relationship Diagram Template
Understand how the elements of your database interact with each other by using our entity relationship diagram (ERD) template.
About the Entity Relationship Diagram (ERD) Template
Explaining the ins and outs of a complex system is no easy feat — especially when you need to communicate with teammates, clients, or stakeholders. That’s where an entity relationship diagram (ERD) template can help. An ERD is a diagram that outlines how entities relate to each other within a complex system. Some examples include illustrating how information flows within a complex database design or depicting the different stages of a product delivery process.
In other words, an ERD helps you and your team better understand important yet complex concepts by presenting them in more digestible ways. And Miro’s ERD template allows you to kickstart the process of creating one.
How to use the entity relationship diagram (ERD) template
Ready to create an ER diagram? Scroll to the top of this page and click on the blue “Use template” button. That’ll take you straight to the template in Miro, allowing you to start editing it and making it your own. Once you’re there, here are four tips to make the most of the ERD template:
Step 1: Identify all entities in the system
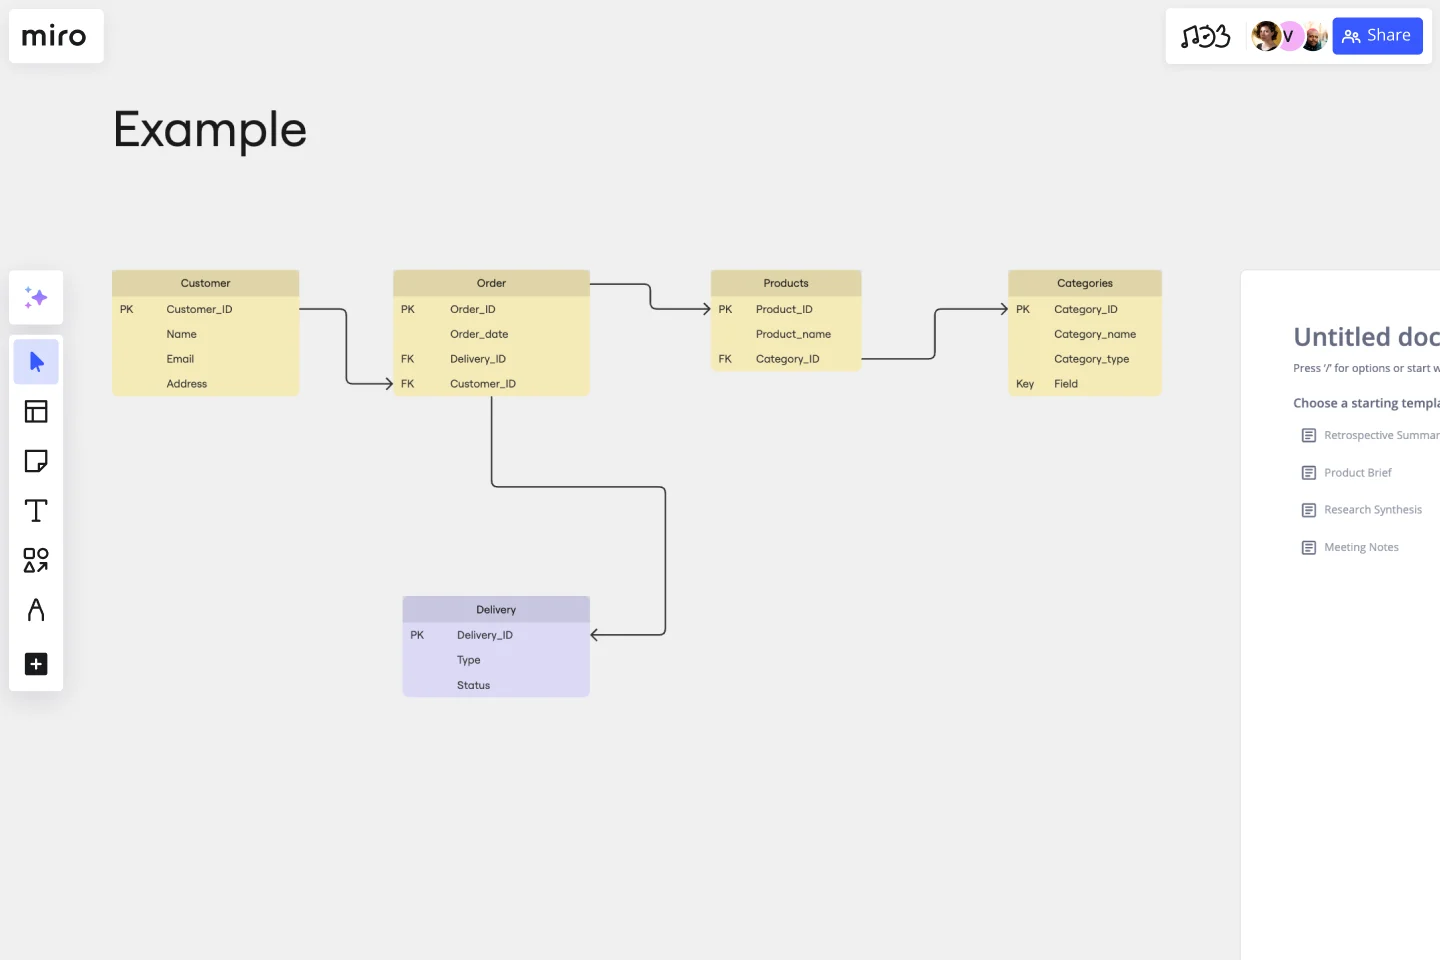
An entity is anything that you can define, such as a person, concept, or object. Start by identifying what these are in your system and outlining them in the diagram. In the template, you’ll see five entities: customer, order, products, categories, and deliveries. To replace the existing text with your own, simply double-click to edit. Once you’ve identified all your entities, use the additional text boxes in each rectangle to add any supporting information.
Step 2: Identify relationships between entities
On the template, the connection lines between entities represent the relationships between them. To rearrange them, click on a connection line to reveal blue dots on each end of the line. Click on one of these dots and drag the end of the connection line to the entity you want it to lead to.
To add more connection lines, click on an entity to reveal blue dots around the rectangle, and click on one where you’d like to add a new line. You can also delete connection lines by clicking on them and hitting “Delete” on your keyboard.
Step 3: Customize your diagram
Time to truly make the ERD template your own. Add shapes, change colors, edit text, and use sticky notes to customize the overall look and feel. This step is especially helpful if you’d like your ER diagram to reflect your own brand style and colors. With Miro’s template, you can also upload your own files (such as documents and images) to further personalize and enhance your ER diagram.
Step 4: Share it with your team
Invite teammates to view your Miro board and leave comments by clicking on the blue “Share” button on the top right of your Miro board. Alternatively, you can also export your ER diagram as a PDF, image, and CSV.
Benefits of using an entity relationship diagram (ERD) template
There are various advantages to using Miro’s ER diagram template. On top of saving time from having to build one from scratch, you don’t have to create your diagram alone. Invite multiple collaborators to fill the ERD template with you in real time, or share it with them when you’re ready by inviting them to view it and leave comments.
And you’re not limited to using the pre-made shapes in the template. Miro makes it easy for you to add and remove elements from your template and even drag and drop your own files straight onto your Miro board. In other words, Miro’s ERD template makes it easy for anyone to create an ER diagram — even if they’re not familiar with the tool.
If you'd prefer to start from scratch when it comes to visualizing your database or system, Miro's diagramming capabilities make it the perfect ER diagram maker.
Who should use the ERD template?
ER diagrams are powerful visual tools for representing complex systems and illustrating the various relationships within them. Professions that could benefit from using the ERD template include software engineers, system architects, database designers and developers, business analysts, and project managers.
Why do I need an ER diagram tool?
Using an ERD tool like Miro can help you design a clear and visually appealing diagram while making it easy to collaborate and communicate with teammates. Miro’s real-time collaboration features enable you to invite people to design your ER diagram together with you at the same time, even if you aren’t in the same room.
Can I export my ERD template to other formats like PNG and PDF?
Yes, when you’ve completed your ERD template, you can easily export it as an image or PDF file. Simply head toward the top left of your Miro board, click on the button labeled “Export this board,” and choose the export option that best suits your needs.
Get started with this template right now.
Production Workflow Template
Works best for:
Agile Workflows, Agile Methodology, Project Management
Whether you’re producing a podcast, a marketing campaign, a TV show, or a piece of content, establishing a production workflow is crucial. A production workflow creates a visual guide to the different steps in a process. It can be used to train new team members or give a high-level overview to stakeholders. Although production workflows vary by team and business, they generally contain information about who the stakeholders are, how you brainstorm ideas, what your timeline looks like, and what resources you need to succeed.
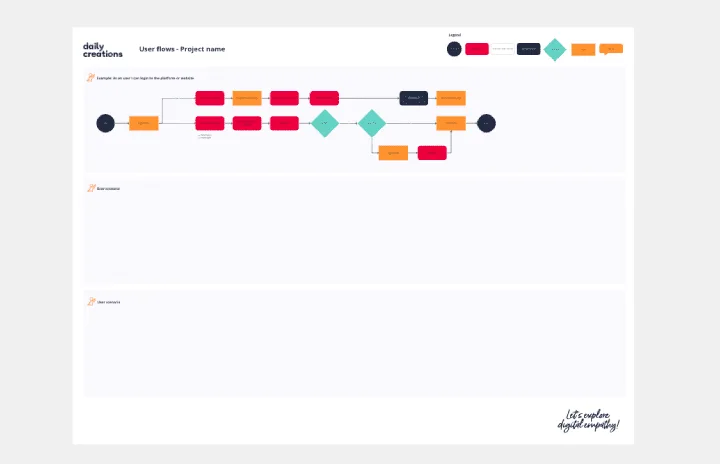
User Flows
The User Flows template offers a visual tool for mapping out the sequence of steps that users take to accomplish a specific task or achieve a goal within a digital product or service. It provides elements for documenting user interactions, screens, and decision points along the user journey. This template enables UX designers and product teams to understand user behaviors, identify pain points, and optimize the user experience effectively. By promoting user-centric design and empathy, the User Flows template empowers teams to create intuitive and engaging digital experiences that meet user needs and drive satisfaction.
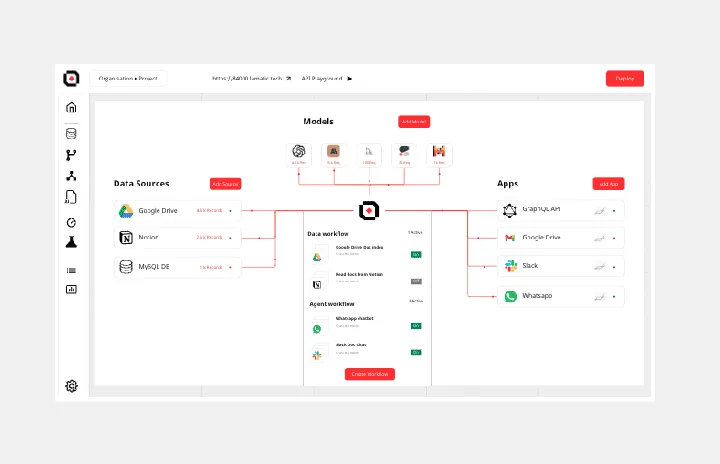
GenAI Application Workflow
Works best for:
Flowcharts, Mapping, Diagrams
The GenAI Application Workflow template is a visual tool for mapping out the workflow of applications developed using GenAI. It provides elements for defining process steps, decision points, and data flows within the application. This template enables developers and project teams to visualize the application workflow, identify potential bottlenecks, and optimize the user experience. By promoting clarity and efficiency in application development, the GenAI Application Workflow empowers teams to deliver innovative and user-friendly applications effectively.
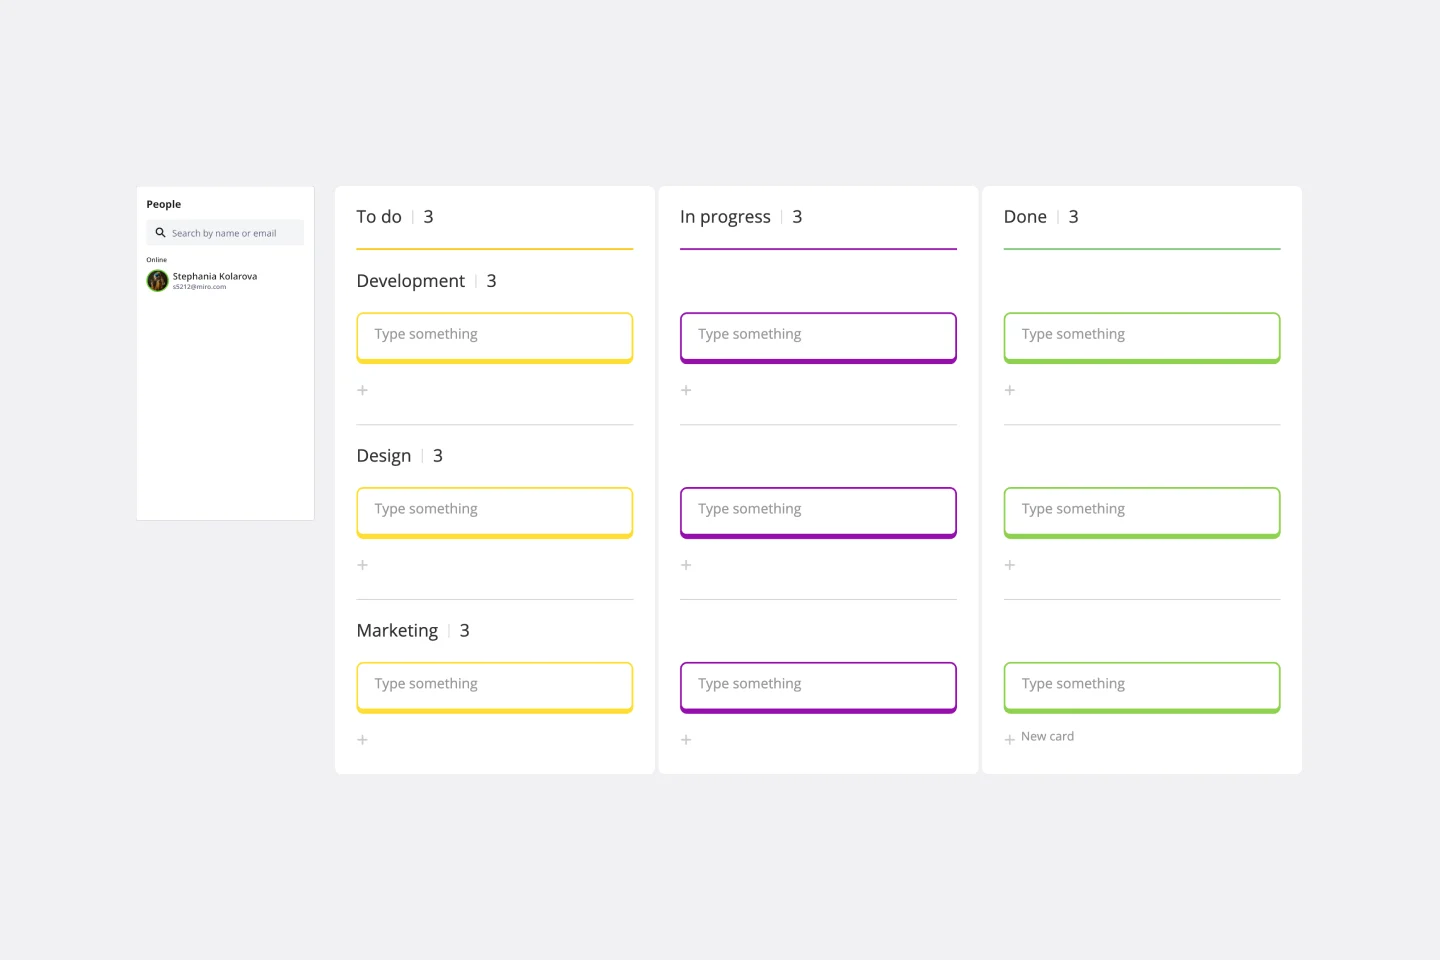
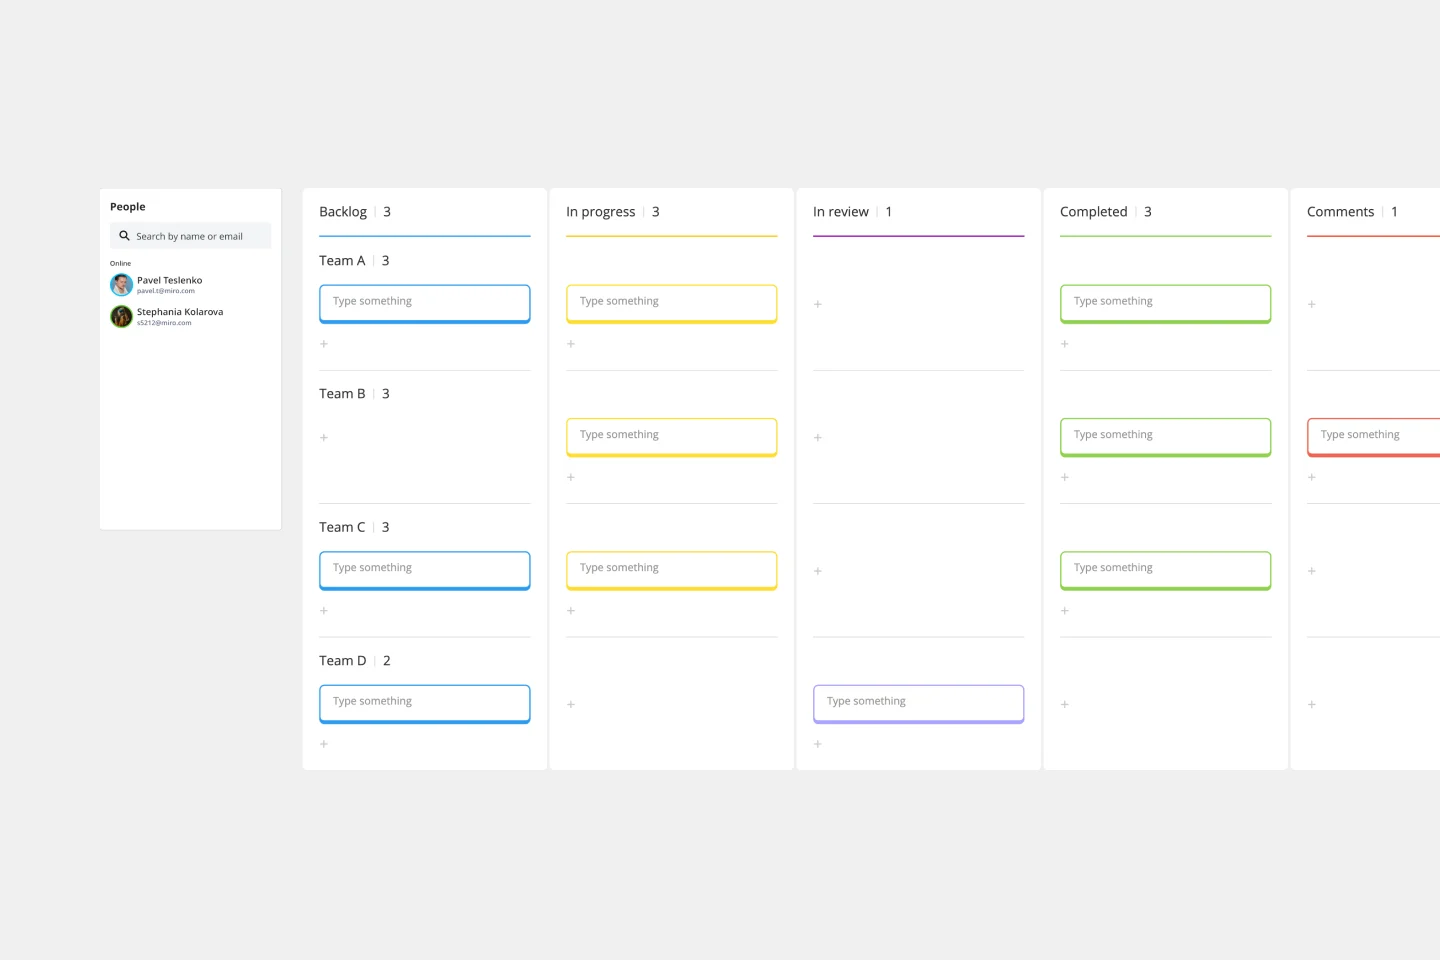
Agile Board Template
Works best for:
Agile Methodology, Meetings, Agile Workflows
Part of the popular Agile framework, an Agile Board is a visual display that allows you to sync on tasks throughout a production cycle. The Agile Board is typically used in the context of Agile development methods like Kanban and Scrum, but anyone can adopt the tool. Used by software developers and project managers, the Agile Board helps manage workload in a flexible, transparent and iterative way. The Agile template provides an easy way to get started with a premade layout of sticky notes customizable for your tasks and team.
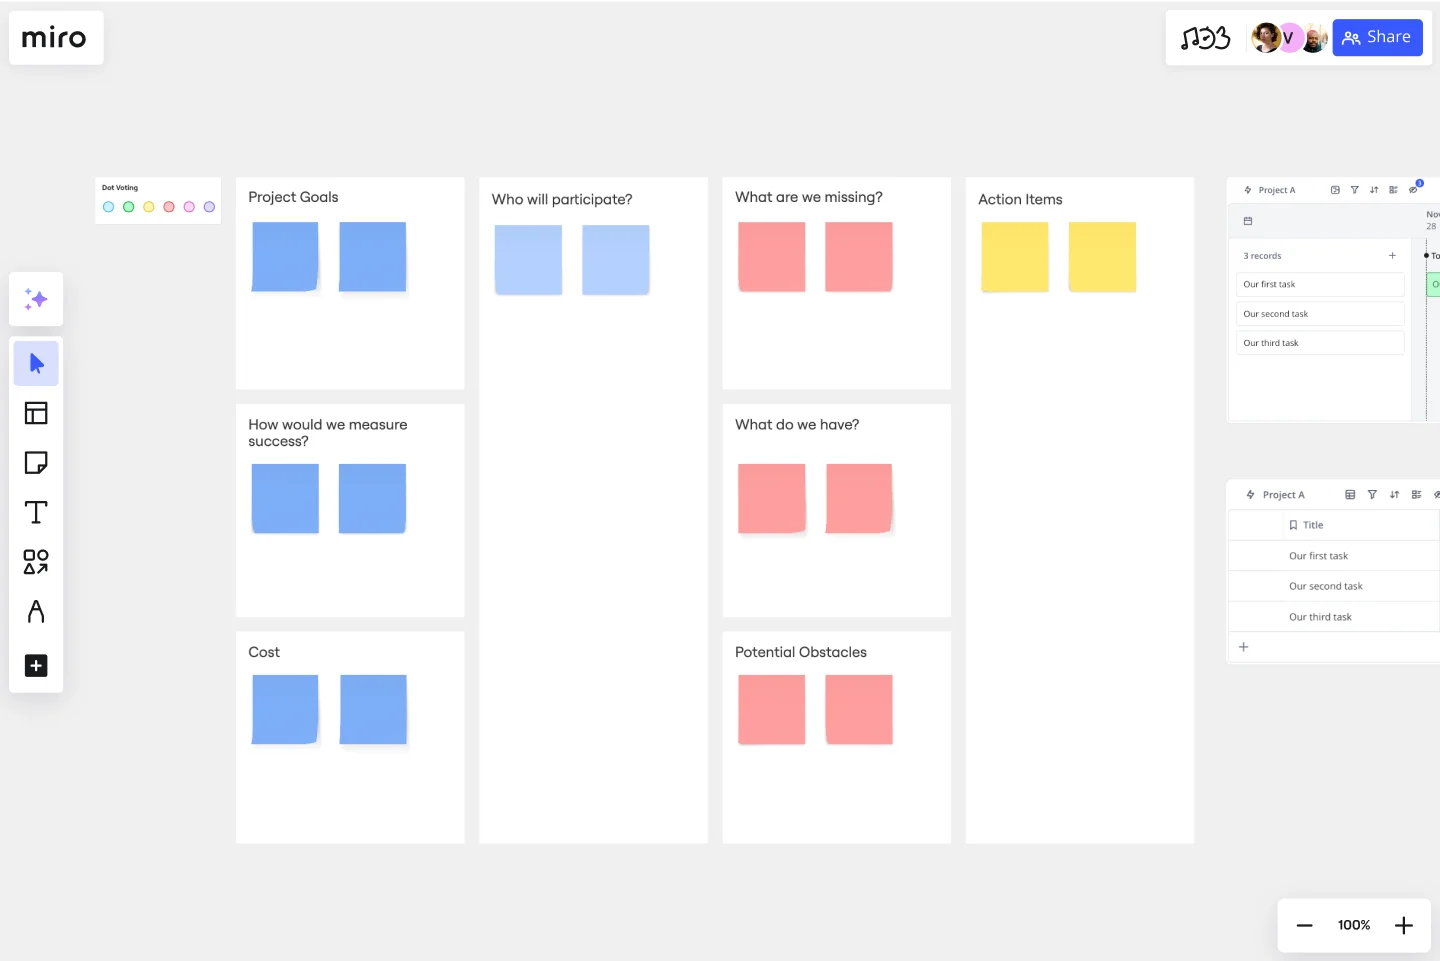
Project Planning Template
Works best for:
Project Management, Project Planning
A project plan is a single source of truth that helps teams visualize and reach project milestones. Project plans are most useful when you outline the project’s “what” and “why” to anyone who needs to give you project buy-in. Use a project plan to proactively discuss team needs; expectations; and baselines for timeline, budget, and scope. The plan will also help you clarify available resources before you kick off a project, as well as expected deliverables at the end of the project.
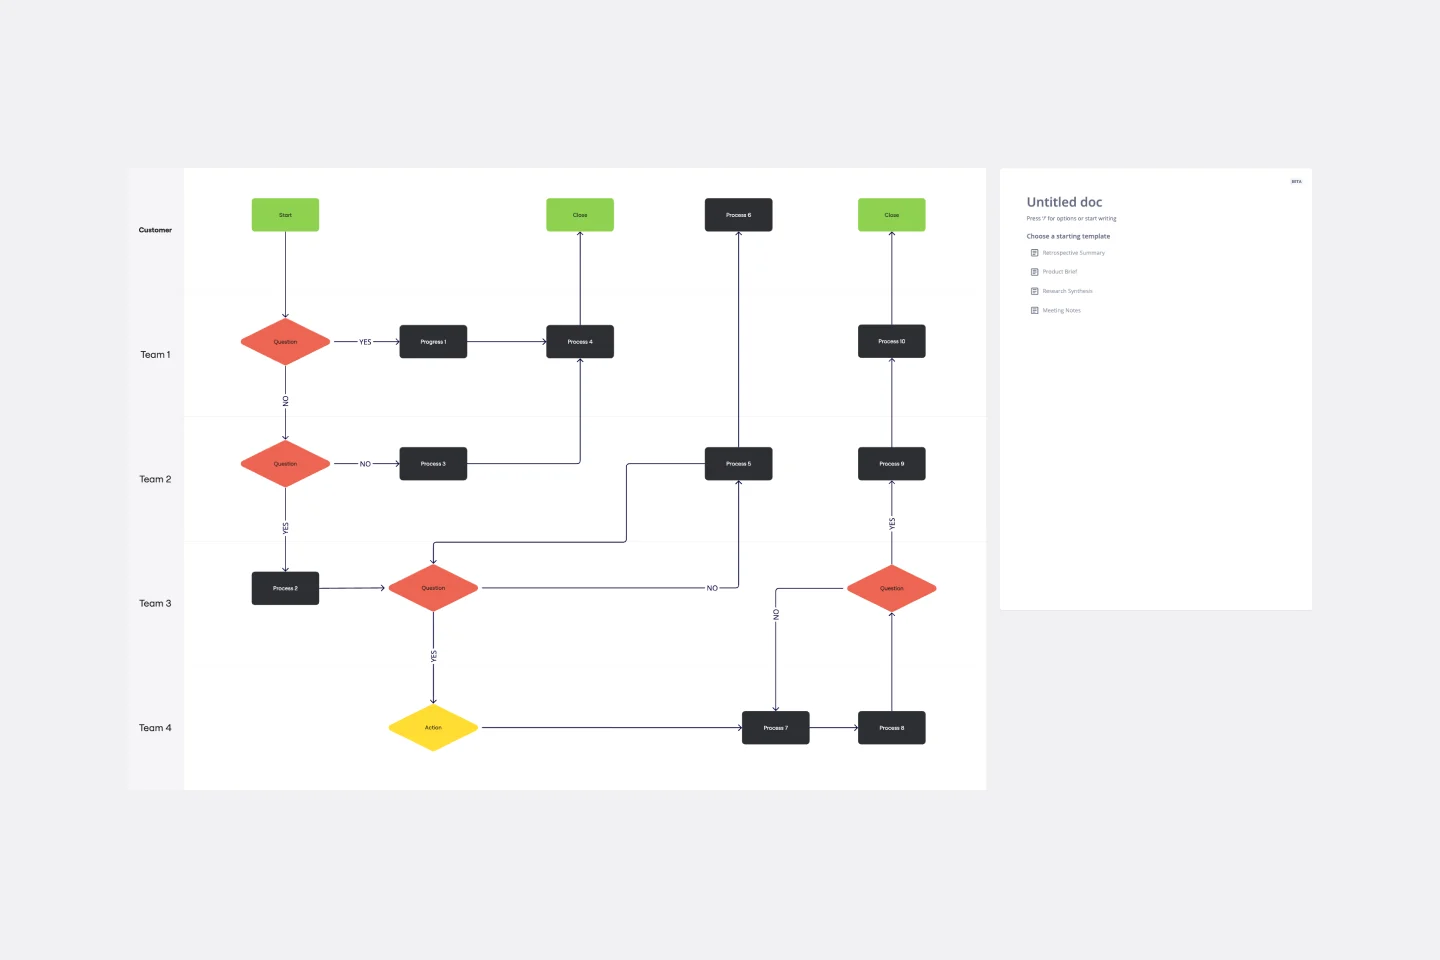
Cross Functional Flowchart
Works best for:
Org Charts, Business Management
Have a quick look at everyone on a project and see exactly what they’ll contribute. That’s the clarity and transparency a cross-functional flowchart will give you. These are also called “swim lane” flowcharts because each person (each customer, client, or representative from a specific function) is assigned a lane—a clear line—that will help you visualize their roles at each stage of the project. This template will empower you to streamline processes, reduce inefficiencies, and make meaningful cross-functional relationships.