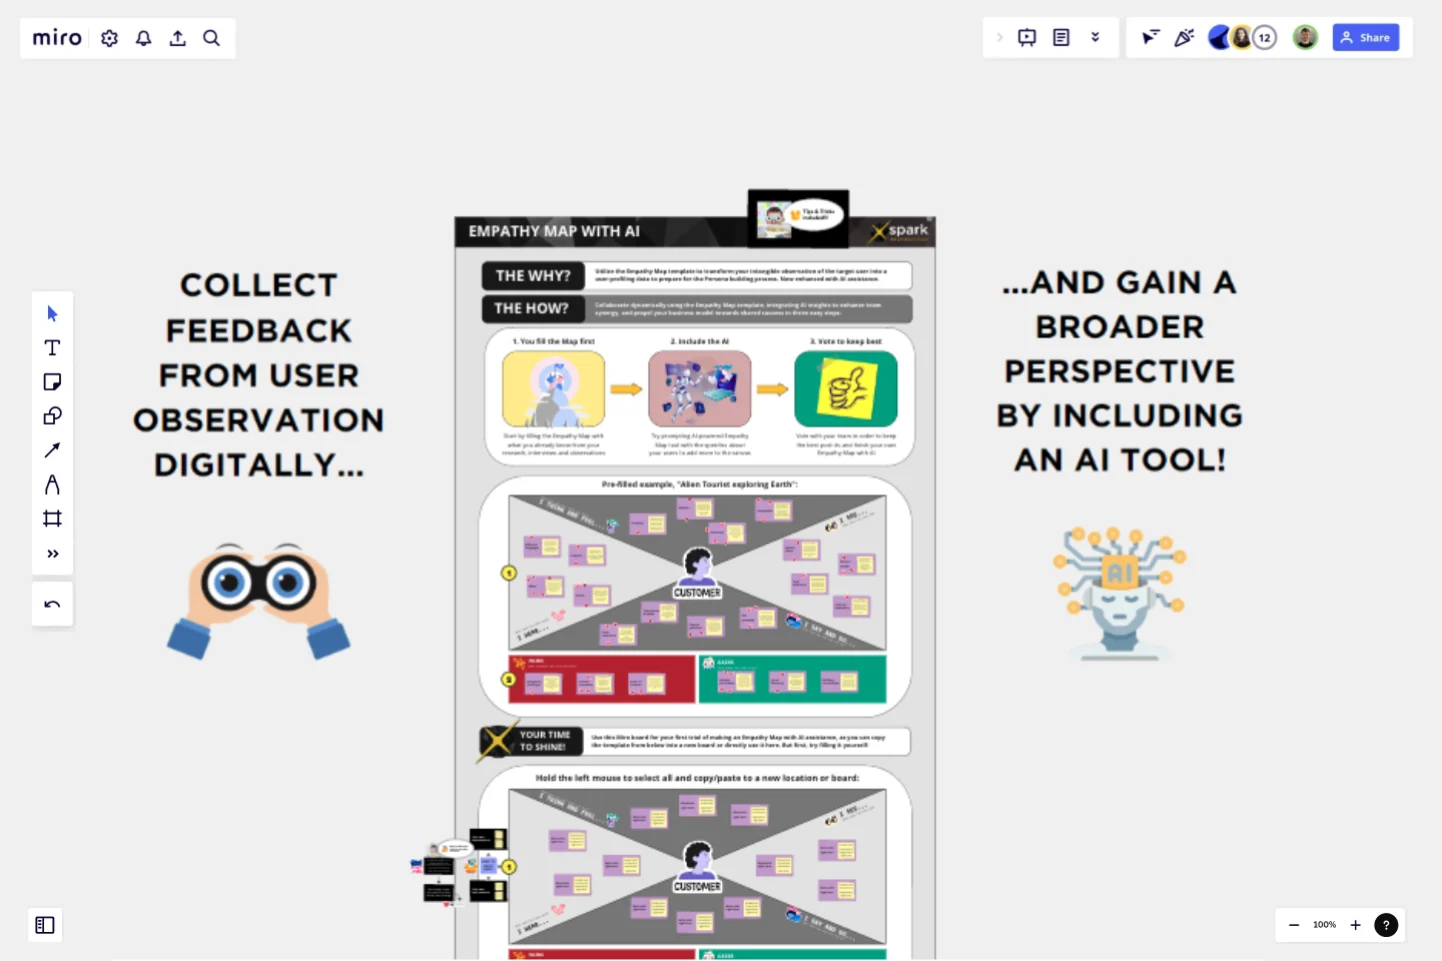
Empathy Mapping With AI Assistance
Welcome to the "Empathy Mapping with AI Assistance" template on Miro!
This innovative template redefines how you connect with your customers by combining the human-centric approach of empathy mapping with cutting-edge AI technology.
Key Features:
Empathy Mapping Framework: Utilize our structured layout to delve deep into your customer's world, capturing their experiences, motivations, and needs in a clear and organized manner,
AI-Enhanced Understanding: Elevate your empathy maps with AI-assisted analysis, offering sentiment analysis, behavioral insights, and emotional intelligence to better understand your customers.
Interactive Guidance: Perfect for teams of all sizes, our template offers a step-by-step process, integrating AI tools to provide deeper insights into each section of the empathy map.
Collaborative Experience: Designed to foster team collaboration, this board enables real-time input and discussion, ensuring every voice is heard and every customer insight is captured.
Ideal for:
Design thinkers and UX/UI designers refining user experience
Marketers seeking to understand customer perspectives
Product managers aiming to align offerings with customer needs
Educators and facilitators teaching empathetic design principles
Benefits:
Deepens customer understanding through AI-powered empathy analysis
Promotes a customer-first approach in product and service design
Encourages a collaborative environment for customer-centric ideation
Streamlines the process of mapping out complex customer profiles
Step into your customer's shoes like never before with our "Empathy Mapping with AI Assistance" template and create products and services that truly resonate with your audience.
This template was created by Velebit.
Get started with this template right now.
Storyboards by maad labs
Works best for:
Storyboard, Planning, Design
Simplify your story creation process with Storyboards by maad labs. This template offers a user-friendly interface for mapping out your narrative projects, making it ideal for both beginners and seasoned professionals. It includes sections for scene descriptions, character notes, and dialogue, helping you to organize your ideas and present them clearly. Use this template to enhance your storytelling workflow and bring your creative visions to life with ease
Visual Prototyping Template
Visual and emotional aspects play a vital role in determining a product or service's usability and user experience. To evaluate these aspects of your proposed solution, consider using the Visual Prototyping Template. By creating a model that closely resembles the real product or service, and gathering feedback from key stakeholders, you can assess whether the form of your creation is advantageous or detrimental.
Service Blueprint by Hyperact
Works best for:
Research & Design
The Service Blueprint template is perfect for visualizing the orchestration of service components. It maps out frontstage and backstage elements, helping you analyze and enhance customer experiences. Use this template to align teams, identify pain points, and streamline processes, ensuring a seamless service delivery. It's ideal for creating a shared understanding of service dynamics among stakeholders and collaborators.
Look Mock Analyze Template
Works best for:
Design, Desk Research, Product Management
Doing your homework (aka, the research) is a key step in your design process, and the Look, Mock, Analyze approach helps you examine, structure, and streamline that step. With this powerful tool you’ll be able to identify your strengths and weaknesses, what you did right or wrong, and whether you spent time efficiently. Our Look, Mock, Analyze template makes it so easy for you to discover inspiration, mock up designs, and get feedback — you can start by setting up your board in less than a minute.
User Empathy Map
Works best for:
Market Research, Research & Design
User Empathy Map template helps you visualize user experiences and needs. It’s an essential tool for teams looking to design products that resonate with their users. Use this template to build empathy and improve user satisfaction.
UXD Empathy Map Template
Works best for:
Research & Design, Market Research
UXD Empathy Map helps you gain a deep understanding of your users. By mapping their experiences, thoughts, and emotions, you can design products that truly resonate. This template is perfect for UX designers aiming to create user-centered designs.
