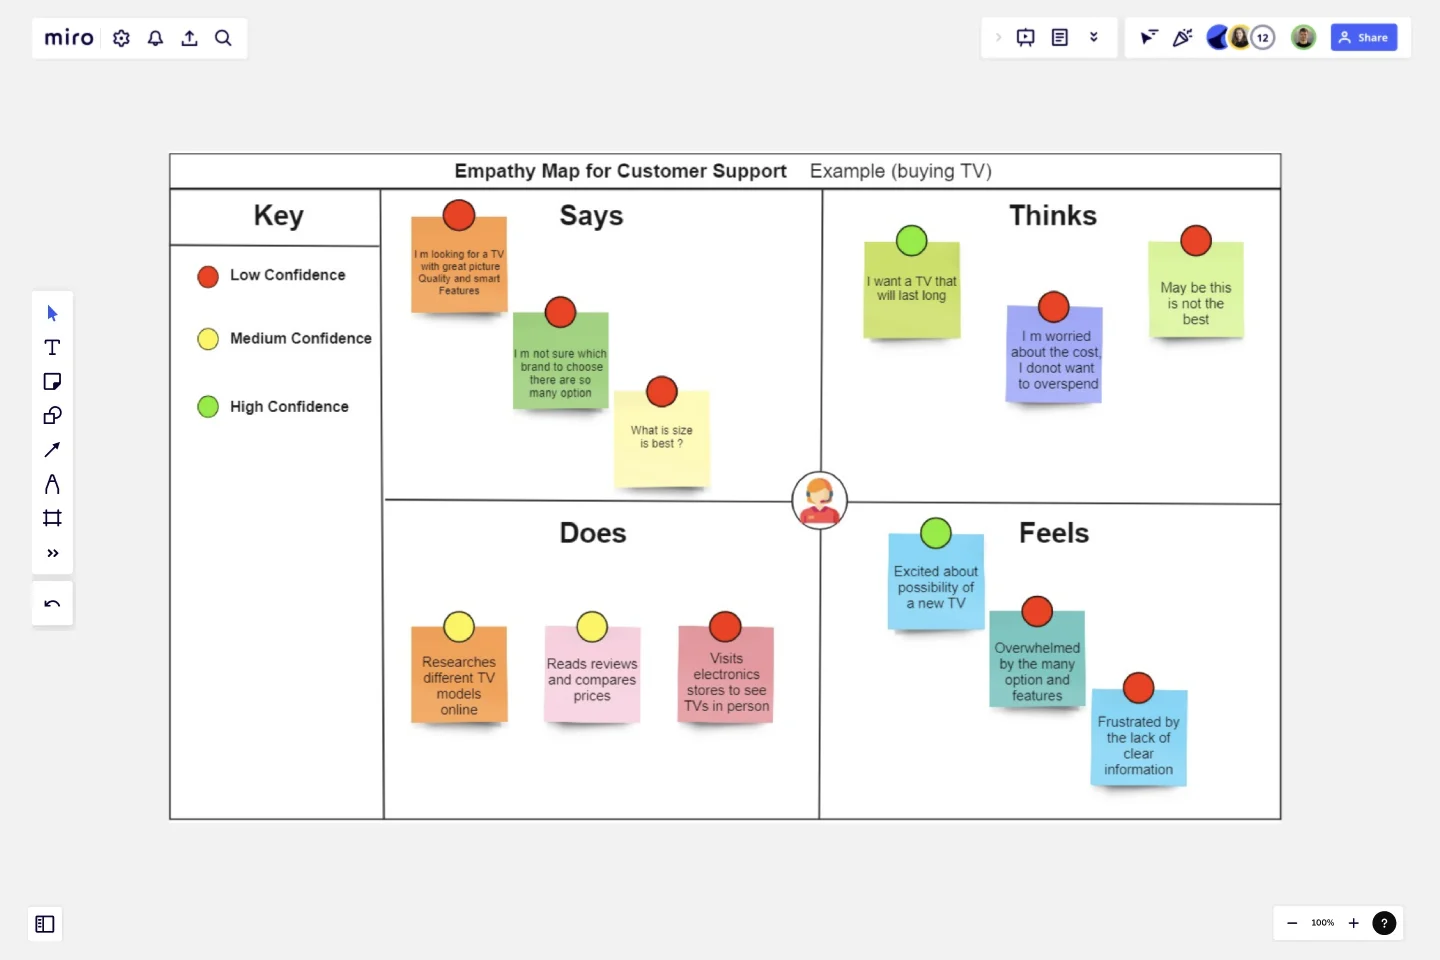
Empathy Map for Customer Support
This empathy map helps you understand David's thoughts, feelings, and behaviors as he buys a TV.
You can use this information to design a better experience for him, such as:
- Providing clear and detailed product information
- Offering personalized recommendations based on his needs
- Ensuring a smooth and hassle-free purchasing process
By using this empathy map, you can create a more user-centered experience that addresses David's needs and concerns, and builds a strong relationship with him as a customer.
This template was created by Shafqat.
Get started with this template right now.
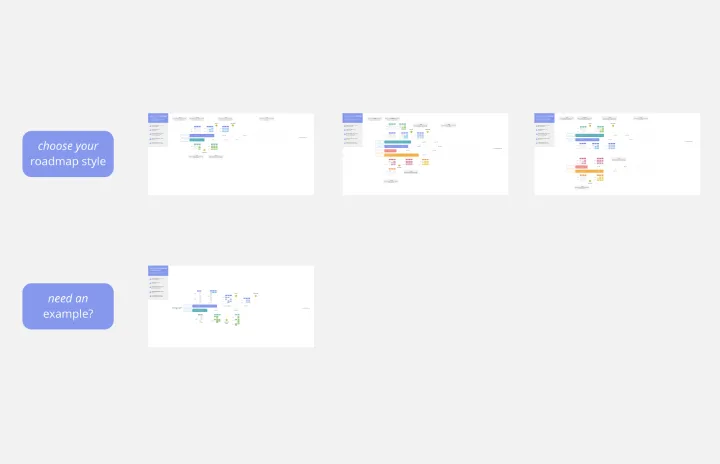
Agile Product Roadmap
Works best for:
Roadmap, Planning, Mapping
The Agile Product Roadmap template enables teams to visualize and communicate the strategic direction of their product development in an agile environment. It allows for flexibility and adaptation to changing requirements while providing a clear overview of priorities and timelines. By incorporating feedback loops and iterative planning, teams can ensure alignment with stakeholder expectations and deliver value incrementally.
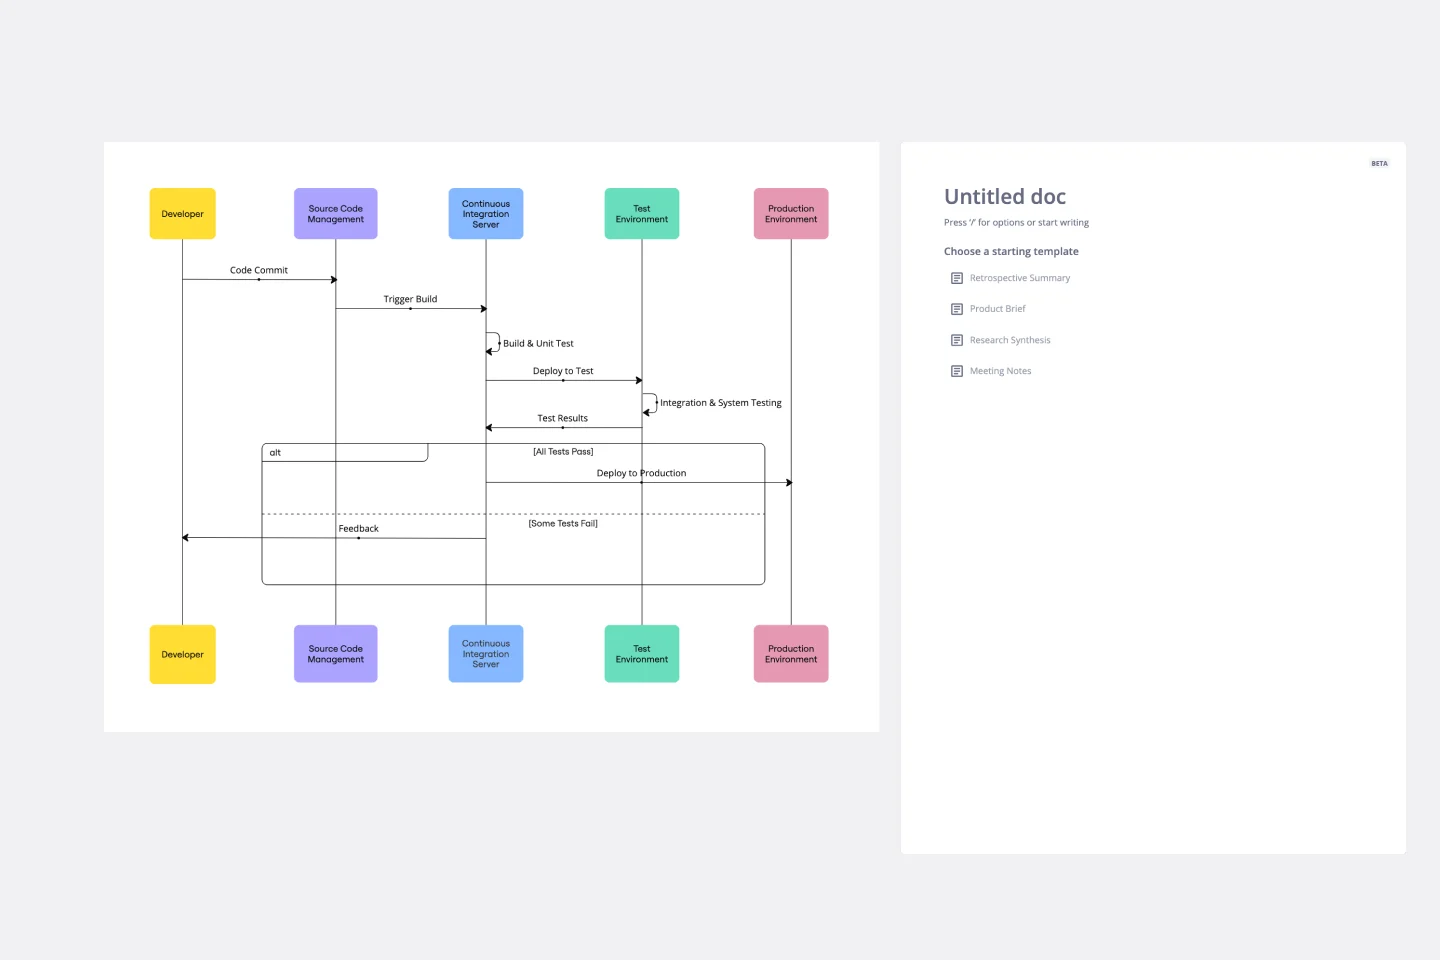
UML Sequence Deployment Pipeline Template
Works best for:
UML
The UML Sequence Deployment Pipeline Template in Miro visually maps the sequence of steps in an automated deployment pipeline, helping teams in software development and deployment. It helps identify bottlenecks, standardizes the deployment process, and facilitates new member onboarding for continuous improvement.
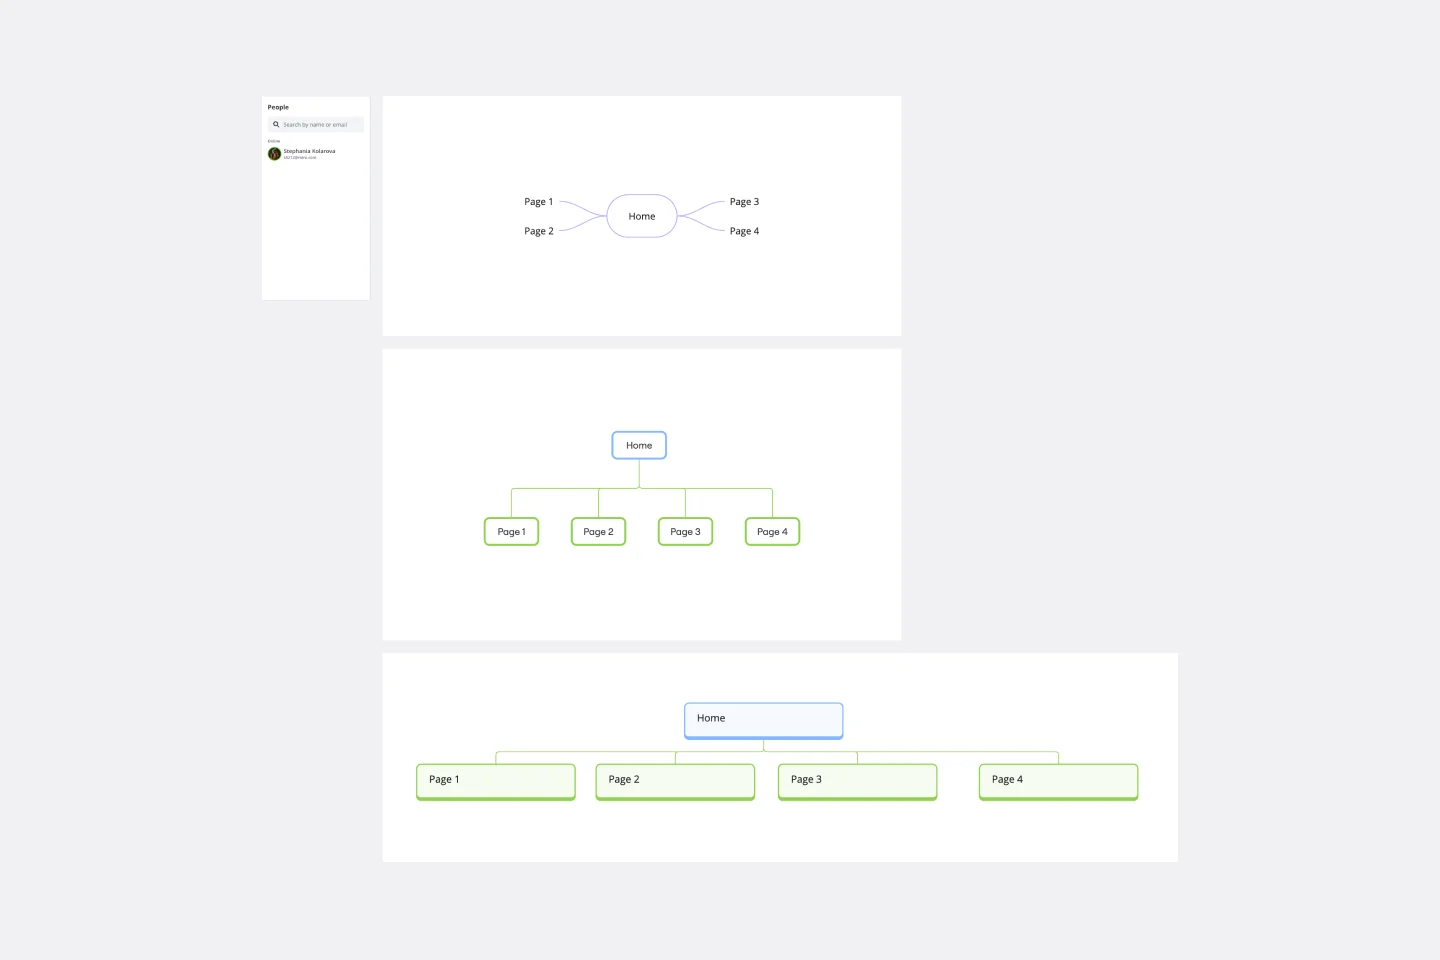
Sitemap Template
Works best for:
Mapping, Software Development, Diagrams
Building a website is a complex task. Numerous stakeholders come together to create pages, write content, design elements, and build a website architecture that serves a target audience. A sitemap is an effective tool for simplifying the website design process. It allows you to take stock of the content and design elements you plan to include on your site. By visualizing your site, you can structure and build each component in a way that makes sense for your audience.
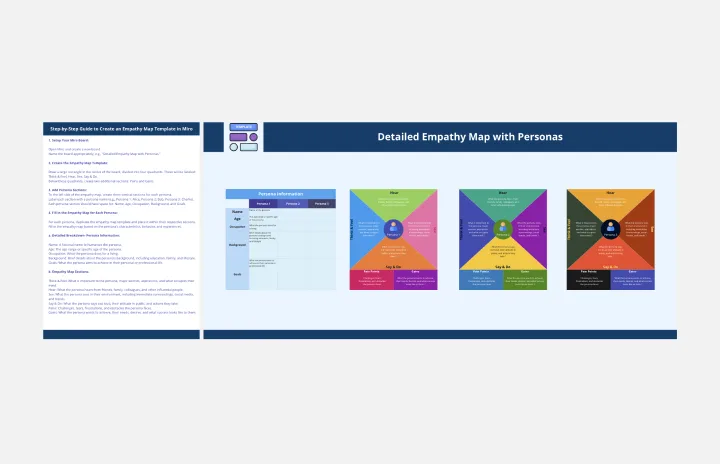
Detailed Empathy Map With Personas
Works best for:
Empathy Map
Understand your audience better with the Empathy Map Personas template. This tool helps you capture insights into your customers' needs, thoughts, feelings, and behaviors. By visualizing these personas, you can tailor your product development, marketing strategies, and customer interactions to better meet their needs and enhance user satisfaction. Ideal for teams focused on customer-centric solutions.
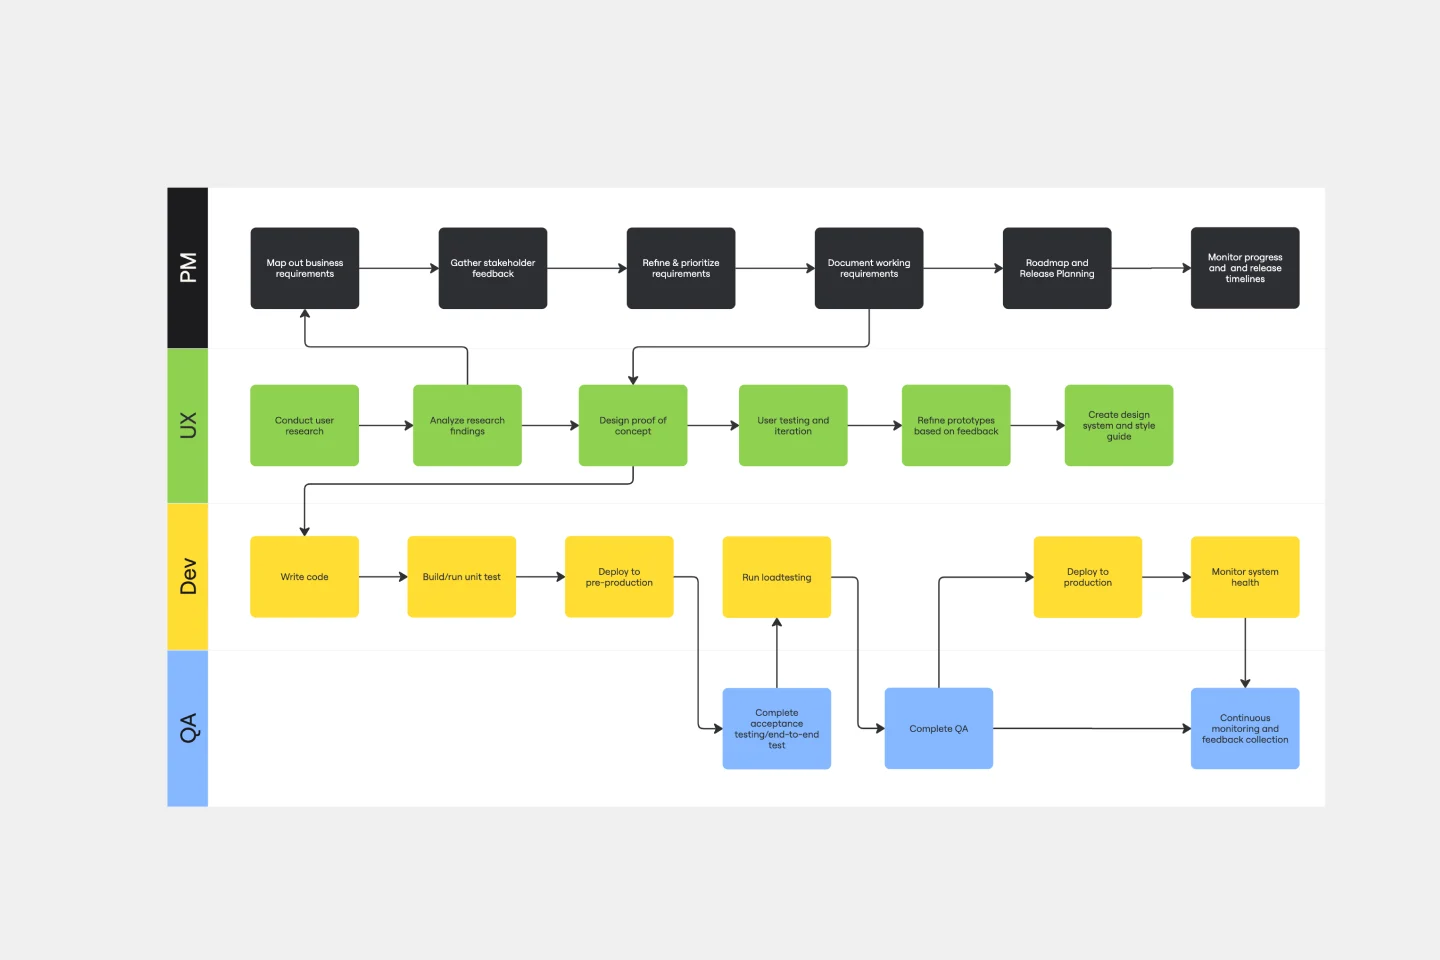
SDLC Template
Works best for:
Diagramming
The Software Development Life Cycle (SDLC) template is a well-designed visual tool that helps software development teams follow a structured approach from the initial concept to the final deployment of the software. One of the most significant benefits of using this template is that it promotes clear, streamlined communication among team members. By breaking the development cycle into distinct phases, all stakeholders can stay informed about the progress of the project and understand their responsibilities within the larger context. This enhanced communication reduces the chances of misunderstandings and ensures that everyone works together towards the common goal of delivering high-quality software. The template acts not only as a roadmap but also as a shared language for the team, improving collaboration and the efficient progression of the project through each critical stage.
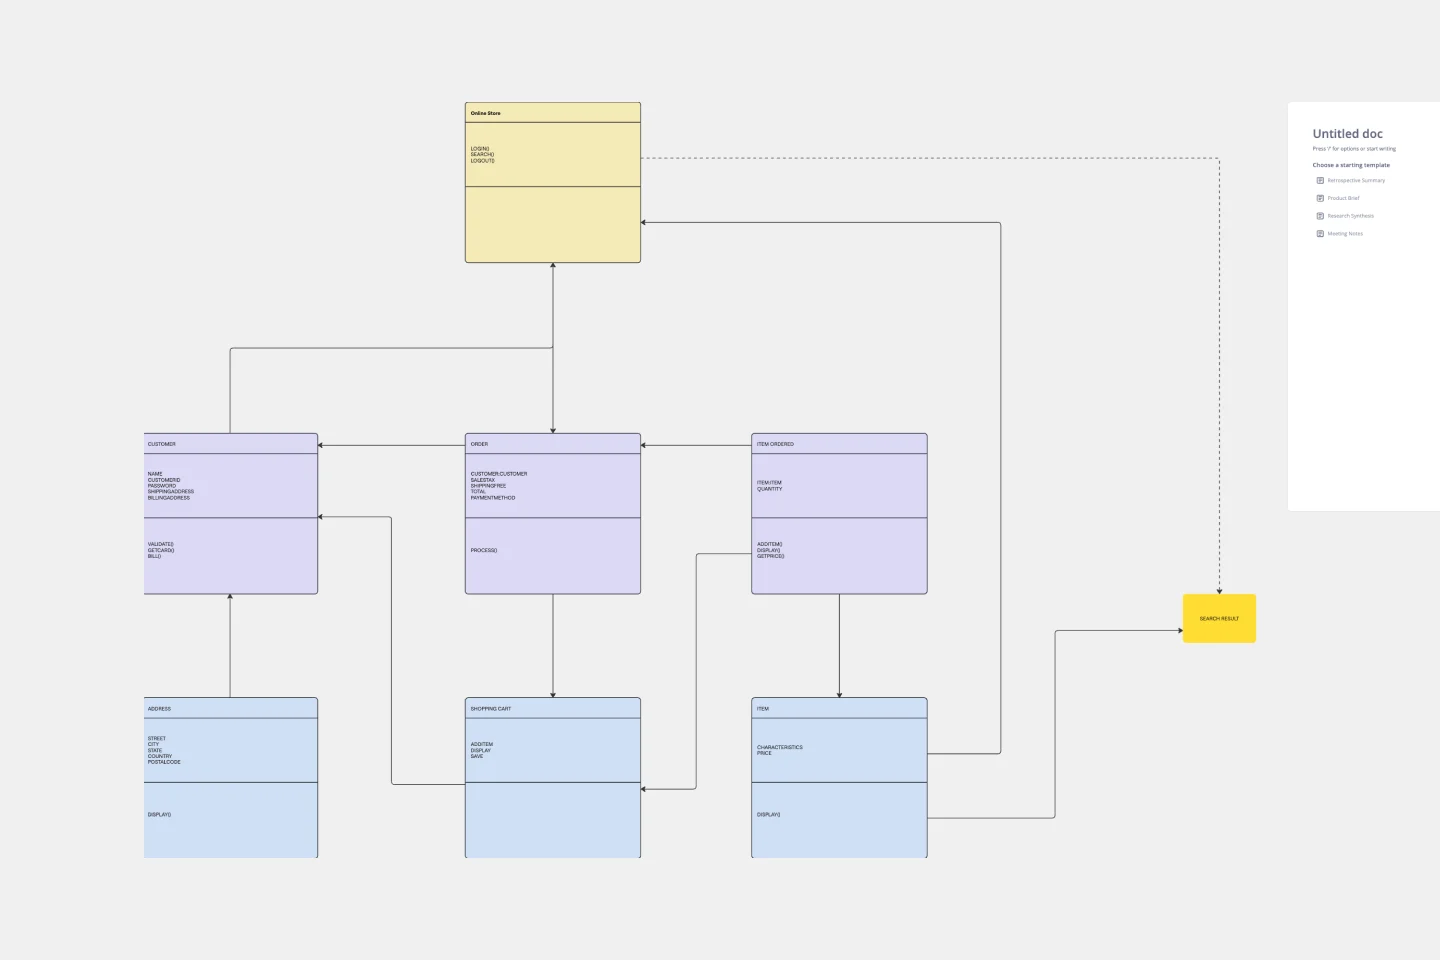
UML Diagram Template
Works best for:
Diagrams, Software Development
Originally used as a modeling language in software engineering, UML has become a popular approach to application structures and documenting software. UML stands for Unified Modeling Language, and you can use it to model business processes and workflows. Like flowcharts, UML diagrams can provide your organization with a standardized method of mapping out step-by-step processes. They allow your team to easily view the relationships between systems and tasks. UML diagrams are an effective tool that can help you bring new employees up to speed, create documentation, organize your workplace and team, and streamline your projects.