Double Bubble Map Template
Unlock the potential of visual thinking and enhance your team's collaboration with Miro's double bubble map template. Explore the endless possibilities for brainstorming, problem-solving, and ideation.
About the Double Bubble Map Template
Brainstorm, analyze, and compare ideas or concepts in a structured and engaging way with Miro's double bubble map template. Whether planning a project, facilitating a discussion, or organizing your thoughts, this template enables creativity and clarity within your team.
What's a double bubble map template?
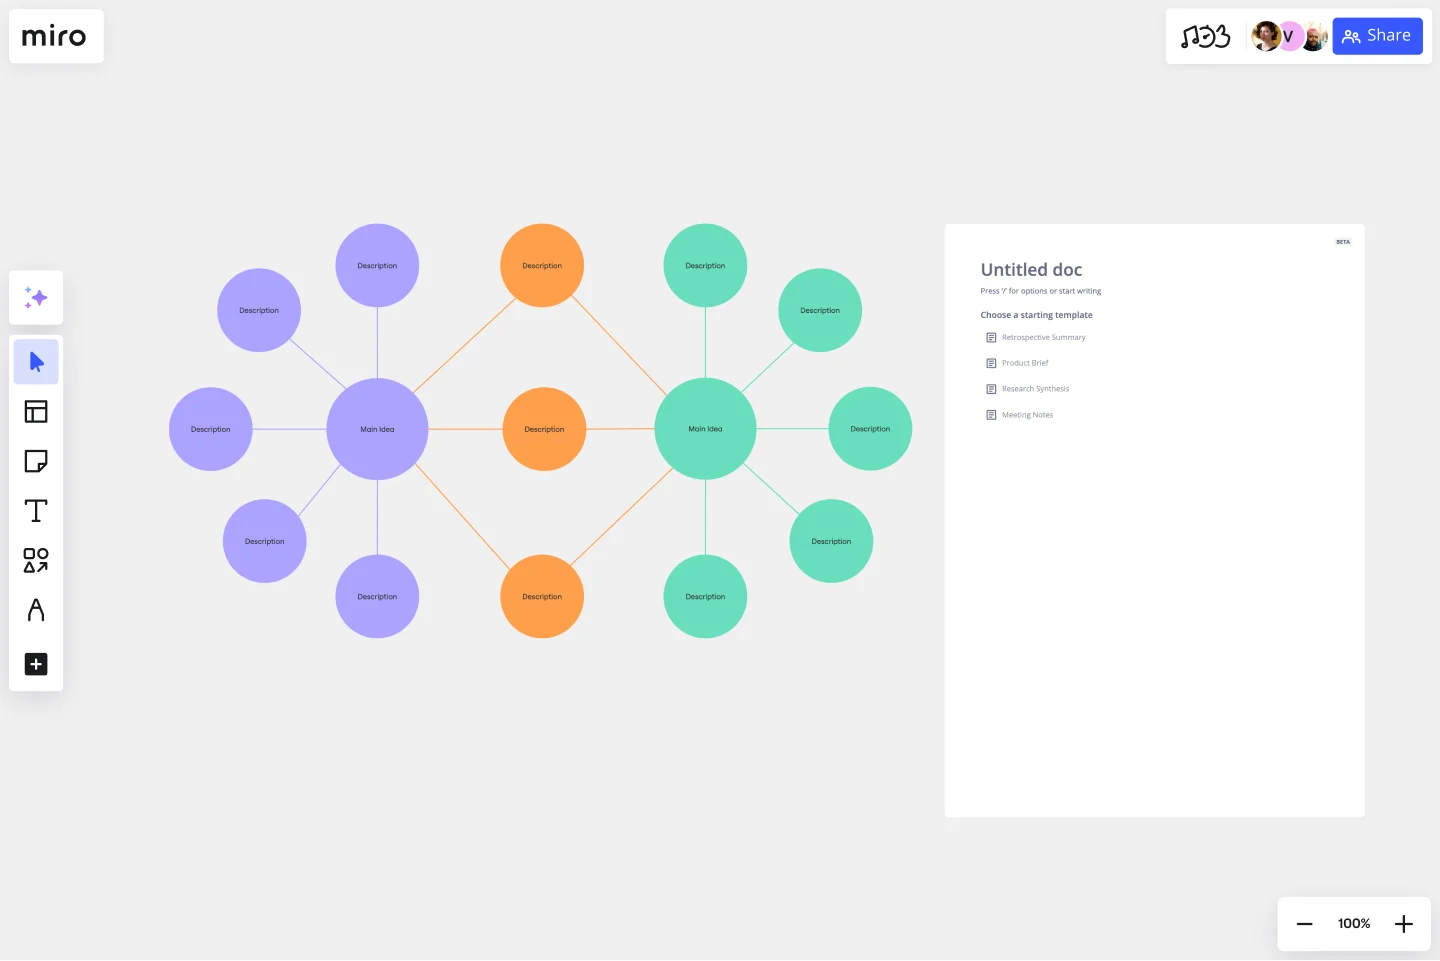
A double bubble map template is a visual diagramming tool that allows teams to explore relationships and connections between central ideas or concepts. It consists of two interconnected bubbles, each representing one of the main ideas. Lines and connecting elements extend from these bubbles to show the ideas' relationships, similarities, and differences. This template is a dynamic framework for brainstorming, organizing information, and gaining insights into complex topics by visualizing how ideas interrelate.
Benefits of using the double bubble map template
Enhanced clarity: The double bubble map helps teams clarify their thoughts and ideas by visually representing the connections between two central concepts. This clarity minimizes misunderstandings and ensures everyone is on the same page.
Efficient brainstorming: It fosters efficient brainstorming sessions, encouraging teams to explore the intersections of ideas and identify potential areas of synergy or conflict.
Improved decision-making: Teams can make more informed decisions by using the template to weigh the pros and cons of different options, making it a valuable tool for problem-solving.
Effective communication: Visualizing complex relationships makes communicating ideas within the team and with stakeholders easier, promoting effective collaboration.
Customization: Miro's double bubble map template is highly customizable, allowing teams to adapt it to their specific needs and preferences.
How to use the double bubble map template in Miro
Creating a double bubble map diagram in Miro is a breeze:
Add the template: Search the Miro Template Library for the "Double Bubble Map Template." Click to add it to your board.
Customize your map: Double-click on the bubbles to add your central ideas. Use Miro's drawing tools and connectors to visualize the relationships and details.
Collaborate with others: Share the board link with your team members and collaborate in real time, whether in the same room or working remotely. Discuss, share, and refine your ideas quickly with Miro's bubble map maker.
Can I add more than two central ideas to the double bubble map template?
The double bubble map template in Miro is primarily designed for comparing two main ideas. However, you can create multiple templates within a board to effectively compare more than two concepts.
Can I export or print my double bubble map for offline use?
Yes, you can export your double bubble map as an image or PDF from Miro, making it easy to share or print for offline reference.
Are there collaboration restrictions on the double bubble map template in Miro?
No, Miro allows real-time collaboration for all users on a board, so your team can work together seamlessly on your double bubble map.
Get started with this template right now.
UML Use Case Online Shopping System Template
Works best for:
UML
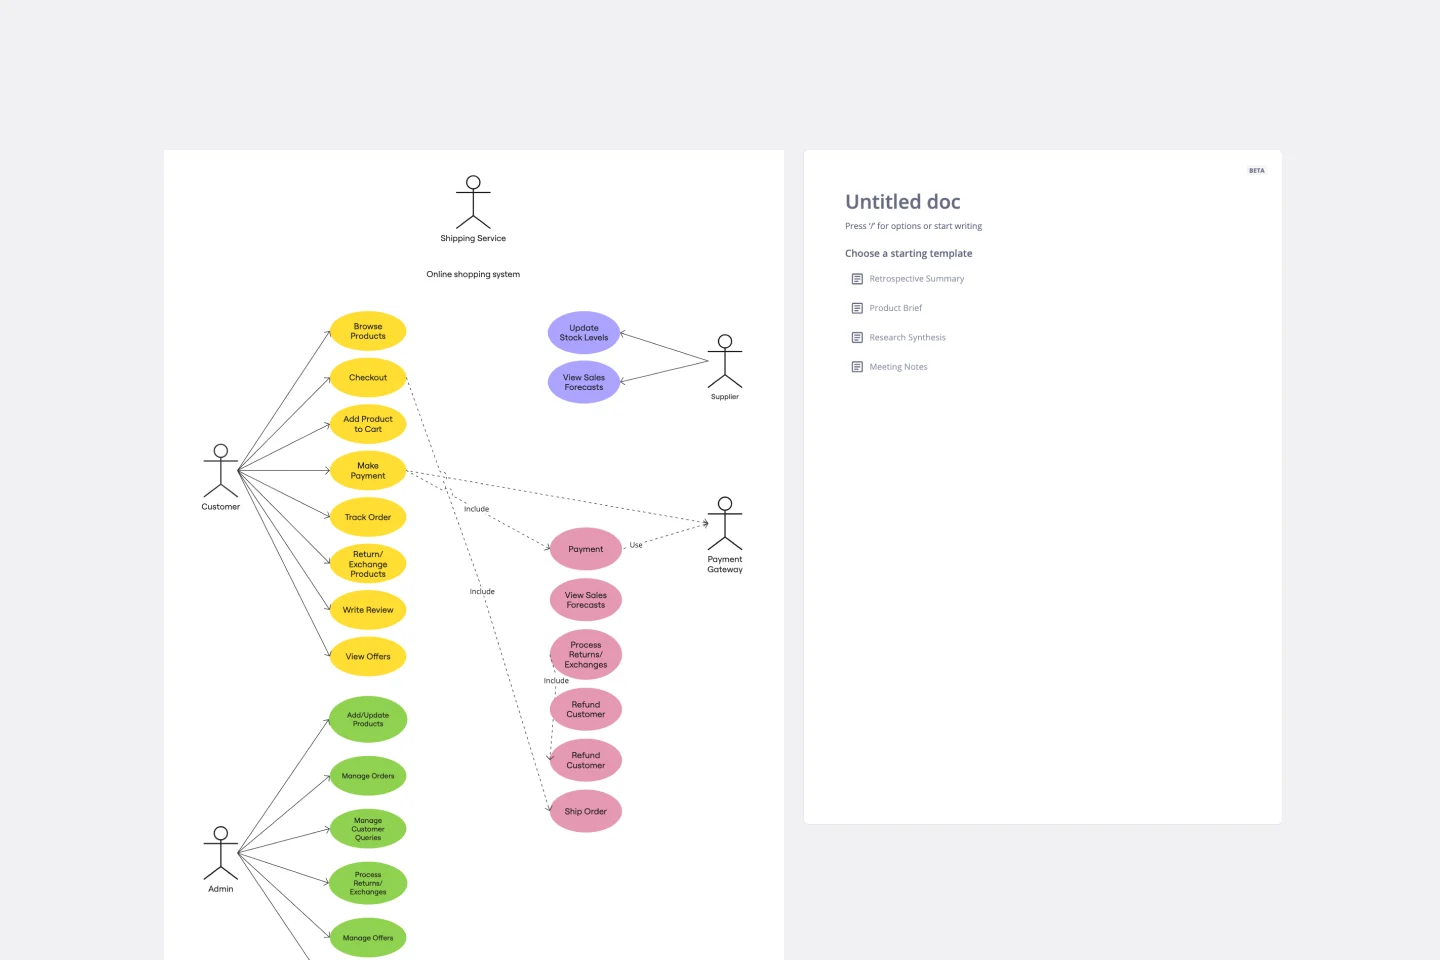
The Online Shopping System Template simplifies the process of documenting and visualizing how users interact with an online shopping system. It provides a standard way to map out user interactions, such as product listings, inventory management, shopping carts, order processing, payments, and shipping details. By using this template, teams can collaborate effectively in real-time or at different times, adjusting the diagram to meet their project's specific needs. This not only improves clarity and efficiency but also fosters better communication among team members and stakeholders, ensuring a thorough understanding of the system's design and requirements.
UML Use Case Diagram
Works best for:
UML Diagrams, Diagramming
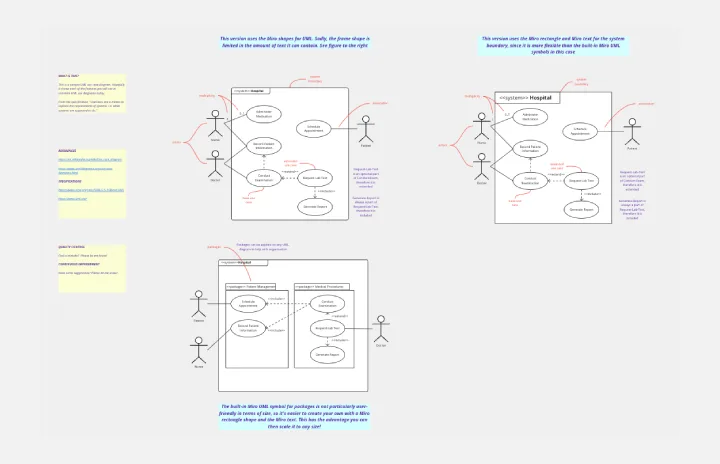
Visualize system interactions with the UML Use Case Diagram. This template helps you map out user interactions and system processes, providing a clear overview of functional requirements. Ideal for software developers, business analysts, and project managers, it supports planning and communicating system functionalities. Use it to ensure all user scenarios are considered and to facilitate better design and implementation of software systems.
Affinity Diagram by UserPeek
Works best for:
Diagramming
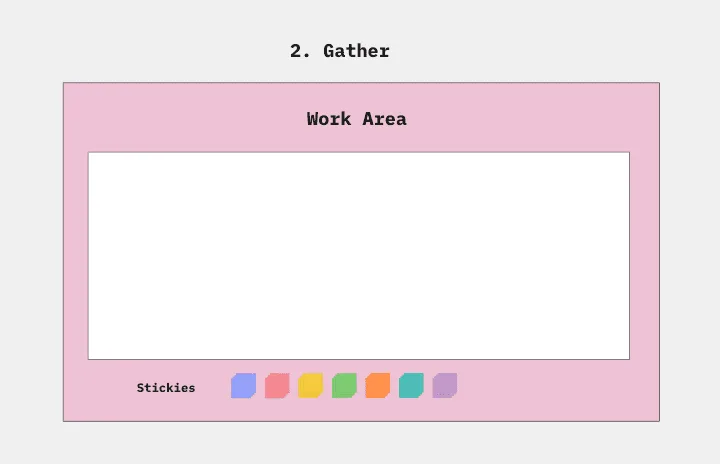
The Affinity Diagram template is a visual tool for organizing and categorizing ideas, data, or issues into related groups. It provides a structured framework for conducting group brainstorming and affinity grouping activities. This template enables teams to synthesize information, identify patterns, and generate insights collaboratively. By promoting creativity and collaboration, the Affinity Diagram empowers teams to organize and prioritize information effectively, driving decision-making and problem-solving processes efficiently.
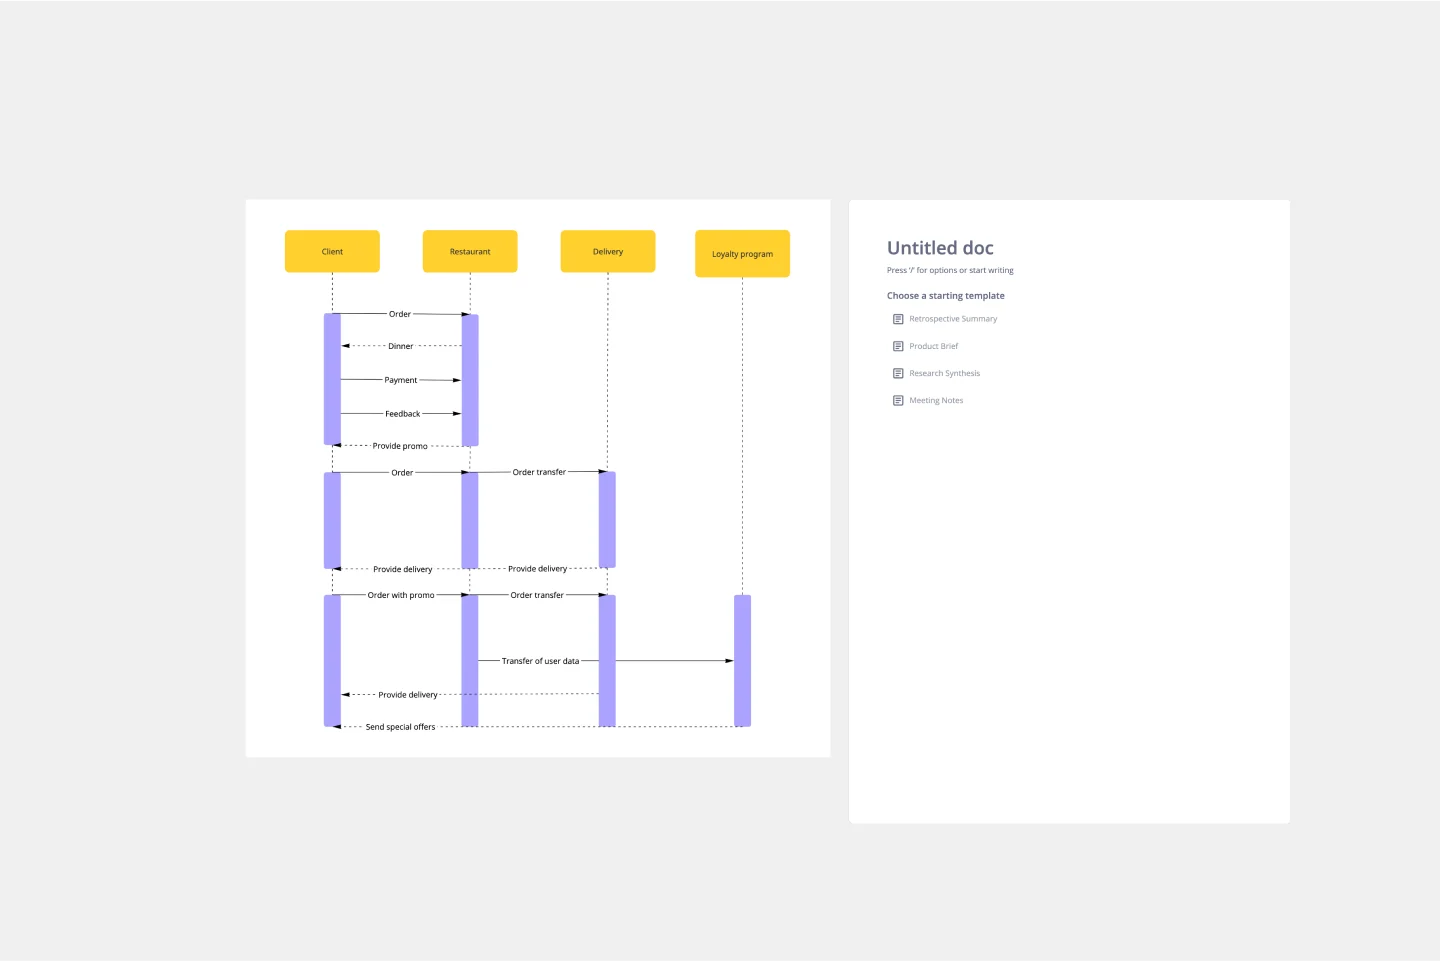
UML Sequence Diagram Template
Works best for:
Software Development, Mapping, Diagrams
Analyze and showcase how external entities interact with your system using a sequence diagram. Get a bird’s-eye view of your work processes, business functions, and customer interactions using this diagram. Also, identify any potential problems early and solve them before implementation.
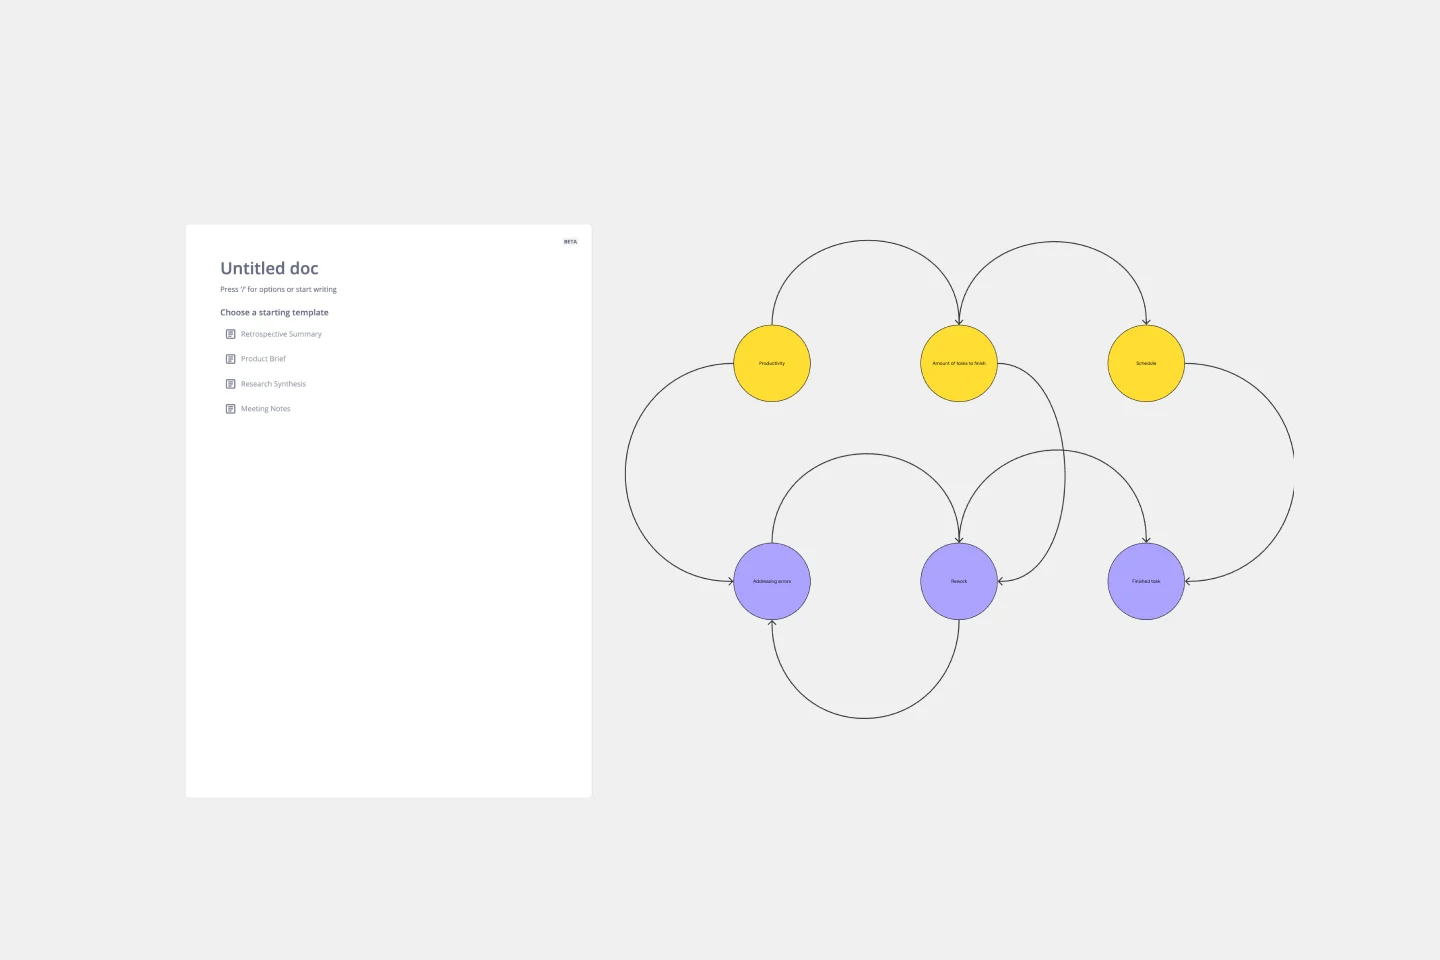
Causal Loop Diagram Template
Works best for:
Diagramming
The Causal Loop Diagram Template offers a structured framework to visualize the intricate interconnections within any system. Its standout benefit is the ability to provide a holistic perspective, ensuring that users don't just see isolated issues but understand the entire web of relationships, ultimately leading to more informed and strategic decision-making.

Opportunity Solution Tree Template
Works best for:
Flowcharts, Product Management, Diagrams
Solving problems — successful companies and productive teams just know how to do it. They’re able to identify many possible solutions, then settle on the one that leads to the desired outcome. That’s the power an Opportunity Solution Tree gives you. Designed by Teresa Torres, a product discovery coach, this mind map breaks down your desired outcome into opportunities for the product to meet user needs, then gives your team an effective way to brainstorm potential solutions.