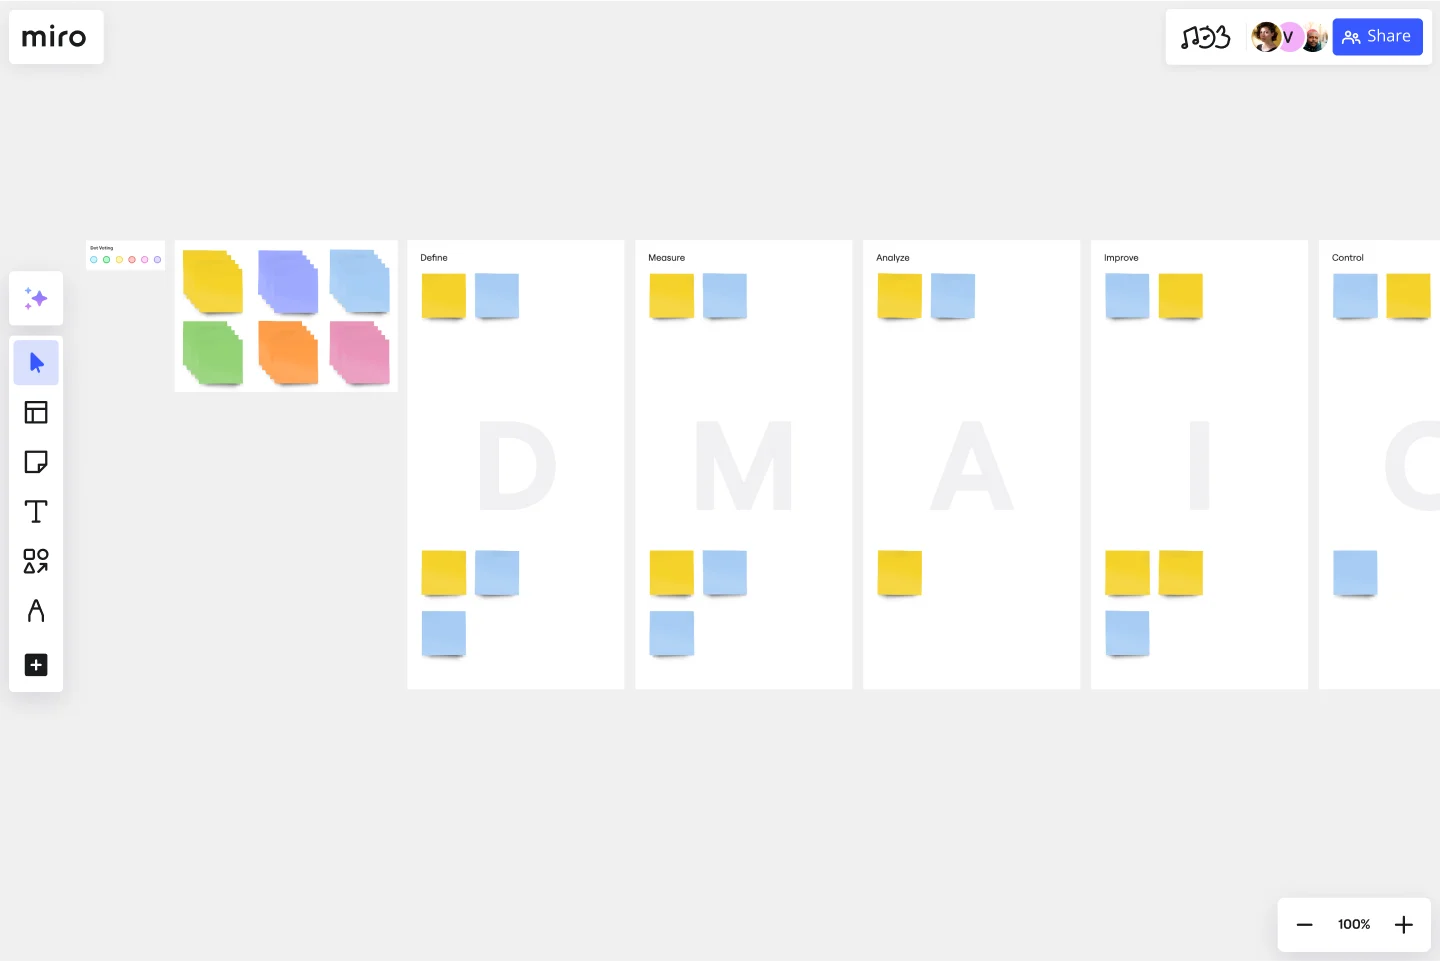
DMAIC Analysis Template
Use the DMAIC process (or Six Sigma Map) to solve problems using a structured approach. The letters in the acronym represent the five phases that make up the process.
About the DMAIC template
From software development to manufacturing, the DMAIC Template helps project teams improve their processes. While it’s part of the Six Sigma initiative (a method for improving the manufacturing process), it’s now widely adopted as a quality improvement procedure.
Using this five-step framework, you can identify and address inefficiencies in processes across your entire business. As a result, you’ll improve the quality of your deliverables and help your business get better results.
What is a DMAIC analysis?
DMAIC is an acronym for Define, Measure, Analyze, Improve, and Control. Performing a DMAIC analysis allows businesses to do the following:
Improve existing processes
Identify new processes
Perform structured change management
A DMAIC analysis is a data-driven quality strategy. It strongly emphasizes measurement and analysis, helping companies identify process improvement initiatives based on real data. This makes sure that any changes have the most positive impact on the business.
The 5 factors of DMAIC
To better understand the DMAIC process, let’s outline the five main steps in more detail. To perform a successful DMAIC analysis, you must follow the process steps in this order.
1. Define: Start by defining your team’s project, problems, and goals. Be as specific as possible. The more specific you are, the easier it’ll be to solve each concrete problem and complete the project. You can use the SMART goals template to make sure your project goals are specific, and take a look at this Problem Framing Template to identify your challenges. You should also outline your project scope in a project charter to clearly display all the key project information.
2. Measure: During the Measure phase, you need to figure out how to measure the solution. What key metrics can you track? How will you know whether you have succeeded? You need these in place to track progress and measure success.
3. Analyze: With your measurements in place, it’s time to analyze the data. This will help you identify the root cause of your problem. Start by listing and prioritizing potential causes of the problem. Then, prioritize root causes (or key process inputs) and identify how they affect outputs. You can use process maps to analyze your existing processes better.
4. Improve: By the time you reach this step, you’ll probably already have a possible solution to your process. Now, it’s time to visualize how it’ll pan out. Review the solutions and anticipate how each of them will perform. If you find potential consequences, you might have to go back to the Measure or Analyze steps. If things look good, take the necessary steps to improve your process.
5. Control: After the Improve stage, you need to Control the process. Monitor the improvements and adjust as needed to ensure continued and sustainable success.
Although DMAIC may be sequential, it’s not always linear. For example, if you get to the Improve stage and realize that your solutions aren’t viable, you’ll have to backtrack to a previous stage.
This is where using a template can be helpful. You can easily track the process and visualize everything in one location. If you need to go back or make changes to the process, it’s easy to do.
Why use a DMAIC Template?
A DMAIC analysis is complex. There are a lot of moving parts to analyze and different solutions to contend with.
A DMAIC Template makes the process easier to manage. Here’s how:
Easily identify opportunities. The clear structure and format of a DMAIC Template make it easier to spot areas of improvement and opportunities for the future.
Standardize the process. Create consistency across the business by using the same template. This makes it easier for everyone in the business to perform a DMAIC analysis and fully understand the process.
Display information professionally. If you need to share your findings with key stakeholders or clients, using a professional and visually-appealing template gives them a good impression. It also helps them understand the analysis and visualize your plan of action.
Increase efficiency. Instead of creating a document from scratch, a ready-made template allows you to get straight into identifying areas for improvement. You’ll spend less time figuring out how to design the analysis and more time doing it.
Create a DMAIC analysis with Miro
Miro’s digital workspace is the perfect location for collaborative teams to plan and share new ideas. Using our DMAIC template, you can easily share your analysis and identify the best process improvements with your team.
Here’s how it works:
Step 1: Select this template. Get started by selecting this DMAIC template. It’s free to use, and you can easily customize it to your team’s specific needs. Drag and drop items, add new text, or upload your own files and visuals.
Step 2: Add the relevant information. Populate the template with all the information you have from your DMAIC analysis. You can add charts, images, and any other relevant information.
Step 3: Share the template with your team. Get your team involved in the process and share the template. They can access the template from anywhere and add visual notes with questions or feedback.
Step 4: Collaborate and make changes. If your team has any feedback, dedicate some time to discussing their thoughts. When you’re all on the same page, make any necessary changes to the analysis.
Step 5: Create a plan of action. With your DMAIC analysis in place, it’s time to use action plan templates and create an action plan for the future. This will outline how you plan to make improvements to your processes.
Connect teams, optimize business processes, and scale your organization with Miro's process mapping tool.
Who should use DMAIC?
A Project Manager usually uses DMAIC to improve project processes. Ultimately, anyone that wants to improve their business processes can use it.
Get started with this template right now.
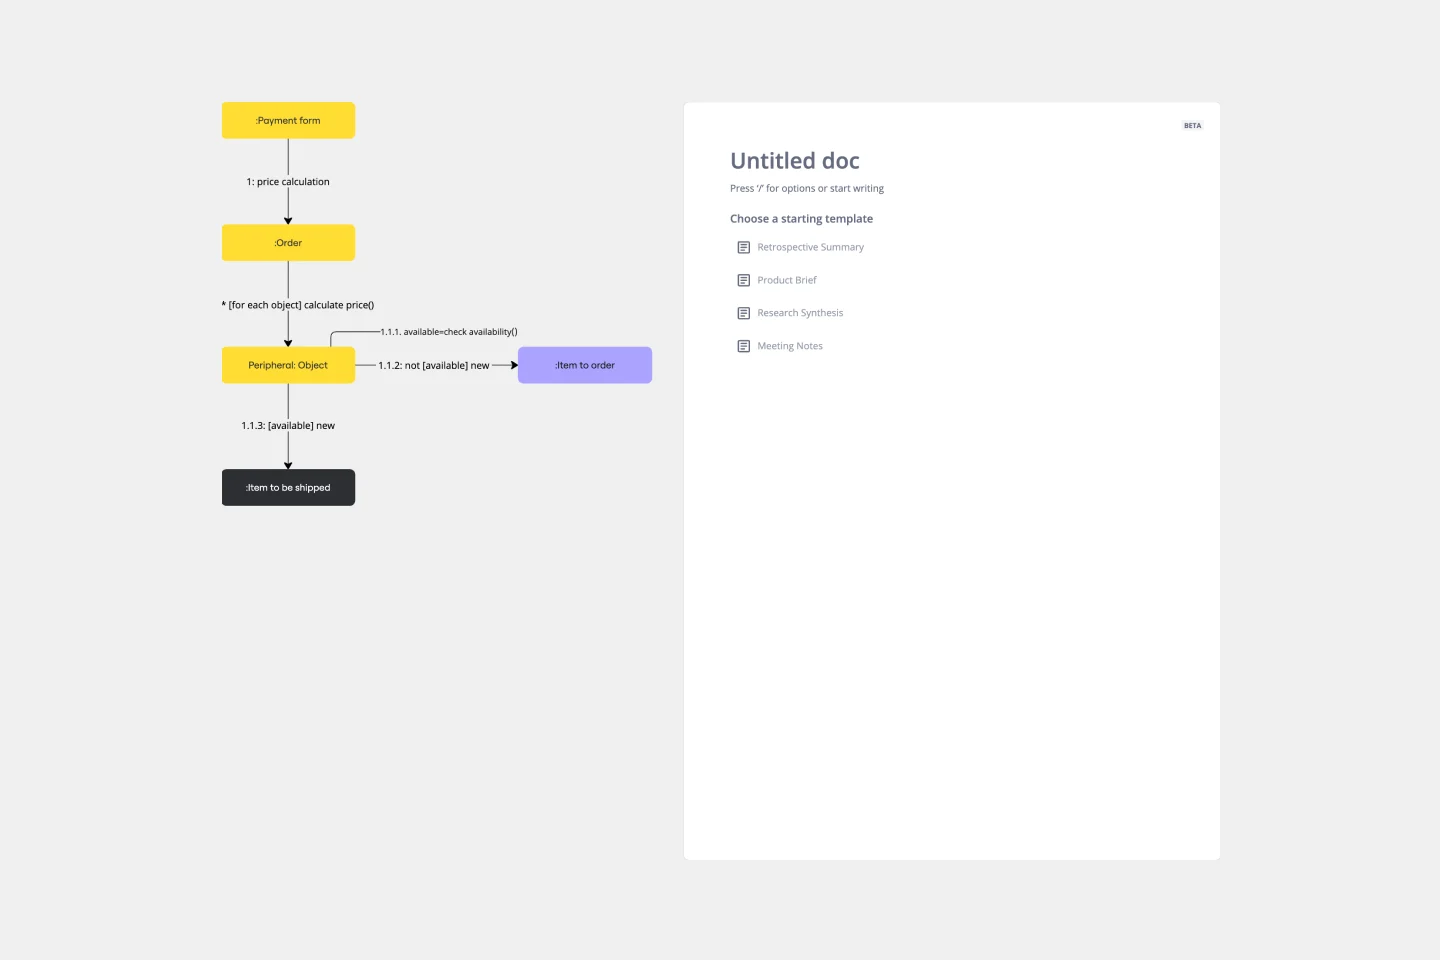
UML Communication Diagram Template
Works best for:
Software Development, Mapping, Diagrams
Most modern programs consist of many moving parts working to a precise set of instructions. With a communication diagram, you can visualize exactly how those parts work together, giving you a clearer understanding of your program as a whole. What’s more, the diagram leaves spaces for expanding the network of relationships as your product grows and evolves. A communication diagram is a vital tool in any software designer’s arsenal.
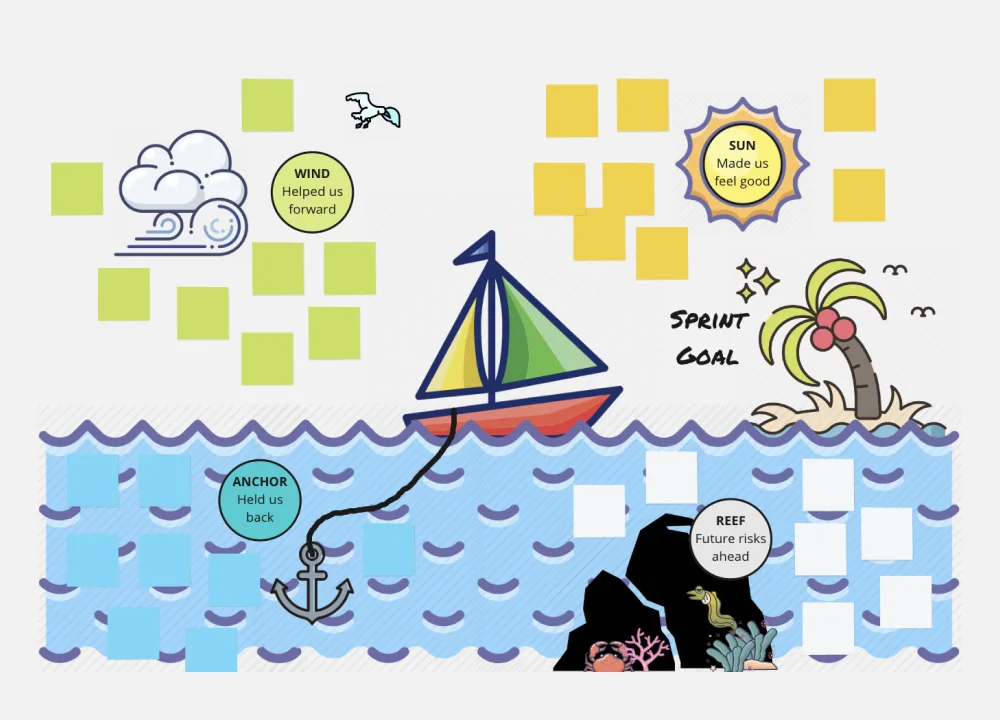
Sailboat Retro
Works best for:
Retrospectives, Agile Methodology, Meetings
The Sailboat Retrospective template offers a metaphorical journey through past iterations and future goals, likening the retrospective process to sailing a boat. It provides elements for identifying driving forces (winds), restraining forces (anchors), and destination (goal). This template enables teams to reflect on what propels them forward, what holds them back, and where they want to go next. By promoting visualization and metaphorical thinking, the Sailboat Retrospective empowers teams to navigate challenges, set sail towards their objectives, and steer towards success effectively.
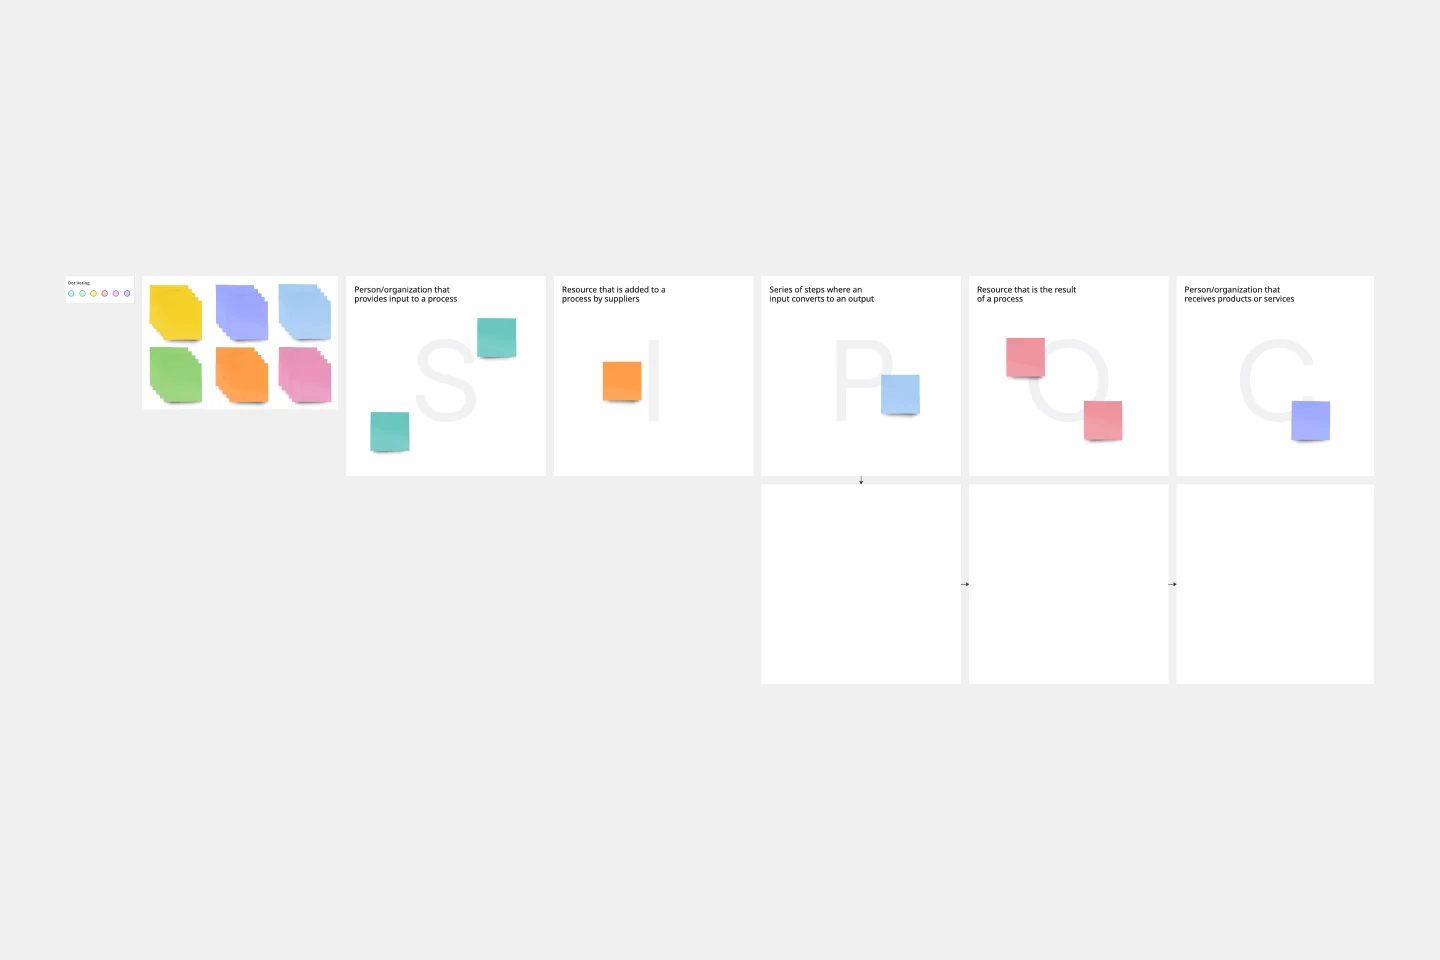
SIPOC Template
Works best for:
Agile Methodology, Strategic Planning, Mapping
A SIPOC diagram maps a process at a high level by identifying the potential gaps between suppliers and input specifications and between customers and output specifications. SIPOC identifies feedback and feed-forward loops between customers, suppliers, and the processes and jump-starts the team to think in terms of cause and effect.
Value Network Mapping (1.0)
The Value Network Mapping (1.0) template is a visual tool for analyzing and optimizing the relationships and interactions between stakeholders within a network. It provides a structured framework for mapping out value exchanges, dependencies, and opportunities for collaboration. This template enables teams to gain insights into the dynamics of their ecosystem, identify key actors, and align strategies for mutual benefit. By promoting transparency and collaboration, Value Network Mapping empowers organizations to enhance value creation and foster strategic partnerships.
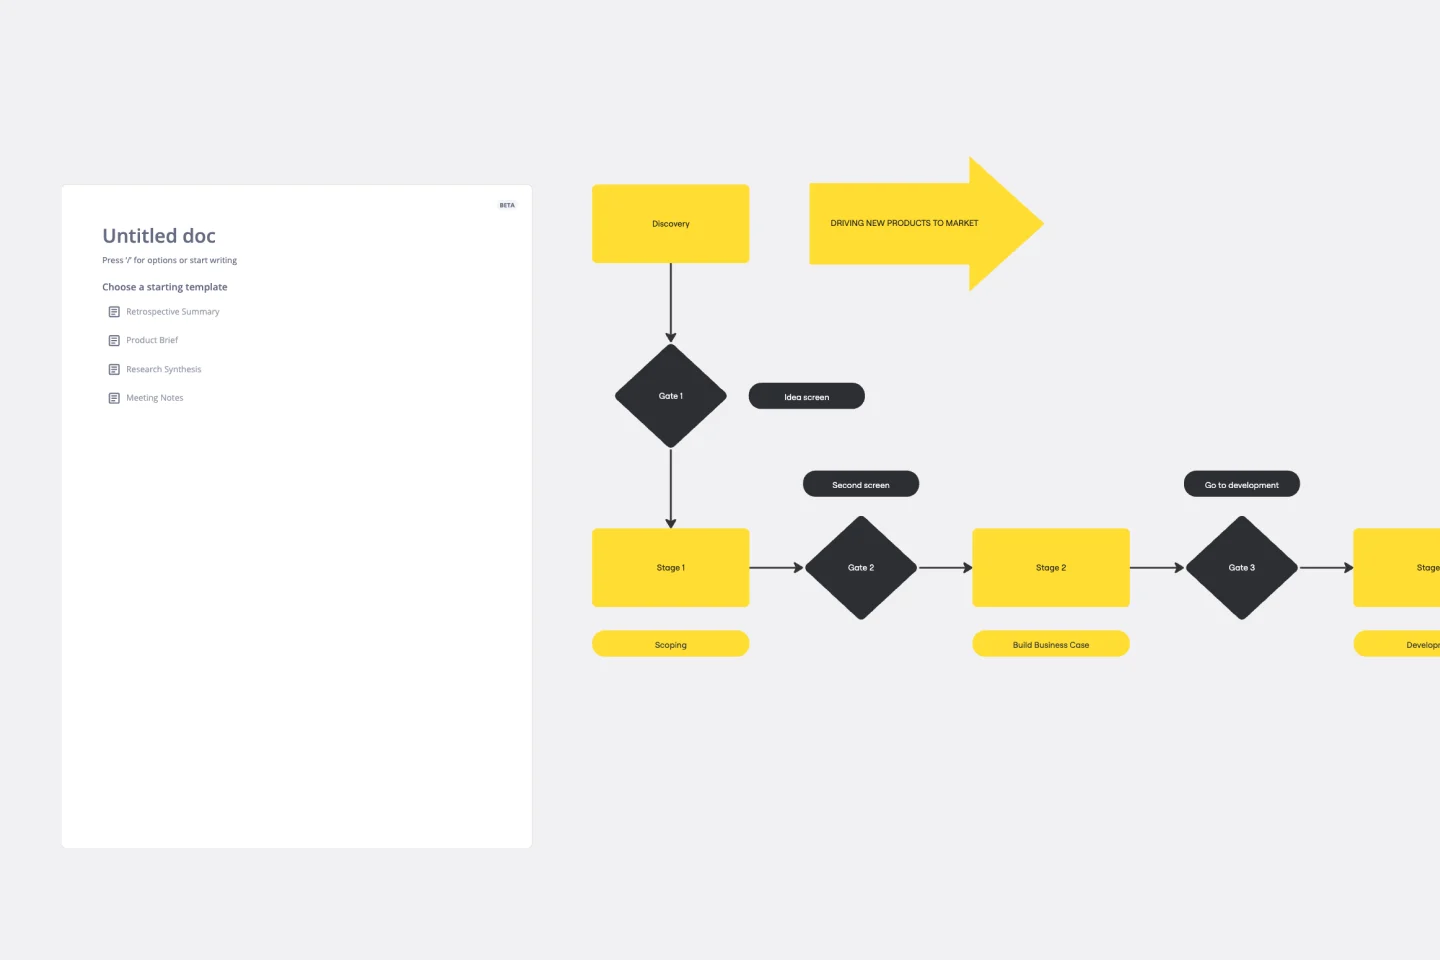
Stage-Gate Process Flowchart Template
Works best for:
Diagramming, Project Management
The Stage-Gate Process Flowchart Template structures a project into distinct stages separated by decision-making gates, enhancing the quality of decisions and leading to more successful project outcomes.
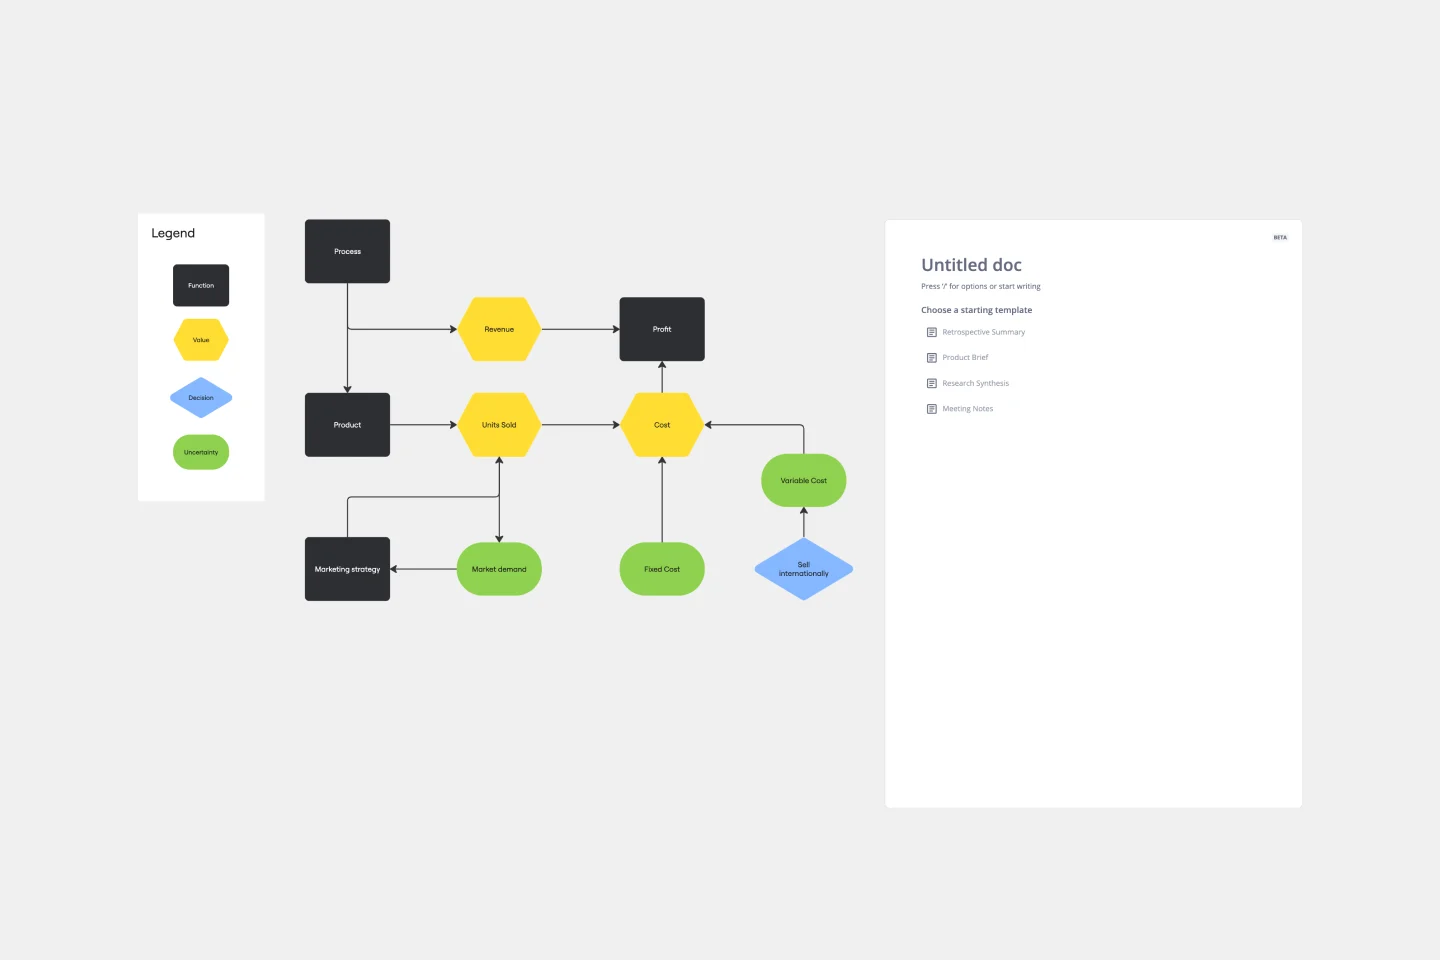
Influence Diagram Template
Works best for:
Business Management, Decision Making, Diagrams
See the big picture of any business decision with this Influence Diagram Template. You’ll define the decision you have to make and brainstorm everything that could impact it. When you build connections between these factors, you’ll be able to put the right amount of weight into each one as you make your decision.