Dichotomous Key Template
Enhance learning, classification accuracy, and collaborative efforts with the dichotomous key template.
About the Dichotomous Key Template
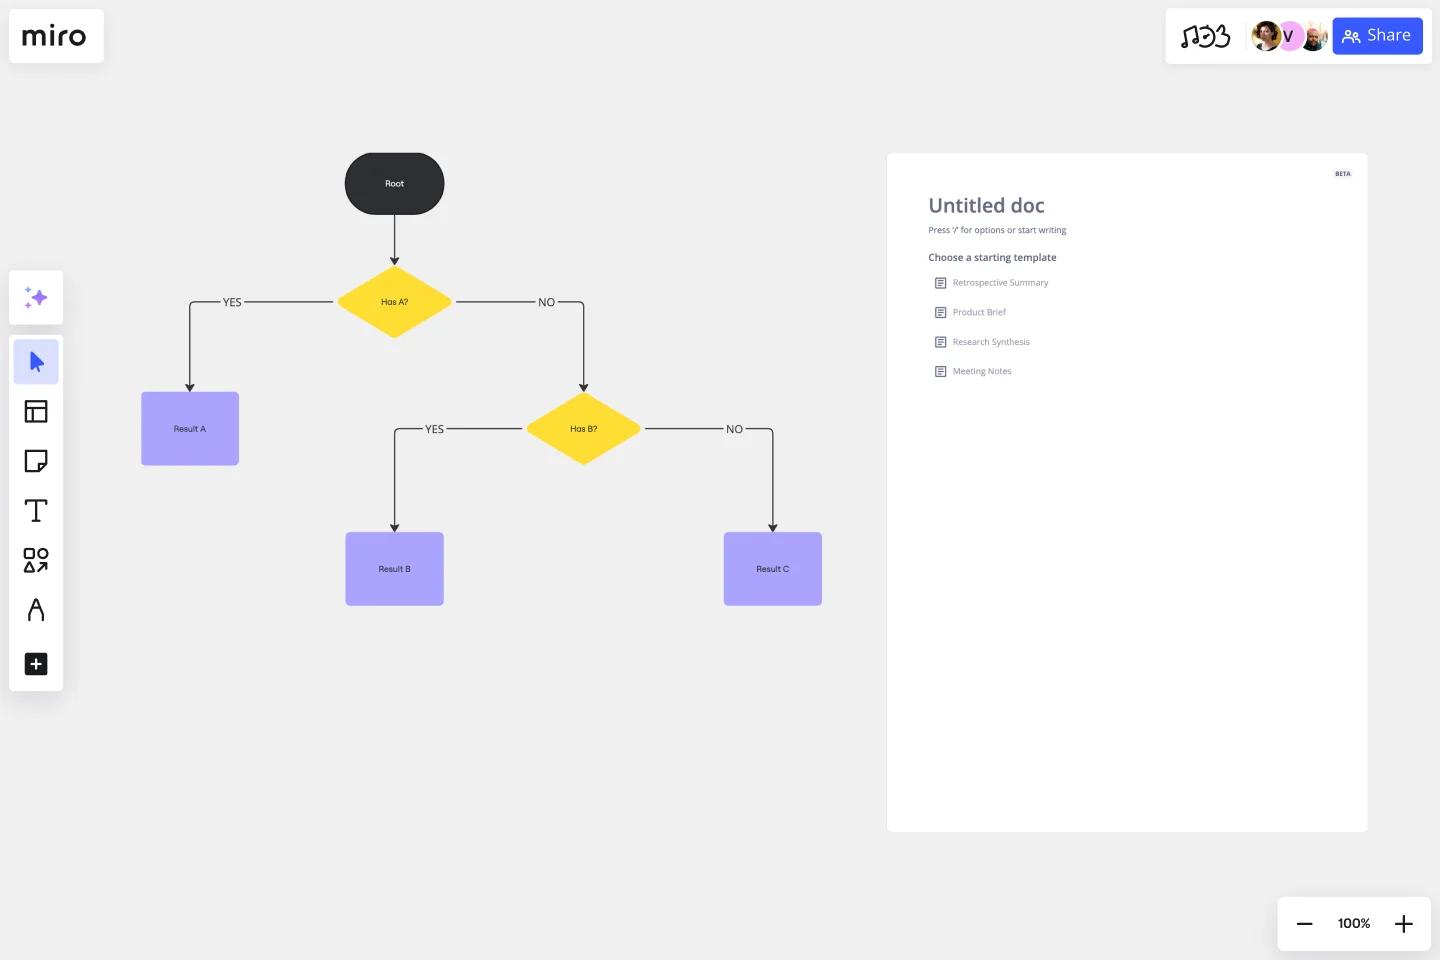
When dealing with complex subjects, a methodical and analytical approach is often necessary to unlock their mysteries. The dichotomous key template is a tool that simplifies these complexities by providing a step-by-step methodology to distinguish and categorize items based on a series of choices. This template is an invaluable educational and analytical tool that serves as an interactive guide through the maze of similar-looking entities. It can be used in biology for species identification or in any discipline that benefits from binary decisions.
How to use the dichotomous key template in Miro
Start with the basics: Open the template and begin by labeling the first decision point with a clear, concise question.
Make it your own: Click to edit any text box to enter questions and outcomes that are relevant to your subject matter.
Expand your key: If your content requires additional branches, simply drag and drop shapes or lines from the toolbar to extend the decision path.
Automate diagramming: Utilize automated diagramming features to maintain a clean, organized layout as your key grows in complexity.
Add context: Integrate images, links, or other artifacts by placing them onto your board to give deeper context to each decision point.
Editing and customizing the template is a breeze. Within a few clicks, the framework can be tailored to suit a wide array of scenarios while maintaining a clear and navigable structure.
Why should you use a dichotomous key template?
Enhance learning: It offers an interactive way to engage with material, making learning fun and more effective.
Improve accuracy: Breaking down complex identifications into simple yes/no questions minimizes errors.
Save time: It streamlines the process of categorization, allowing for quick decision-making.
Flexibility: Whether for educational purposes or to streamline workflow, the template is versatile and can be adapted to any set of criteria.
Collaborative: It supports collaborative efforts, allowing teams to contribute to and view the decision-making process in real time.
If you prefer to start from scratch, Miro's diagramming capabilities and tree diagram builder can help you create a dichotomous key in no time. Collaborate with others in real-time or async as you build out your dichotomous key.
Can the dichotomous key template handle more than biological classifications?
Absolutely. While traditionally used in biology, the template is designed to be a versatile tool for any categorization or decision-making process.
Is the template suitable for team collaboration?
Yes, the template supports real-time collaboration, making it perfect for teams to work together in mapping out decision trees and categorization keys.
How do I know if my dichotomous key is complete?
A key is complete when each branch leads to a conclusive outcome and all items have been classified without ambiguity.
What if I need to revise my dichotomous key?
The template is fully editable. You can easily adjust the questions, add branches, or refine the outcomes as your understanding of the categorized items evolves.
Get started with this template right now.

20/80 Process Diagram - EOS Compatible
Works best for:
Diagramming
The 20/80 Process Diagram - EOS® Compatible template is a visual tool for mapping out processes and workflows aligned with the Entrepreneurial Operating System (EOS®) methodology. It provides a structured framework for identifying core processes and key activities that drive business outcomes. This template enables organizations to streamline operations, clarify roles and responsibilities, and enhance accountability. By promoting alignment with EOS® principles, the 20/80 Process Diagram empowers teams to achieve organizational excellence and drive sustainable growth.
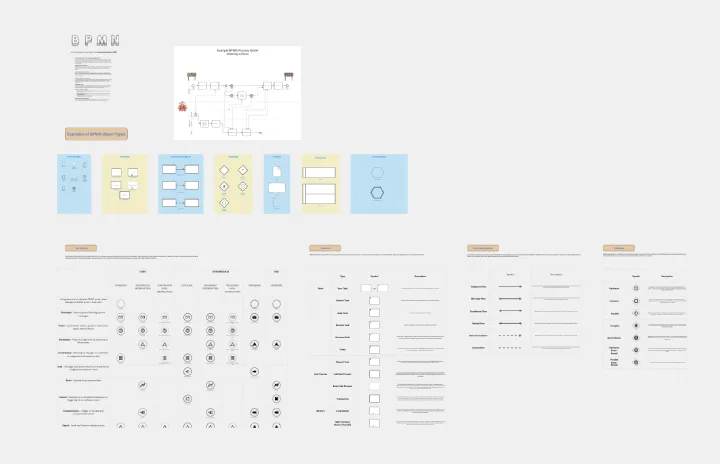
Comprehensive Guide to BPMN
Works best for:
BPMN, Diagramming
Tame the Workflow Beast: Your Visual Guide to BPMN with Miro!
VRIO Analysis Template
Works best for:
Diagramming, Strategy
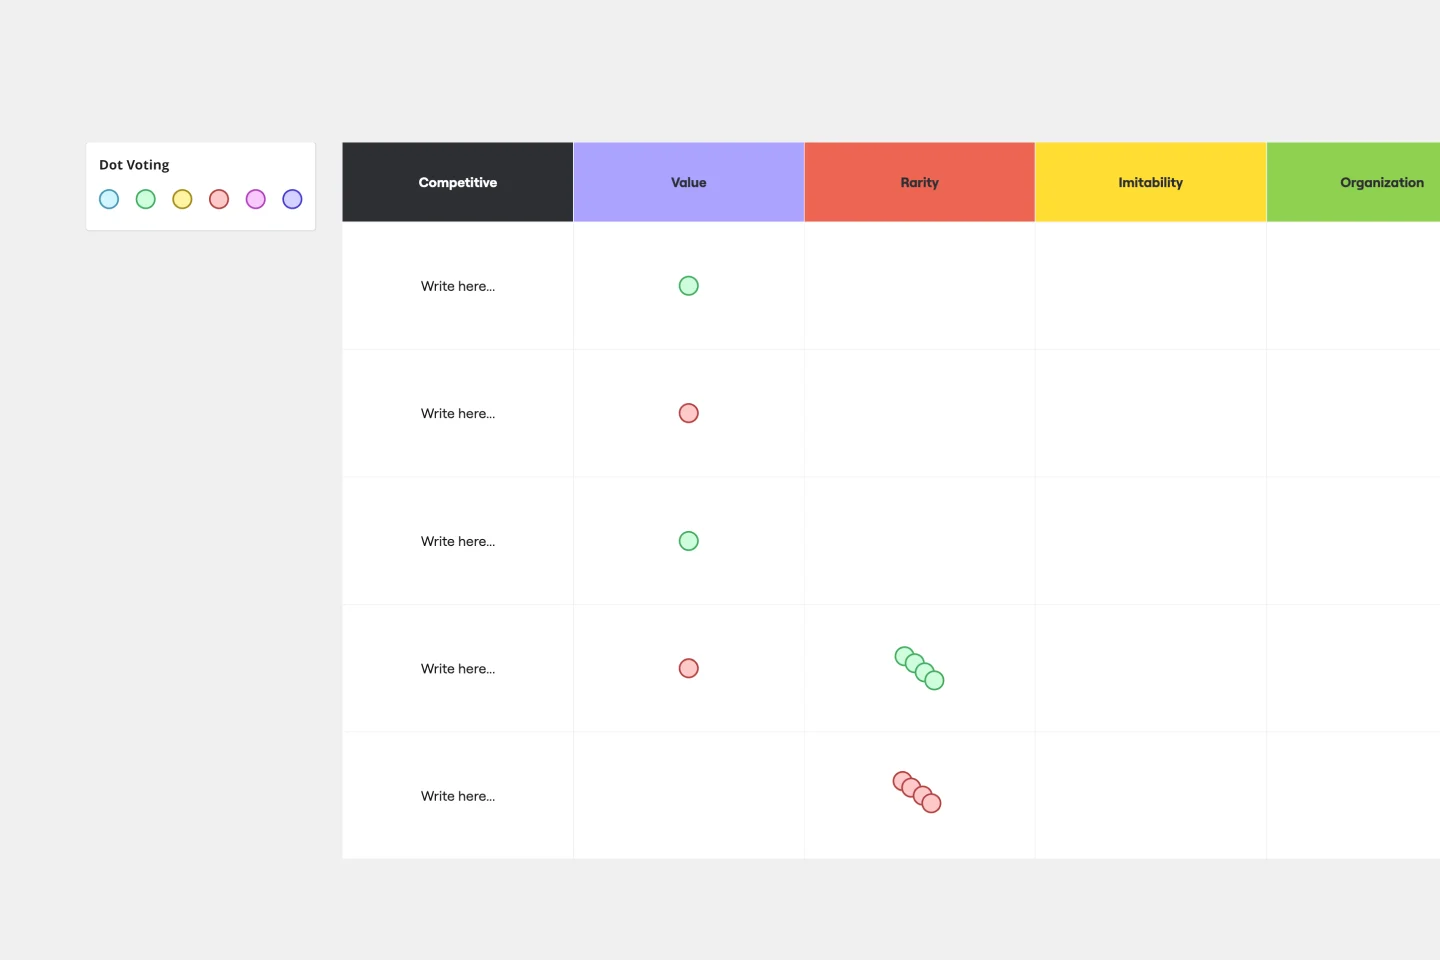
The VRIO Analysis Template is a framework that helps businesses evaluate their resources and capabilities for competitive advantage. It categorizes resources into four areas: Value, Rarity, Imitability, and Organization. This provides a comprehensive view of an organization's strengths and potential weaknesses. The template has the key benefit of offering quick visual insights. Decision-makers can immediately identify and focus on resources that are valuable, rare, hard to imitate, and well-organized. This ensures a sustainable competitive edge and saves time by avoiding lengthy textual analyses.
UML State Machine Diagram Template
Works best for:
Software Development, Mapping, Diagrams
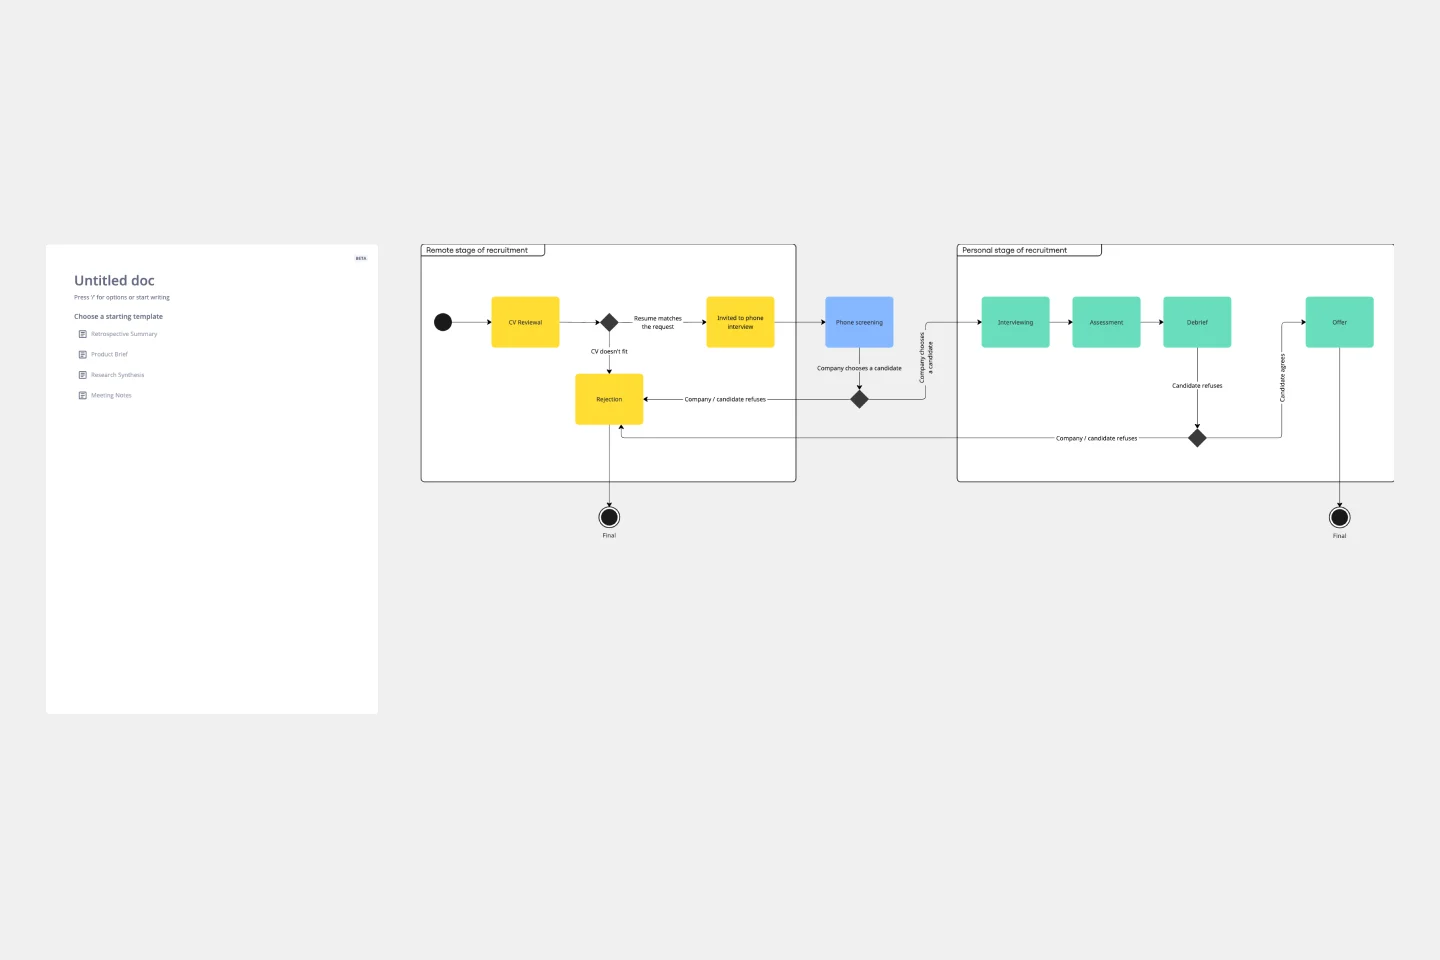
Visualize the workflow of a process and how objects perform actions based on different stimuli. State machine diagrams are valuable for understanding how an object responds to events at the different stages of its life cycle. They are also helpful for visualizing event sequences in a system.
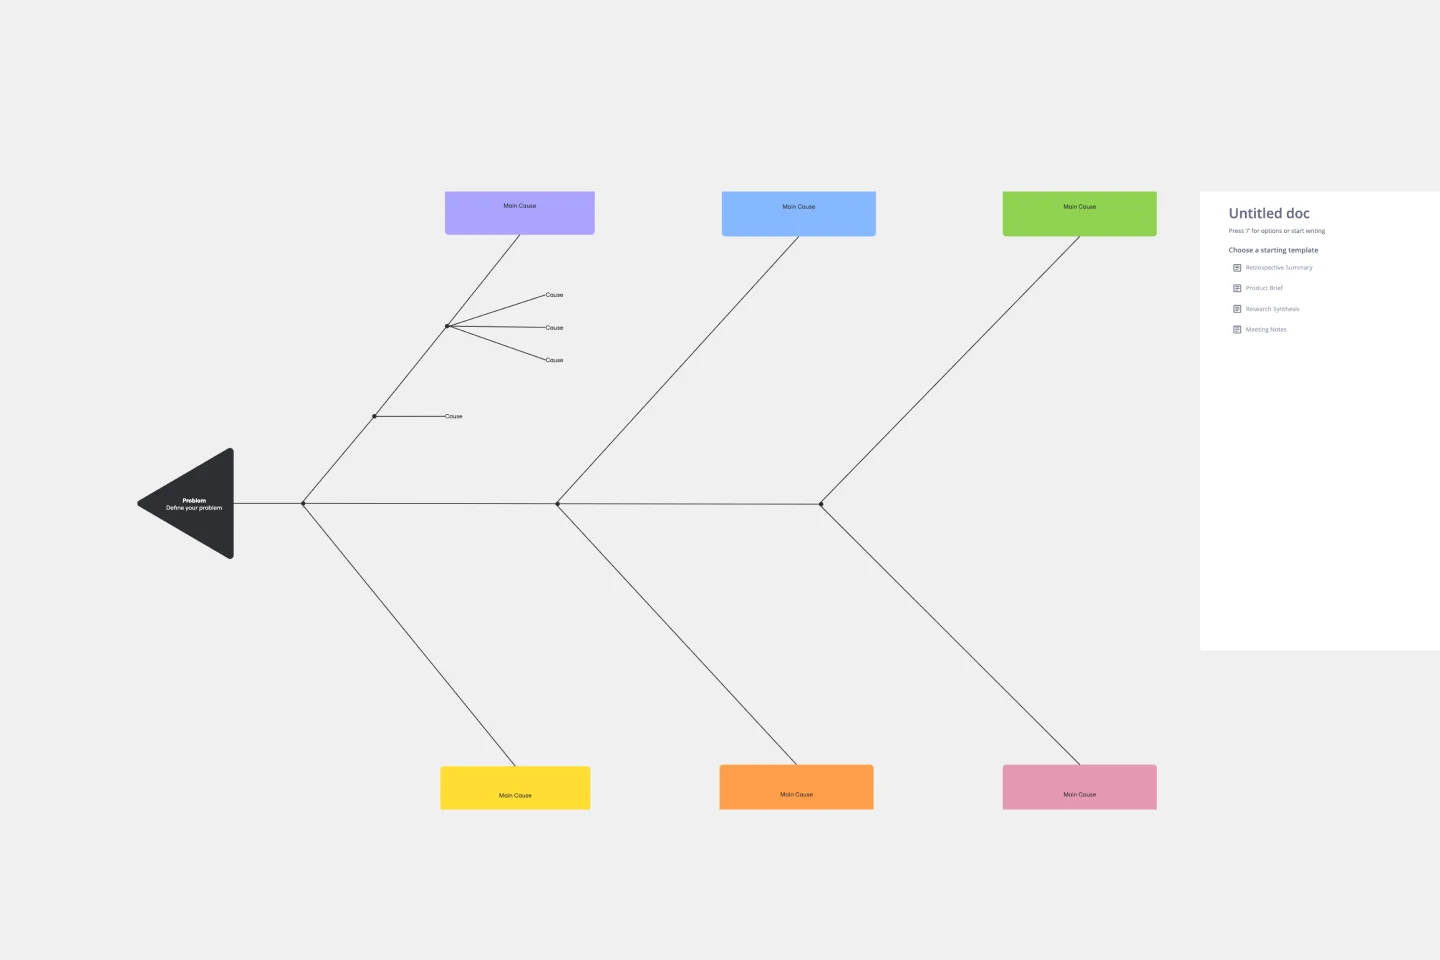
Cause and Effect Diagram Template
Works best for:
Diagramming
The Cause and Effect Diagram Template is a useful tool for analyzing complex relationships, identifying root causes of problems, and improving organizational processes. It can be customized to fit user's unique needs and provides a structured framework for analysis. Teams can use real-time collaborative analysis on the Miro platform to drive continuous improvement initiatives.
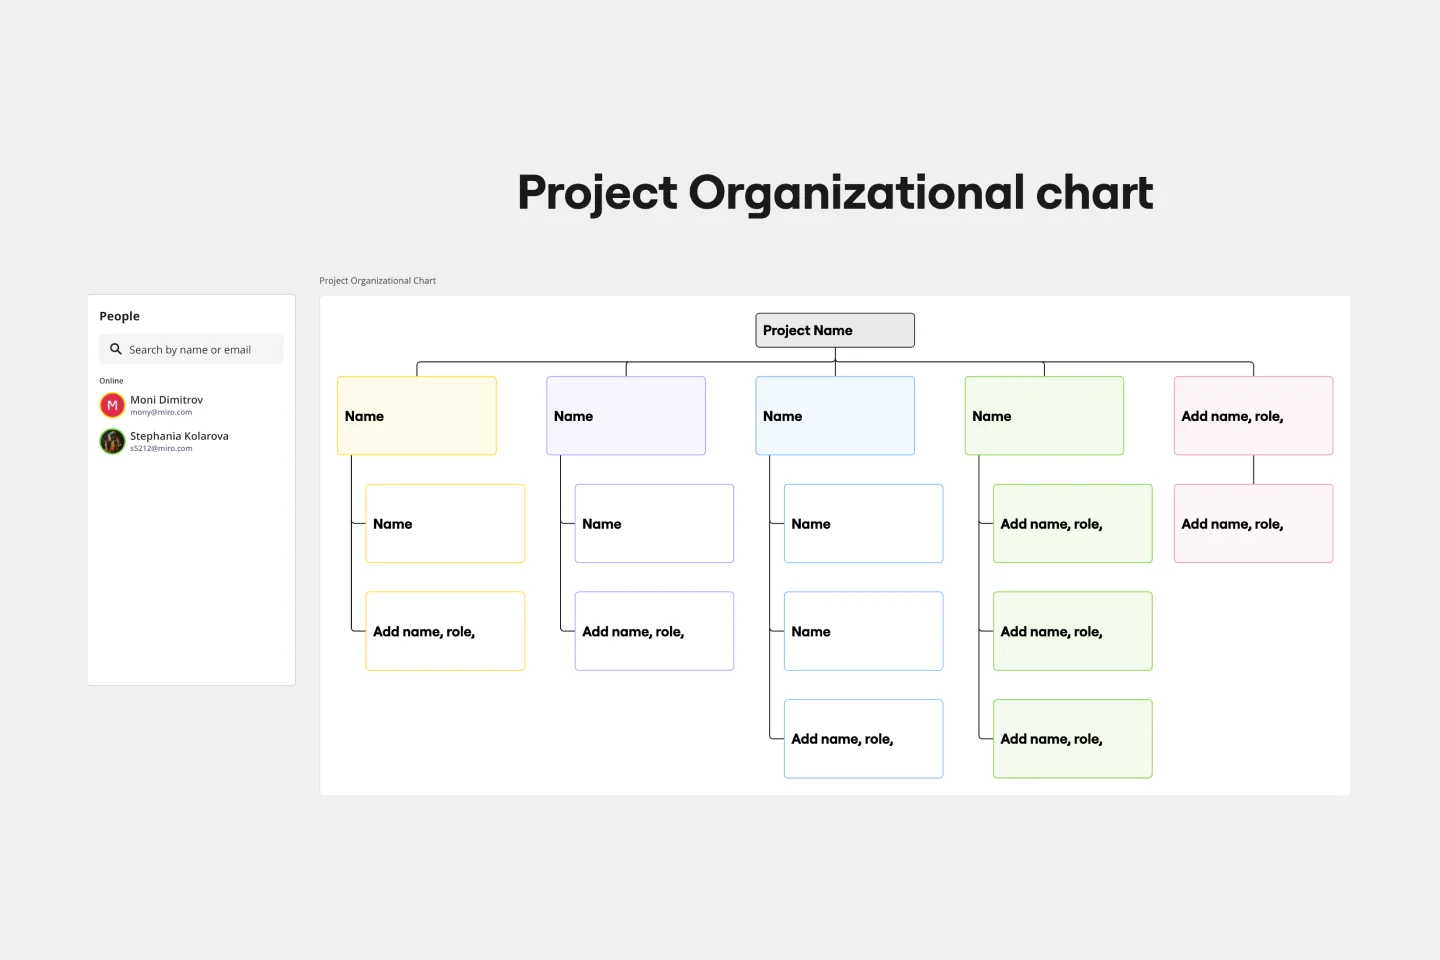
Project Organizational Chart Template
Works best for:
Project Management, Documentation, Org Charts
When you’re embarking on a long, complex project, you will inevitably hit roadblocks and obstacles. It’s important to have your project organizational chart on hand to overcome those challenges. A project organizational chart is a visual diagram that illustrates who is on your team and the role they play in a given project. It documents the structure of the project organization, the hierarchy between team members, and the relationships between employees. Project organizational charts are useful tools for clarifying who does what, securing buy-in, and setting expectations for the group.