Design Process Flowchart Template
Make the design process more transparent and manageable with the design flowchart process template, allowing for better planning, decision-making, and execution of design projects.
About the Design Process Flowchart Template
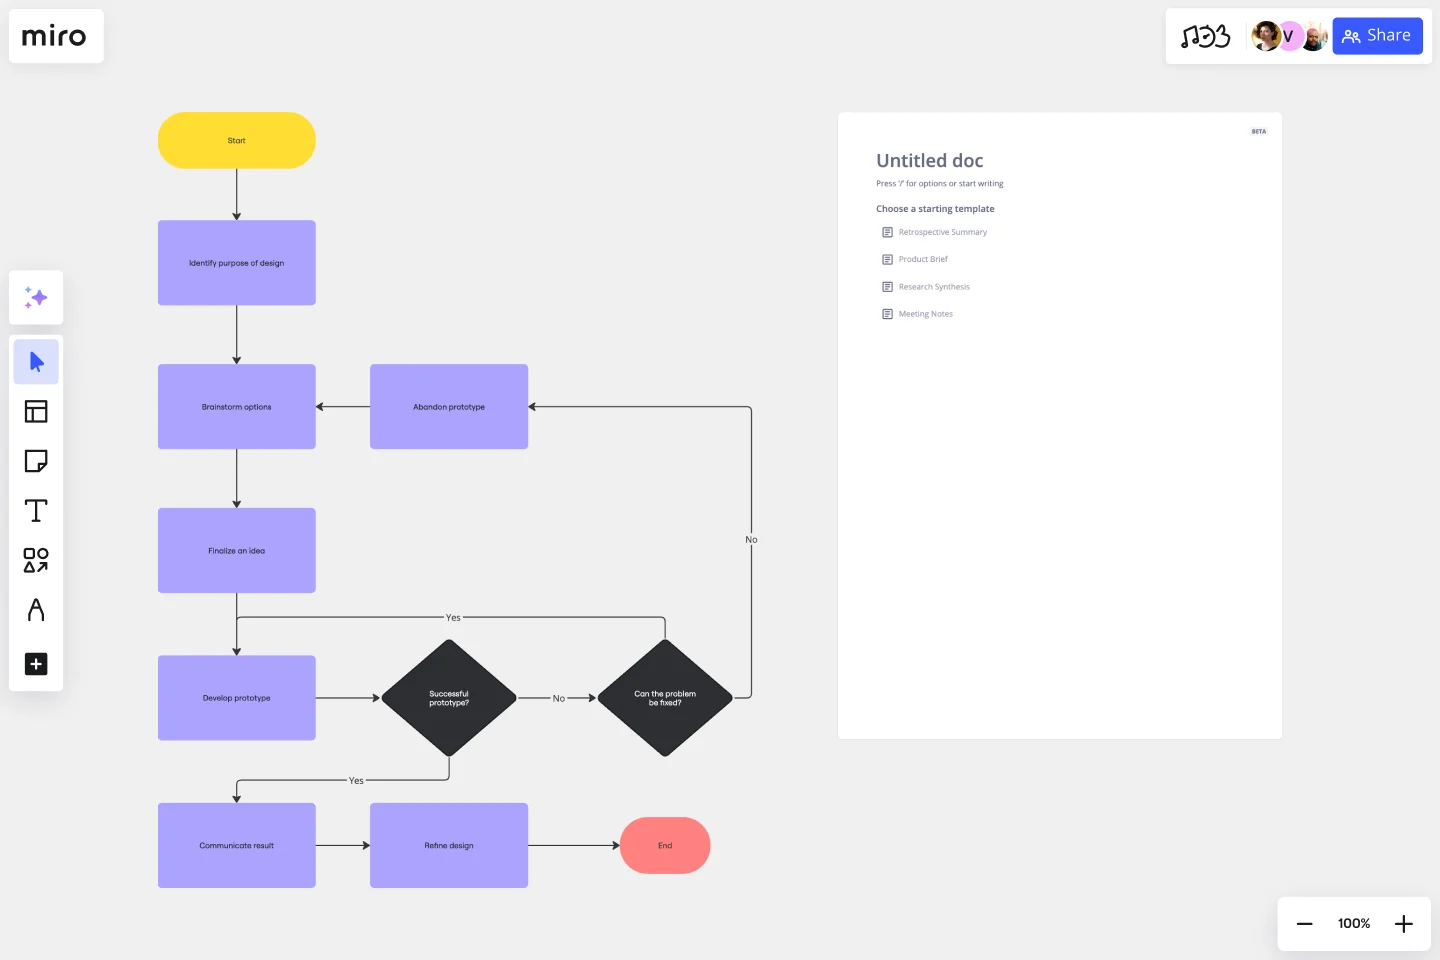
The process of designing involves creativity and attention to detail, often requiring a structured approach to bring ideas to life effectively. A design process flowchart template is a critical tool to navigate this journey. It provides a visual roadmap, outlining each step of the design process from conception to completion. This template helps organize thoughts, ideas, and actions, ensuring a smooth workflow and cohesive final product.
The design process flowchart template is a structured guide for designers and teams, mapping out the stages such as research, ideation, prototyping, testing, and finalization. By laying out these steps visually, the template makes the design process more transparent and manageable, allowing for better planning, decision-making, and execution of design projects.
How to use the design process flowchart template
Easy editing: Change the template to suit specific project needs by double-clicking shapes and lines. Adjust elements like text, shapes, and colors to reflect the unique aspects of the design process.
Expand the flowchart: Leverage advanced diagramming features to add more elements or detailed steps, enhancing its comprehensiveness without sacrificing clarity.
Add more resources: Drag and drop relevant files, links, or images to the board for a more enriched and context-aware design process.
Why should you use a design process flowchart template?
Streamlined workflow: Organizes and visualizes the design process, making it easier to follow and manage.
Facilitates creativity and innovation: Provides a structured approach that guides the creative process without stifling innovation.
Improves team collaboration: Enhances communication among team members by providing a clear and shared understanding of the project stages.
Customizable for many projects: Adaptable to different design projects, whether in graphic design, product development, or digital creation.
Effective project management: Help track progress, meet deadlines, and ensure a cohesive design outcome.
Can non-designers use this template effectively?
Yes, the template is designed to be user-friendly, making it accessible for non-designers to understand and participate in the design process.
How does this template help in managing large design projects?
For large projects, the template provides a clear overview of each phase, helping in breaking down complex tasks into manageable steps and ensuring all aspects of the project are addressed.
Can the flowchart be customized to include brand-specific elements?
The template is fully customizable, allowing the inclusion of brand-specific colors, fonts, and other elements to align with company branding.
Get started with this template right now.
Screen Flow Template
Works best for:
UX Design, Product Management, Wireframes
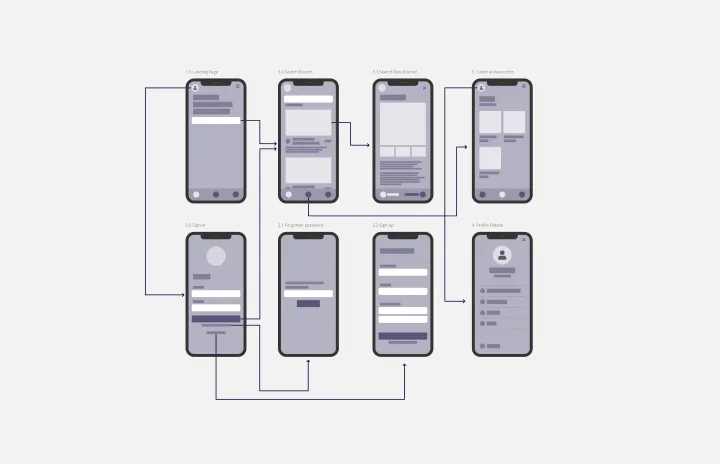
A screen flow (or wireflow) brings together a multi-screen layout that combines wireframes with flowcharts. The result is an end-to-end flow that maps out what users see on each screen and how it impacts their decision-making process through your product or service. By thinking visually about what your customers are looking at, you can communicate with internal teams, stakeholders, and clients about the decisions you’ve made. You can also use a screen flow to find new opportunities to make the user experience frictionless and free of frustration from start to end.
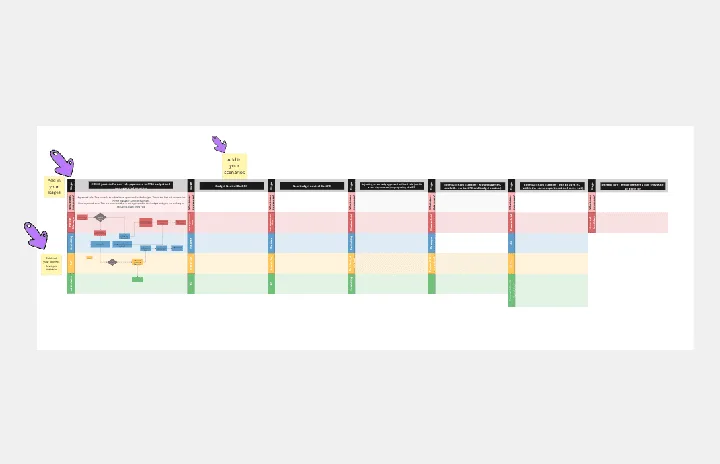
Swim Lane Diagram with Data
Works best for:
Flowchart, Mapping, Diagrams
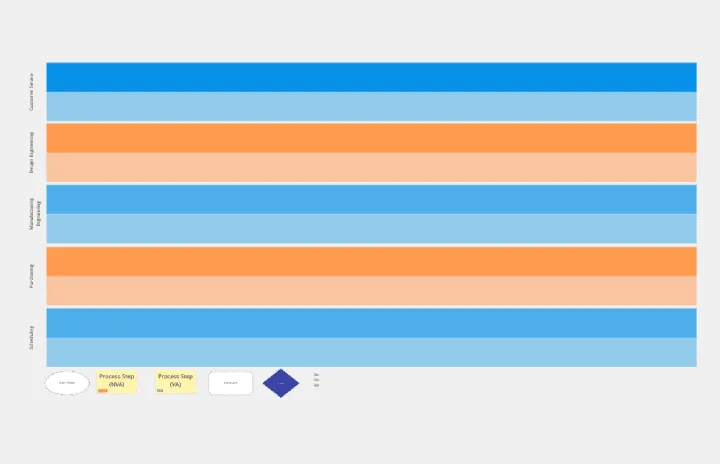
The Swim Lane Diagram with Data template is a visual tool for illustrating processes or workflows with swimlanes that contain additional data or information. It provides elements for documenting process steps, timelines, and performance metrics within each swimlane. This template enables teams to analyze process efficiency, identify bottlenecks, and make data-driven decisions for process improvement. By combining visual clarity with data insights, the Swim Lane Diagram with Data empowers organizations to optimize workflows and drive continuous improvement effectively.
Production Flowchart Template
Works best for:
Flowcharts
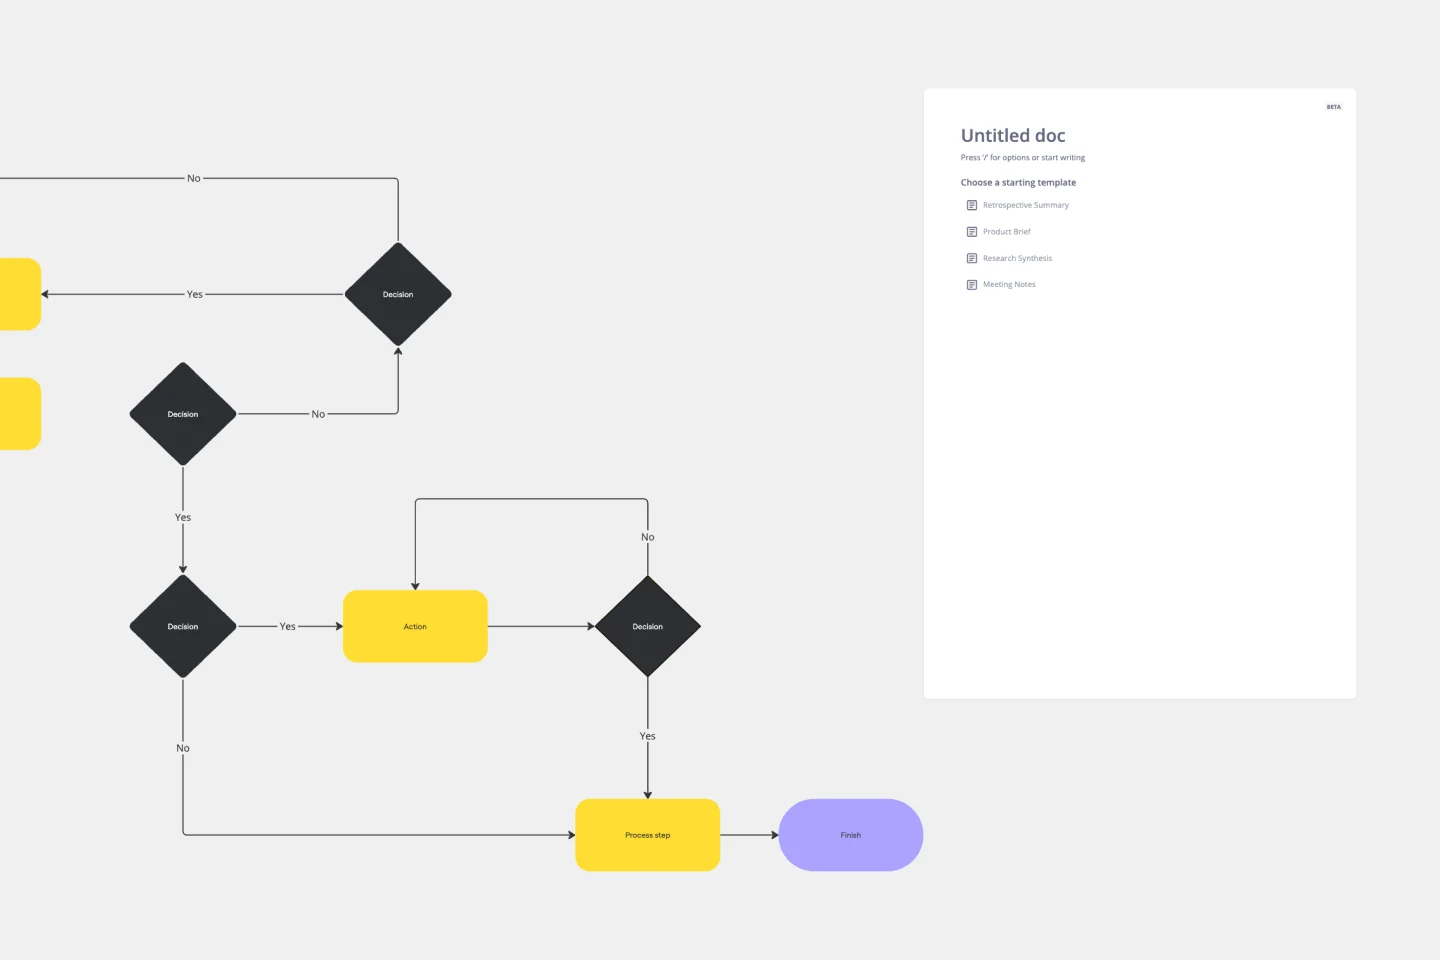
The Production Flowchart Template is a well-crafted tool that clearly represents a production process from start to finish. It breaks down complex procedures into easy-to-understand segments, making it easier for stakeholders to grasp the entire process. One of the key benefits of using this template is that it helps to clarify complex production pathways. By mapping out operations visually, teams can identify potential bottlenecks or inefficiencies, facilitating timely and well-informed decision-making.
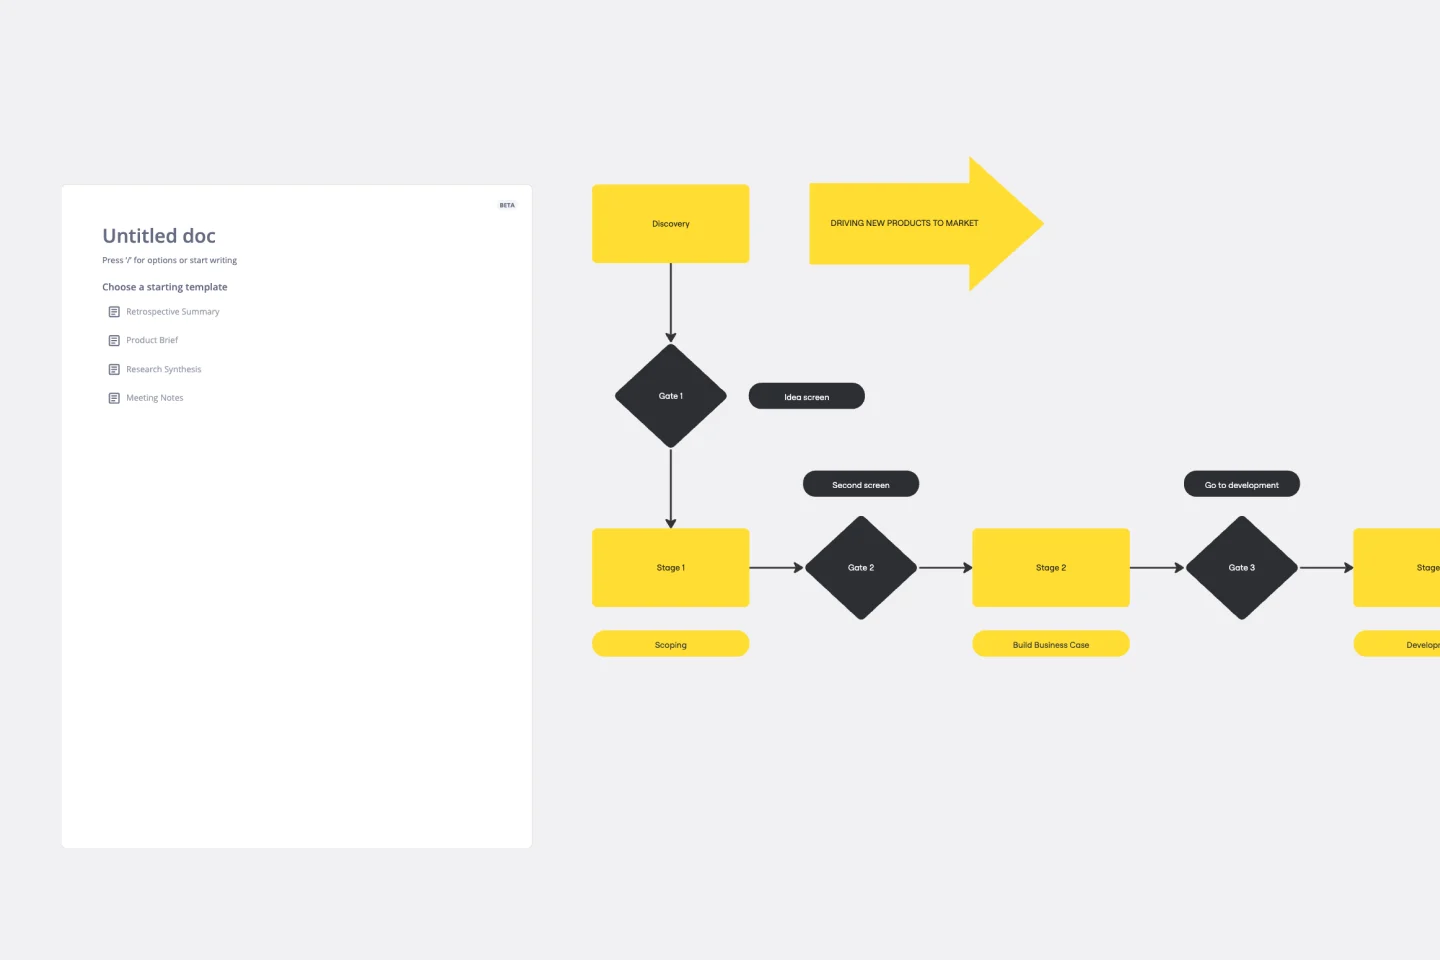
Stage-Gate Process Flowchart Template
Works best for:
Diagramming, Project Management
The Stage-Gate Process Flowchart Template structures a project into distinct stages separated by decision-making gates, enhancing the quality of decisions and leading to more successful project outcomes.
Headcount Approval Process Flowchart
Works best for:
Flowcharts, Mapping, Diagrams
The Headcount Approval Process Flowchart template offers a visual framework for illustrating the steps and stages involved in the headcount approval process within an organization. It provides a structured framework for documenting approval workflows, roles, and decision points. This template enables HR professionals and managers to streamline the headcount approval process, ensure compliance, and improve transparency and accountability. By promoting clarity and efficiency, the Headcount Approval Process Flowchart empowers organizations to manage their workforce effectively and make informed staffing decisions.
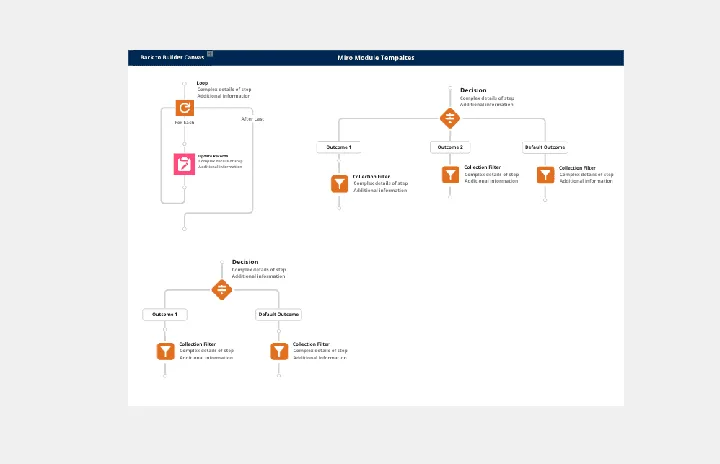
Salesforce Flow Builder
Works best for:
Flowcharts, Mapping, Diagrams
The Salesforce Flow Builder template offers a visual tool for designing and automating business processes within the Salesforce platform. It provides elements for creating flowcharts that represent process flows, decision logic, and data transformations. This template enables Salesforce administrators and developers to streamline workflows, improve productivity, and enhance user experiences. By promoting automation and efficiency in Salesforce process design, the Salesforce Flow Builder empowers organizations to leverage the full potential of the Salesforce platform and drive business success effectively.