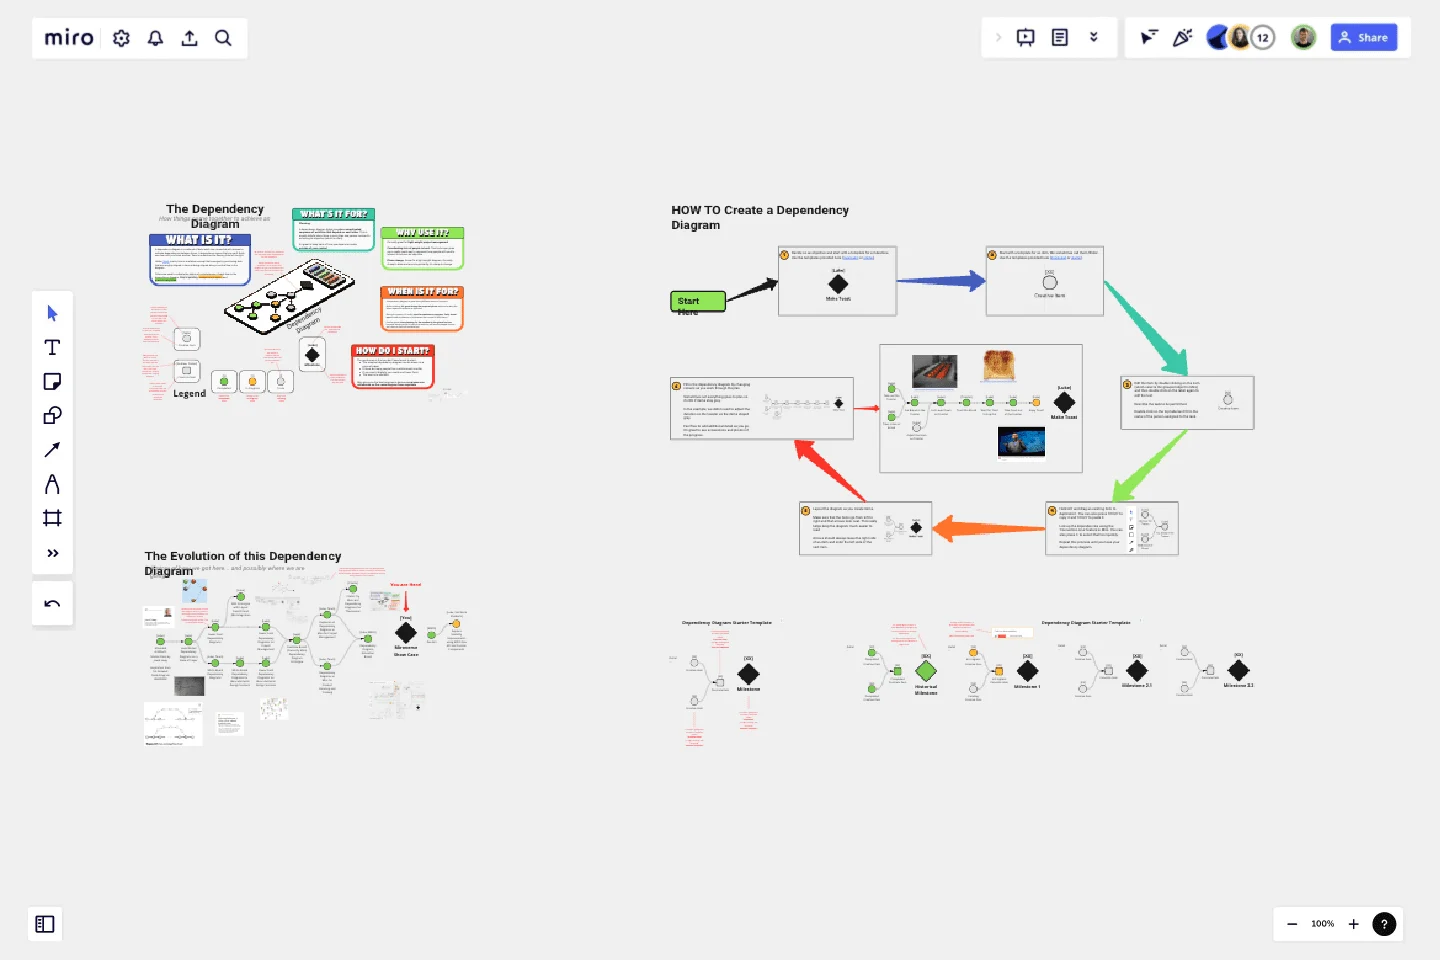
Dependency Diagrams Educational Board
A dependency diagram is used for light-weight project management and planning.
Coordinating lots of people is hard. This technique gives you a really visual way to represent how people will need to interact to achieve an objective.
Plans change. Since it's a light-weight diagram, it's really cheap to draw and more importantly, it's cheap to change.
Colors are used to indicate the status of completeness of each item in the dependency diagram. Grey is pending, orange is in progress and green is completed.
A dependency diagram helps you plan a complicated sequence of activities that depend on each other. This is usually helpful when there is more than one person involved in achieving an objective (which is often).
It's great to keep track of how you depend on tasks outside of your control.This educational board explains what it is, how to create one using Miro and gives a real-world example in the form of the journey for the evolution of this dependency diagram.
This template was created by Luke Machowski.
Get started with this template right now.
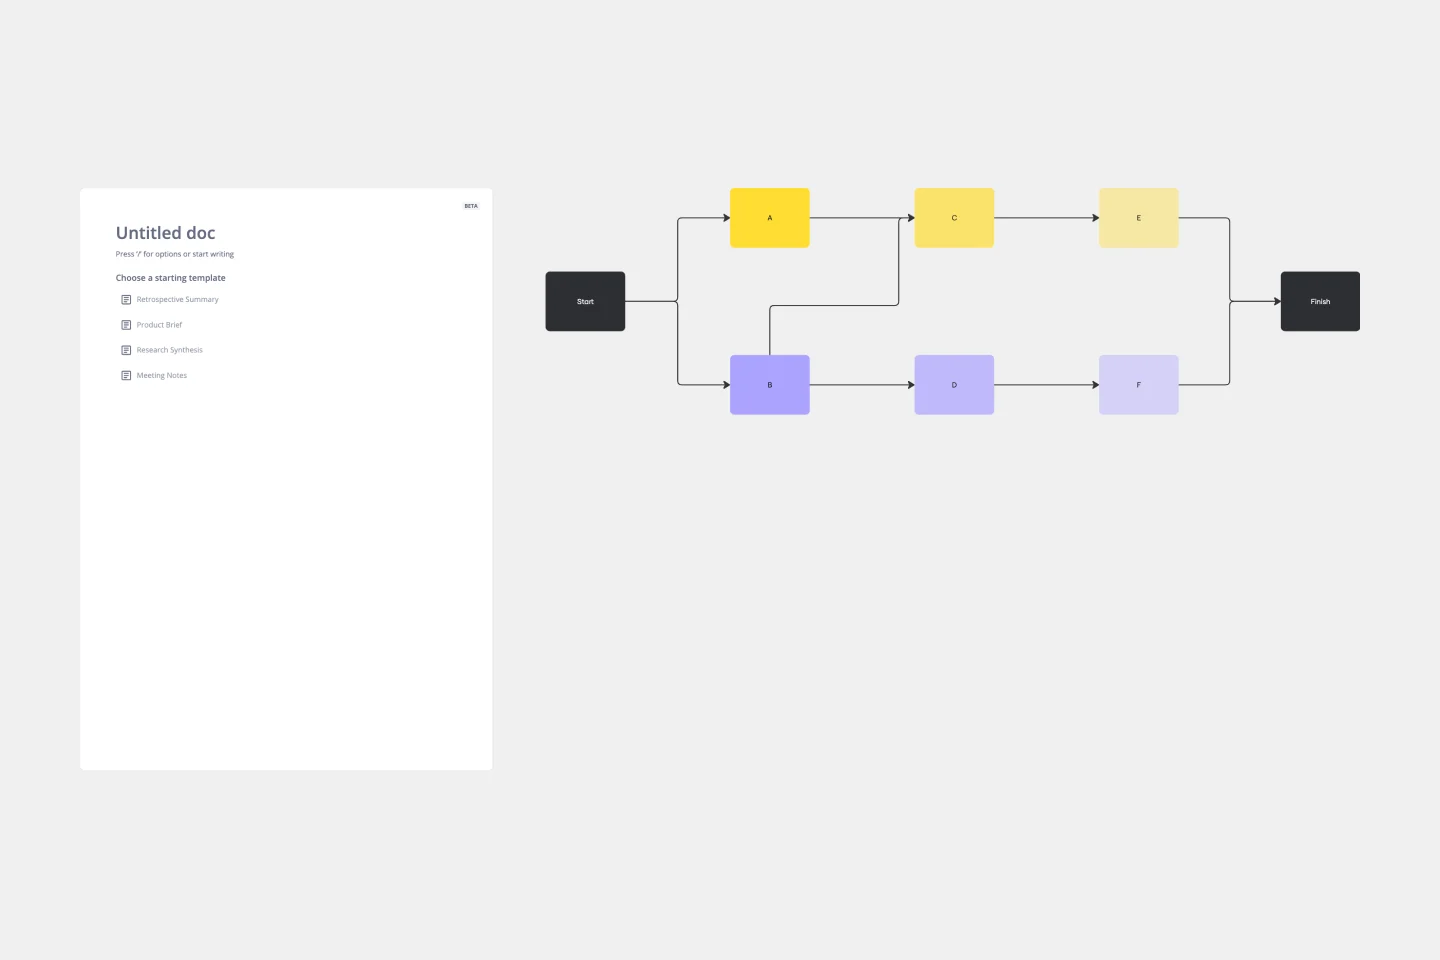
Precedence Diagram
Works best for:
Diagramming, Mapping
The Precedence Diagram Template offers a visual tool that maps out project activities and their interrelated sequences. This diagram empowers teams to recognize and anticipate workflow structures by illustrating the connections and dependencies among tasks.
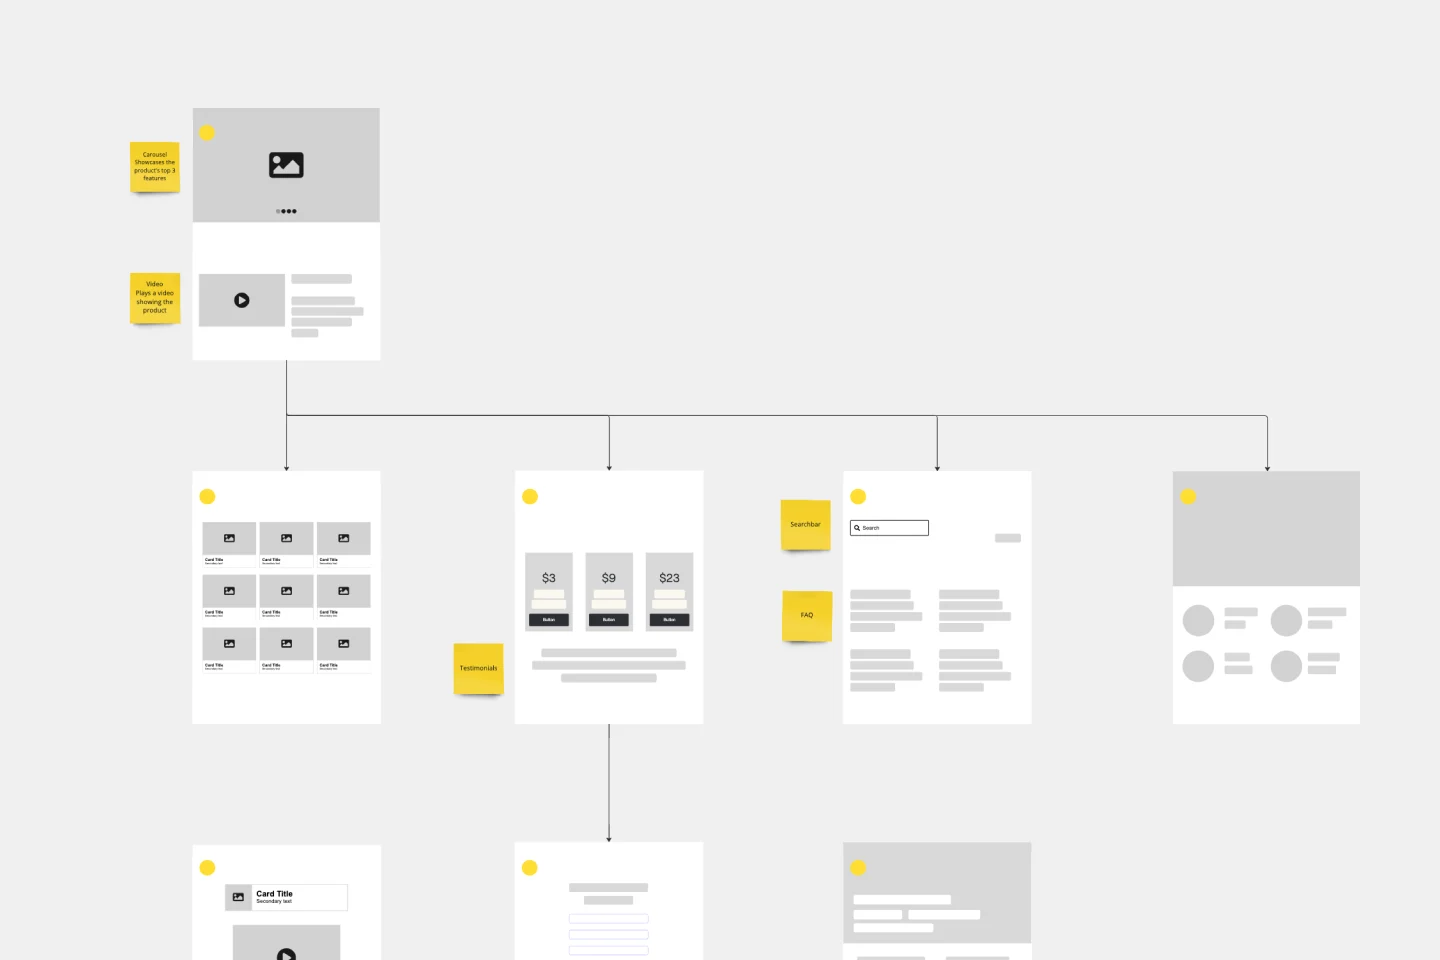
Website Flowchart Template
Works best for:
Flowcharts, Mapping, User Experience
A website flowchart, also known as a sitemap, maps out the structure and complexity of any current or future website. The flowchart can also help your team identify knowledge gaps for future content. When you’re building a website, you want to ensure that each piece of content gives users accurate research results based on keywords associated with your web content. Product, UX, and content teams can use flowcharts or sitemaps to understand everything contained in a website, and plan to add or restructure content to improve a website’s user experience.
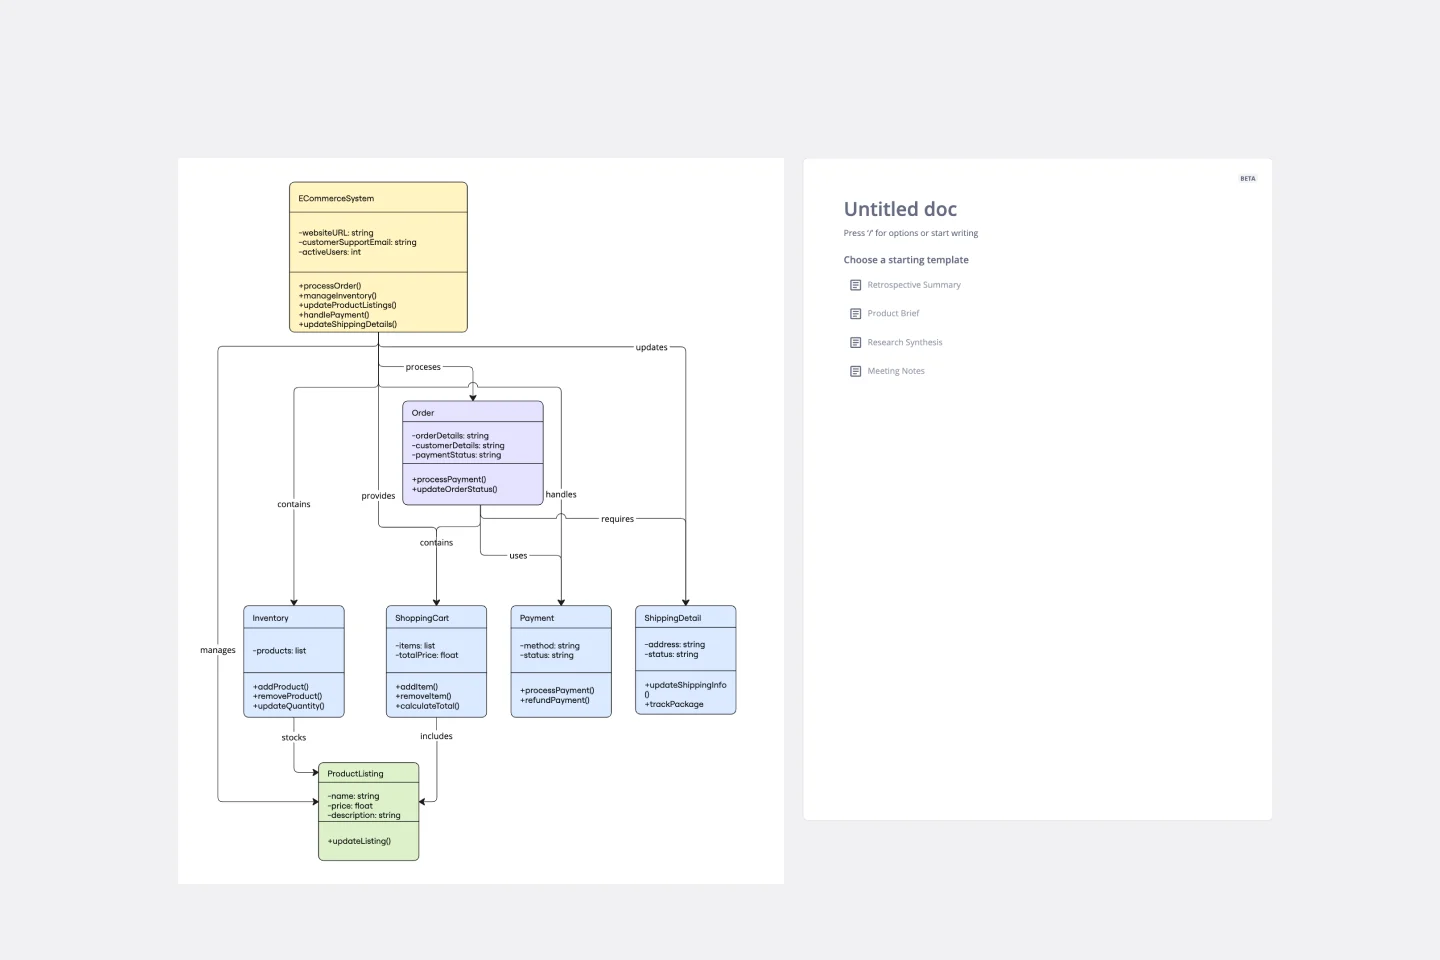
UML Class E-Commerce System Template
Works best for:
UML
The UML Class E-Commerce System Template streamlines the process of creating and visualizing the class structure of an e-commerce system. It provides a comprehensive framework that includes typical online shop features such as product listings, inventory management, shopping carts, orders, payments, and shipping details. This template facilitates a clear understanding of how these elements interact during an online sales transaction, making it an invaluable tool for teams working on e-commerce projects. By using this template, teams can save time, enhance collaboration, and ensure that their system architecture is robust and efficient, ready to adapt to their business's evolving needs.
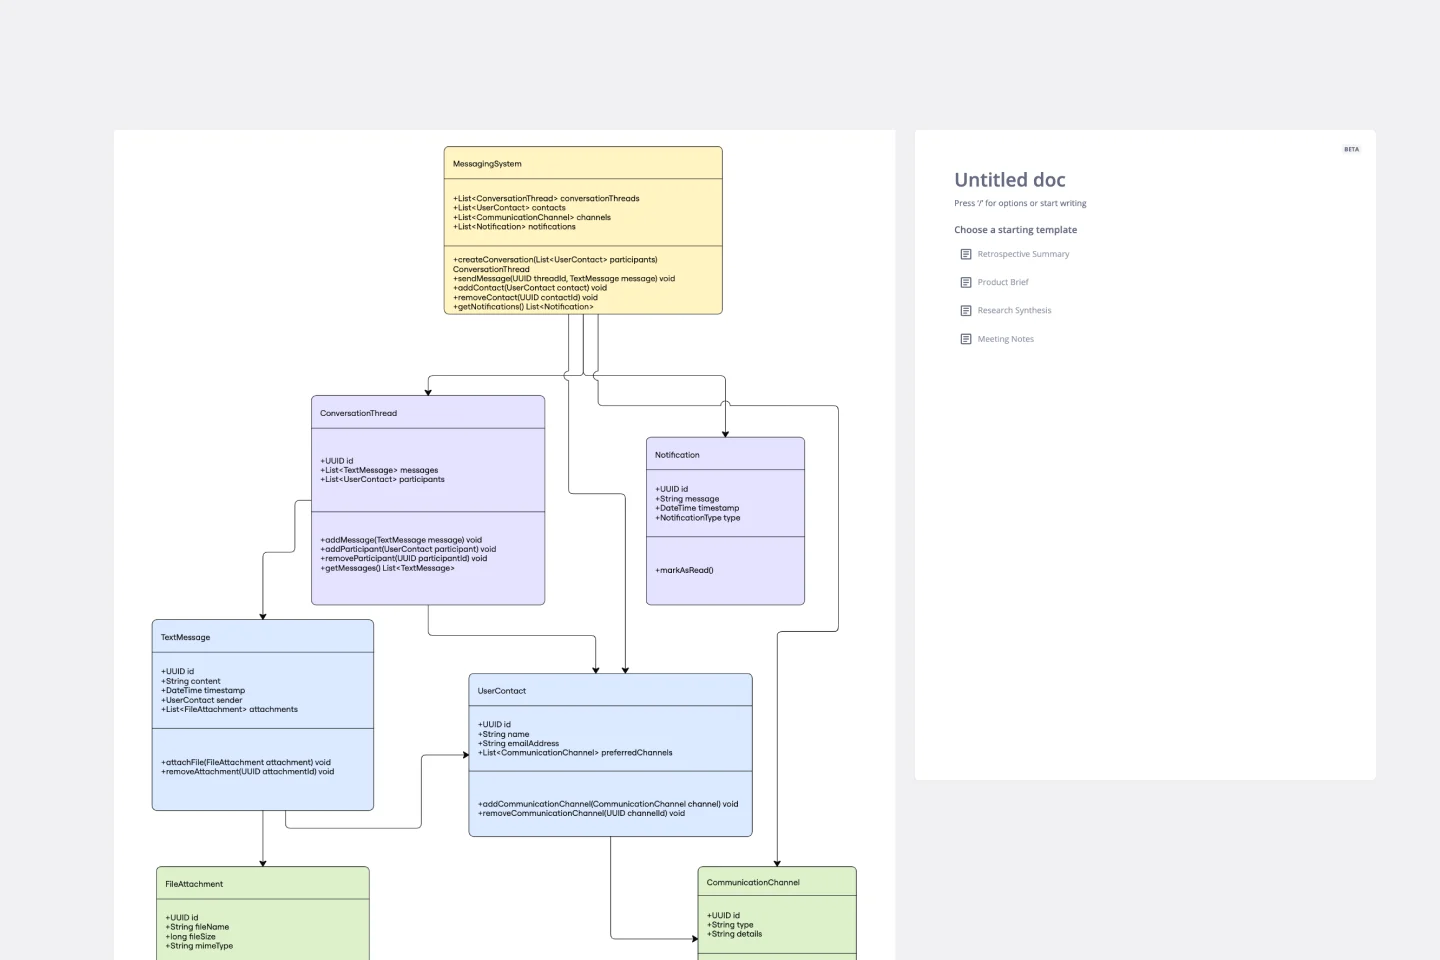
UML Class Messaging System Template
Works best for:
UML
The UML Class Messaging System Template streamlines the process of designing and analyzing messaging systems. It allows users to visually map out the structure of a system by detailing classes, their attributes, operations, and the relationships among objects. This template is particularly useful for illustrating the functionality of a messaging system, including the management of text messages, conversation threads, user contacts, notifications, and channels. It offers a clear visual representation of how all these elements interact within the system, making it an invaluable resource for developers, designers, and stakeholders aiming to enhance communication and reduce errors in the development phase.
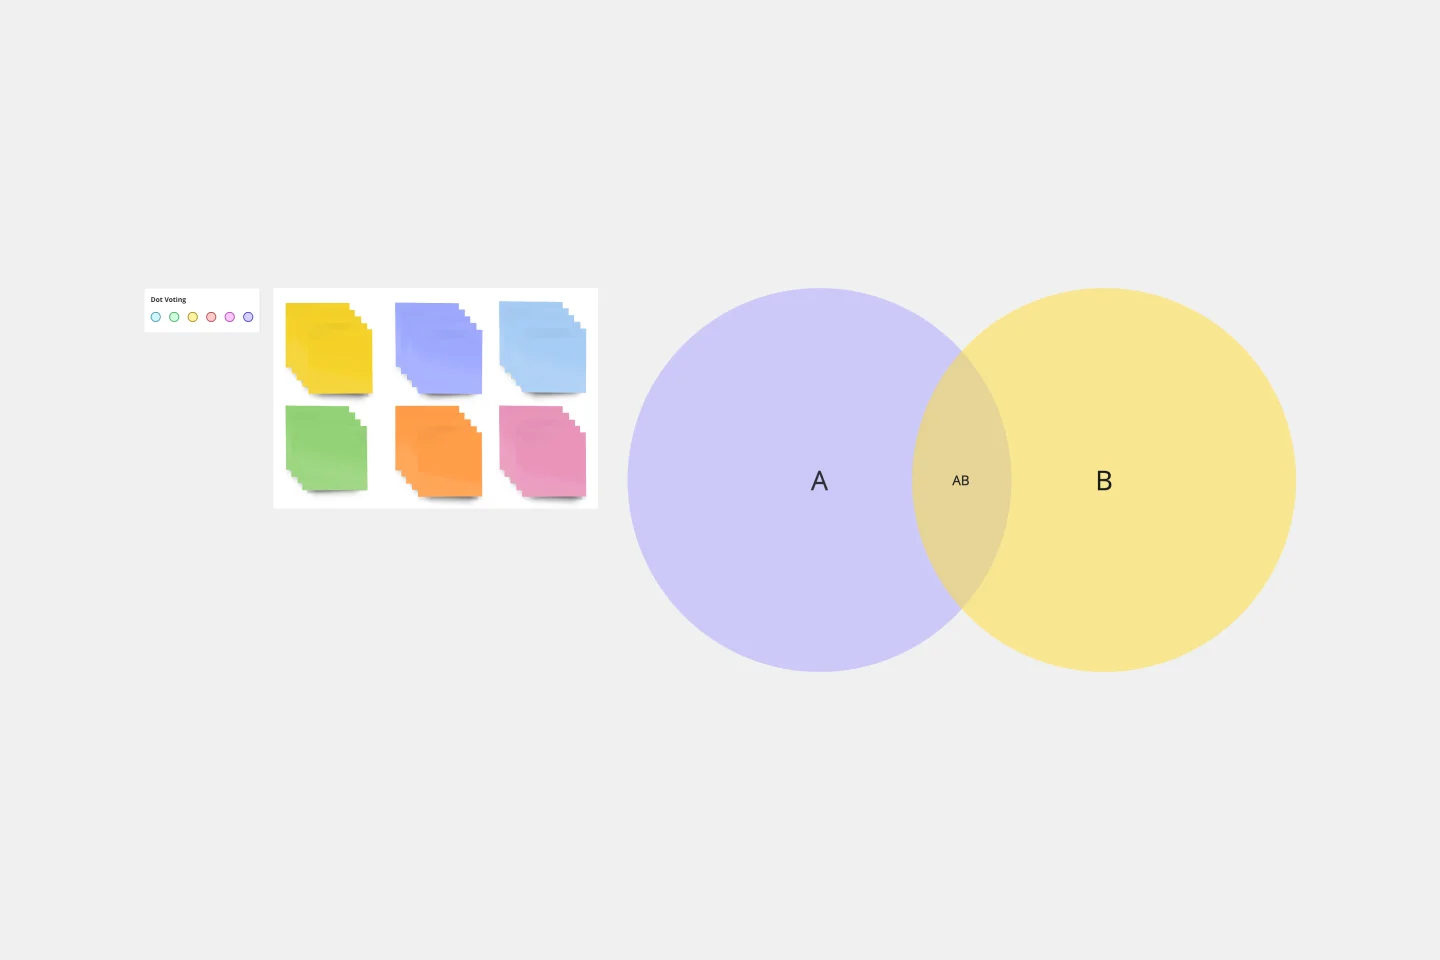
2-Circle Venn Diagram Template
The 2 Circle Venn Diagram Template is a dynamic, intuitive tool designed to represent the logical relationships between two data sets visually. For teams, this template proves valuable in enabling efficient collaboration, clear communication, and shared understanding.
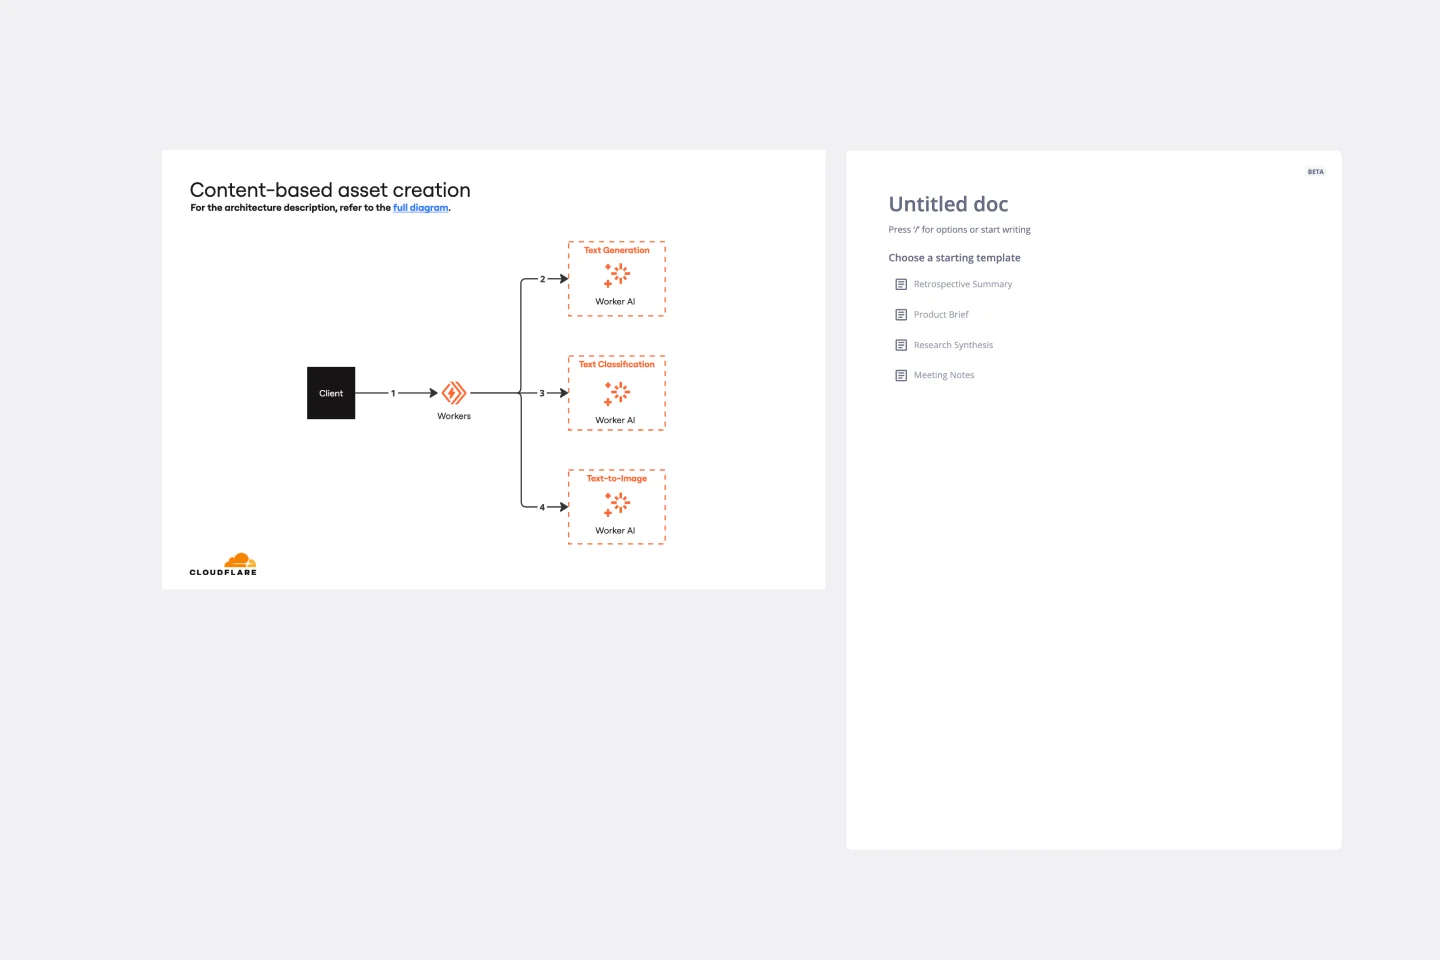
Cloudflare Content-based Asset Creation Template
The Cloudflare Content-based Asset Creation Template enhances efficiency and collaboration within teams working on cloud infrastructure projects. This template provides a structured and intuitive framework for creating and managing digital assets, which streamlines the asset creation process.