Data Flow Diagram Template
Model processes and map data flows efficiently with the data flow diagram template. Improve internal processes and lead development teams with more clarity.
Available on Enterprise, Business, Education plans.
About the Data Flow Diagram Template
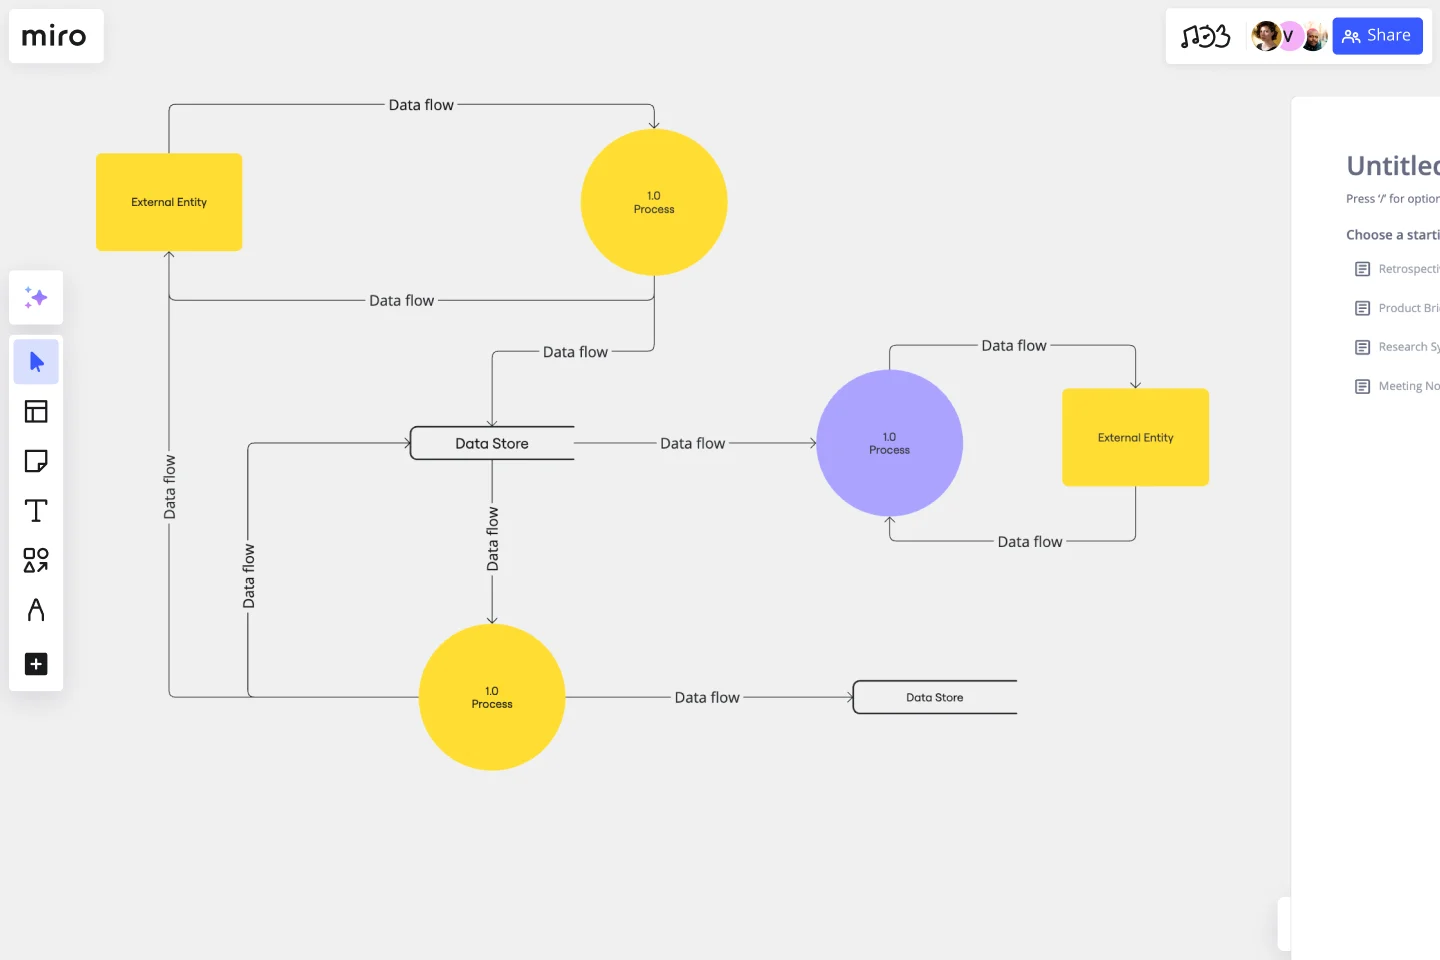
The data flow diagram template is a visual tool you can use to improve your understanding of how data travels within a system — namely by visualizing the inputs, outputs, and the processes involved. Organizations use data flow diagrams (DFD) in many business activities, including depicting notation styles, physical requirements, and system automation.
We’ll walk you through how you can start creating a data flow diagram using Miro’s free and customizable DFD template.
How to use Miro’s data flow diagram template
To get started with Miro’s data flow diagram template, scroll to the top of this page and click on the blue “use template” button. That’ll open the template and allow you to start using Miro’s diagram maker. Once you’ve opened it, think about what type of system you’re trying to visualize — whether it’s a business process, data flow within a software application, or something else. When you’re ready, here are a few more steps to make the most of the data flow diagram template.
1. Identify inputs and outputs
Each process you aim to map out should have at least one input and one output. This helps make sure that your DFD template is complete and has no loose ends. Look for the two blue, rounded rectangles on the left and right of the DFD template marked “external entity,” then edit the text boxes within them to label where the data is entering the system from and where it’ll go. To add more input and output sources, right-click on the rectangle and choose “Duplicate.”
2. Identify processes
On the data flow diagram template, the three circles labeled “Process” are for you to identify the activities or functions that manipulate data in some way. Edit the text boxes to add your system’s processes, and easily delete or duplicate these circles as needed.
3. Identify data stores
There are two symbols on the template labeled “data store.” As its name implies, it refers to where the system stores its data. Double-click on the text boxes to edit them and replace the text with how you want to label your data stores. Duplicate these symbols as needed, and click and drag them if you’d like to adjust their position on the diagram.
4. Label data flows
Last but not least, don’t forget to visualize the flow of data. The template comes with arrows connecting inputs, outputs, processes, and data stores. Edit the text along these arrows to identify the type of data that’s traveling, and click and drag them to adjust the direction of flow appropriately.
Is Miro’s data flow diagram template free?
Yes, Miro’s data flow diagram template is free and fully customizable, so you can make it your own. Just click on the blue “use template” button on this page to get started.
Who is Miro’s data flow diagram template for?
Miro’s data flow diagram template is for any team involved in system development, analysis, optimization, and collaboration — including data analysts, software development teams, growth teams, and product teams.
What’s the difference between a data flow diagram and a flowchart?
A data flow diagram is your guide to understanding the nitty-gritty of how information travels within a system — such as databases, software applications, and business processes. While a flowchart also visualizes flows, it isn’t limited to representing data. Flowcharts are versatile maps that outline processes, decisions, and actions much more broadly. Miro's free data flow diagram template is specially crafted to visualize the intricacies of data flow within complex systems.
Get started with this template right now. Available on Enterprise, Business, Education plans.
Fishbone RCA
Works best for:
Problem solving, Strategy
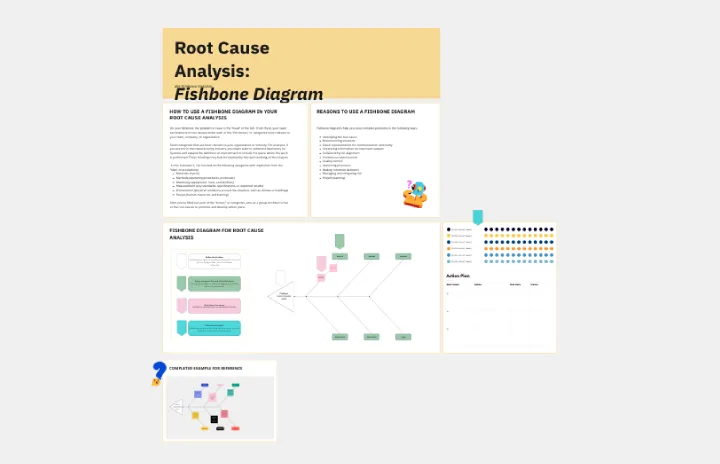
Use the Fishbone RCA template to conduct a thorough root cause analysis (RCA) for any problem. This template helps you break down complex issues into manageable categories, enabling you to identify the underlying causes. It's an effective tool for improving processes, solving problems, and preventing future issues.
UML Class Diagram by Dmitry Ermakov
Works best for:
Customer Journey Map
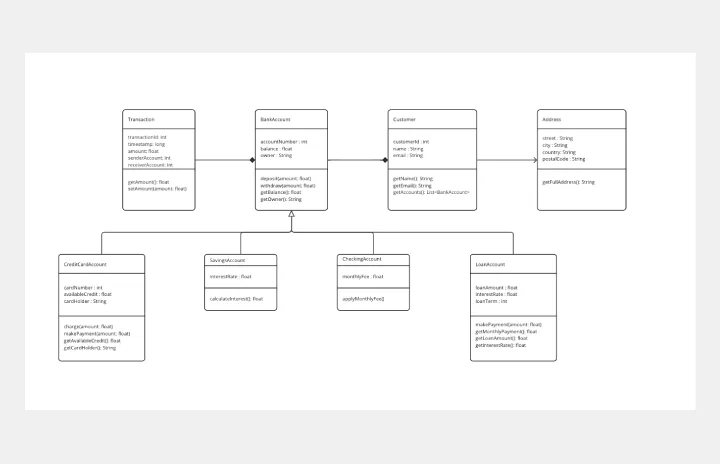
A UML (Unified Modeling Language) Class diagram is a visual representation that shows the structure and relationships of classes in a system or software application.
666 Roadmap Template
Works best for:
Strategic Planning, Product Management
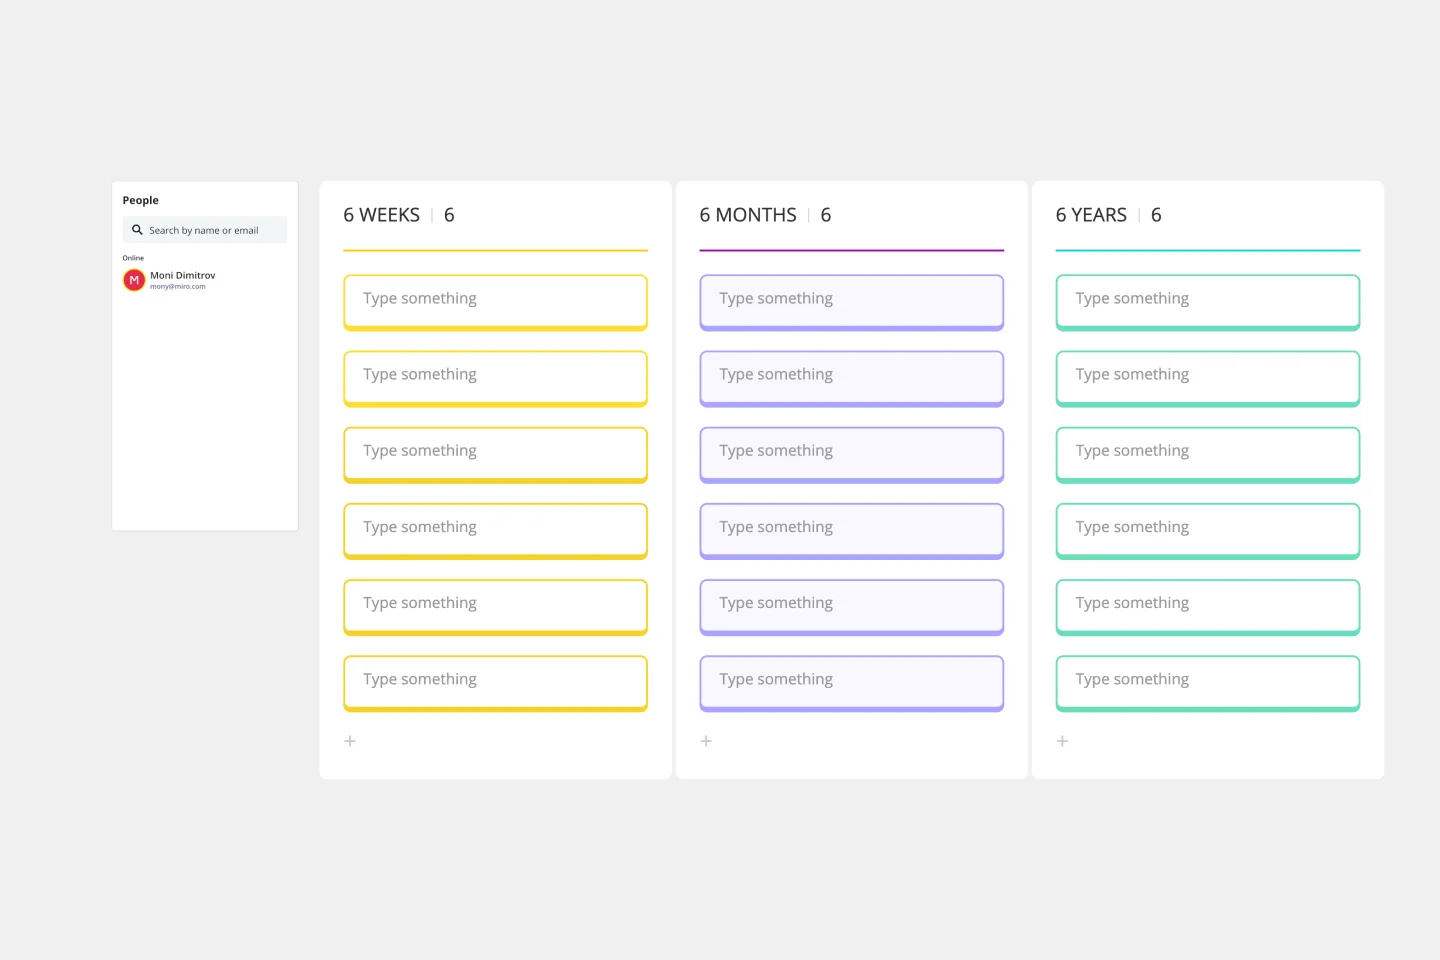
For most companies, especially startups, it’s important to keep two perspectives in mind when planning for the future: your plan and your vision. Your plan is a close-up view of what you want to accomplish in the near future, while your vision provides a zoomed-out view of what you hope to accomplish in the long term. The 666 Roadmap encourages you to plan for the future by thinking about the next 6 years, 6 months, and 6 weeks. Use this roadmap to strategize, think about what you want to build, and focus on a concrete plan for the upcoming quarter.
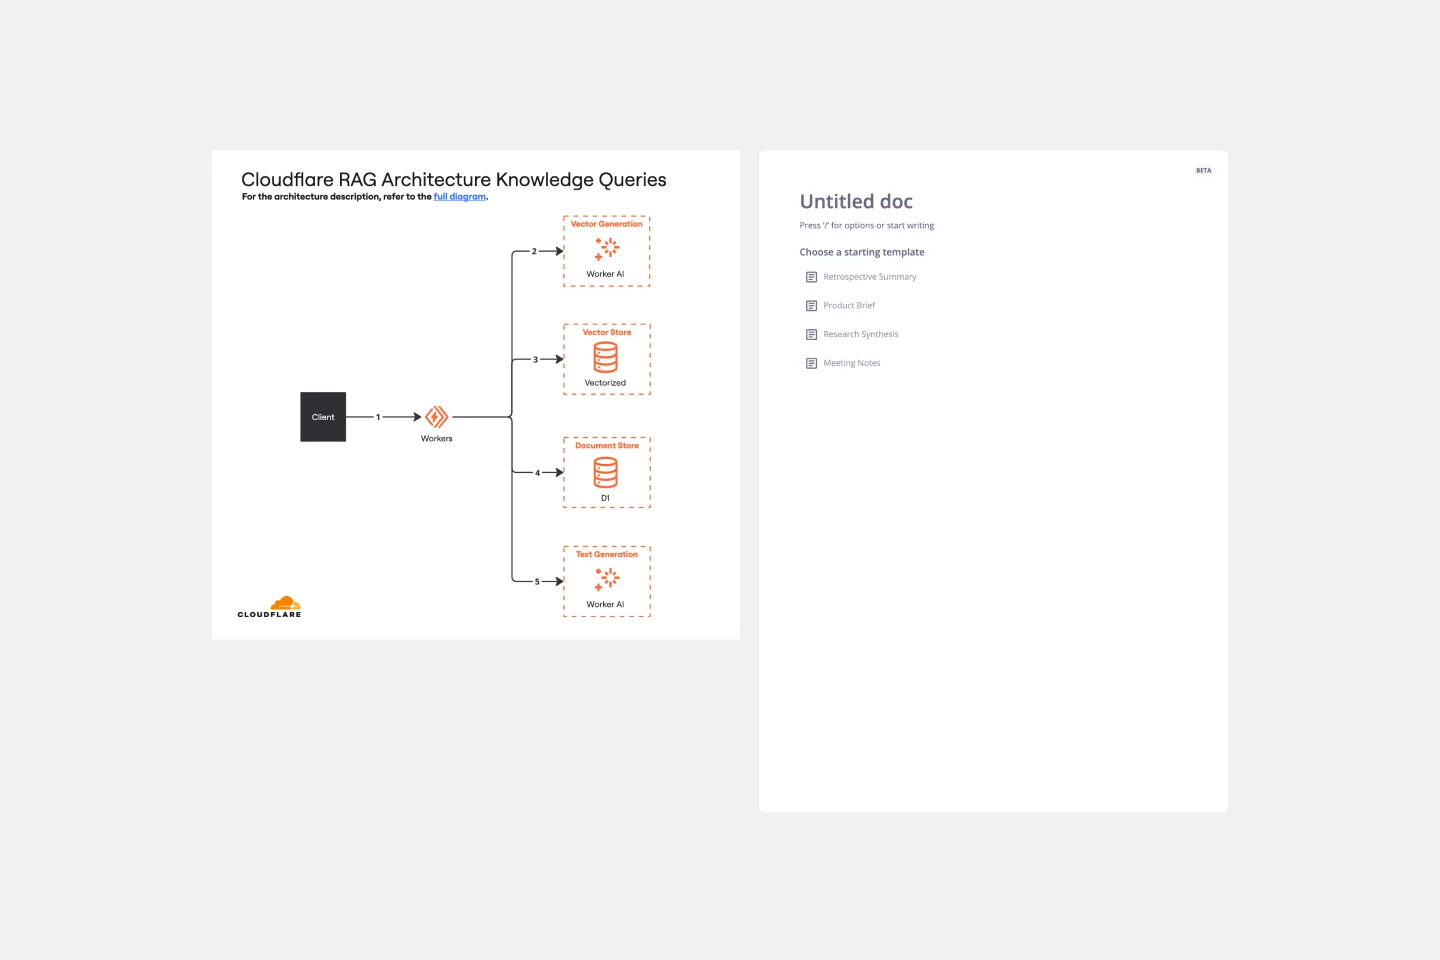
Cloudflare RAG Architecture Knowledge Queries Template
The Cloudflare RAG Architecture Knowledge Queries template is a cutting-edge tool designed to streamline the process of diagramming and understanding the intricate architecture of Cloudflare's Retrieval Augmented Generation (RAG) system. This template is a boon for teams aiming to visualize, query, and optimize Cloudflare's infrastructure collaboratively.
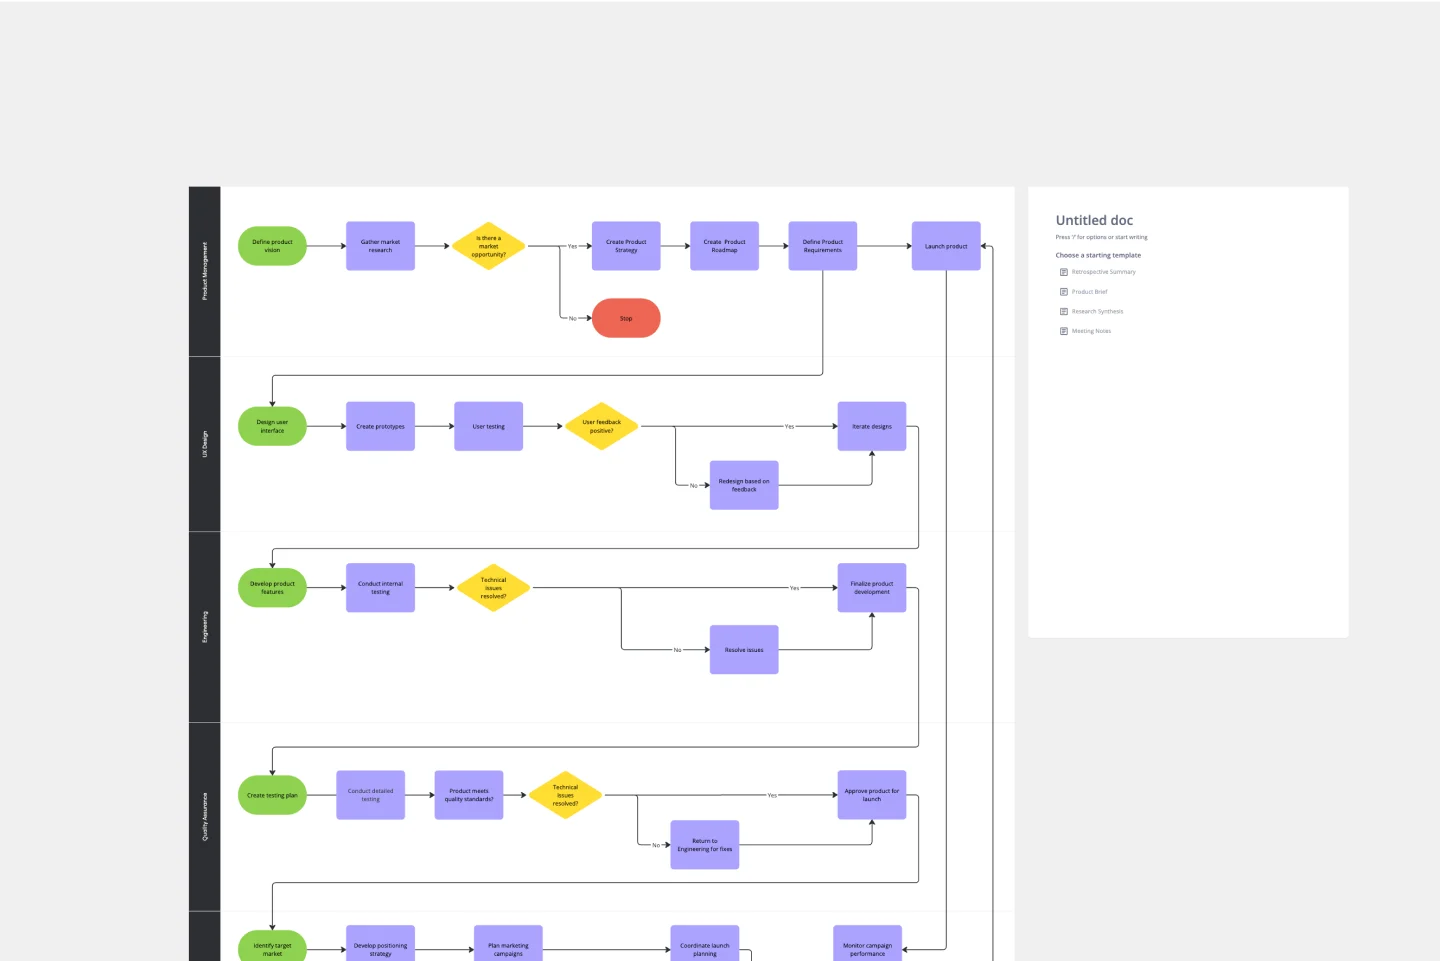
Product Development Process Flowchart Template
The Product Development Process Flowchart Template is a strategic tool designed to guide teams through the intricate journey of bringing a new product to market. This template serves as a visual roadmap, outlining each critical step in the product development lifecycle, from initial concept and design to testing, refinement, and eventual launch. It's structured to foster clarity, ensuring that all team members are aligned and aware of their roles and responsibilities at every phase.

20/80 Process Diagram - EOS Compatible
Works best for:
Diagramming
The 20/80 Process Diagram - EOS® Compatible template is a visual tool for mapping out processes and workflows aligned with the Entrepreneurial Operating System (EOS®) methodology. It provides a structured framework for identifying core processes and key activities that drive business outcomes. This template enables organizations to streamline operations, clarify roles and responsibilities, and enhance accountability. By promoting alignment with EOS® principles, the 20/80 Process Diagram empowers teams to achieve organizational excellence and drive sustainable growth.