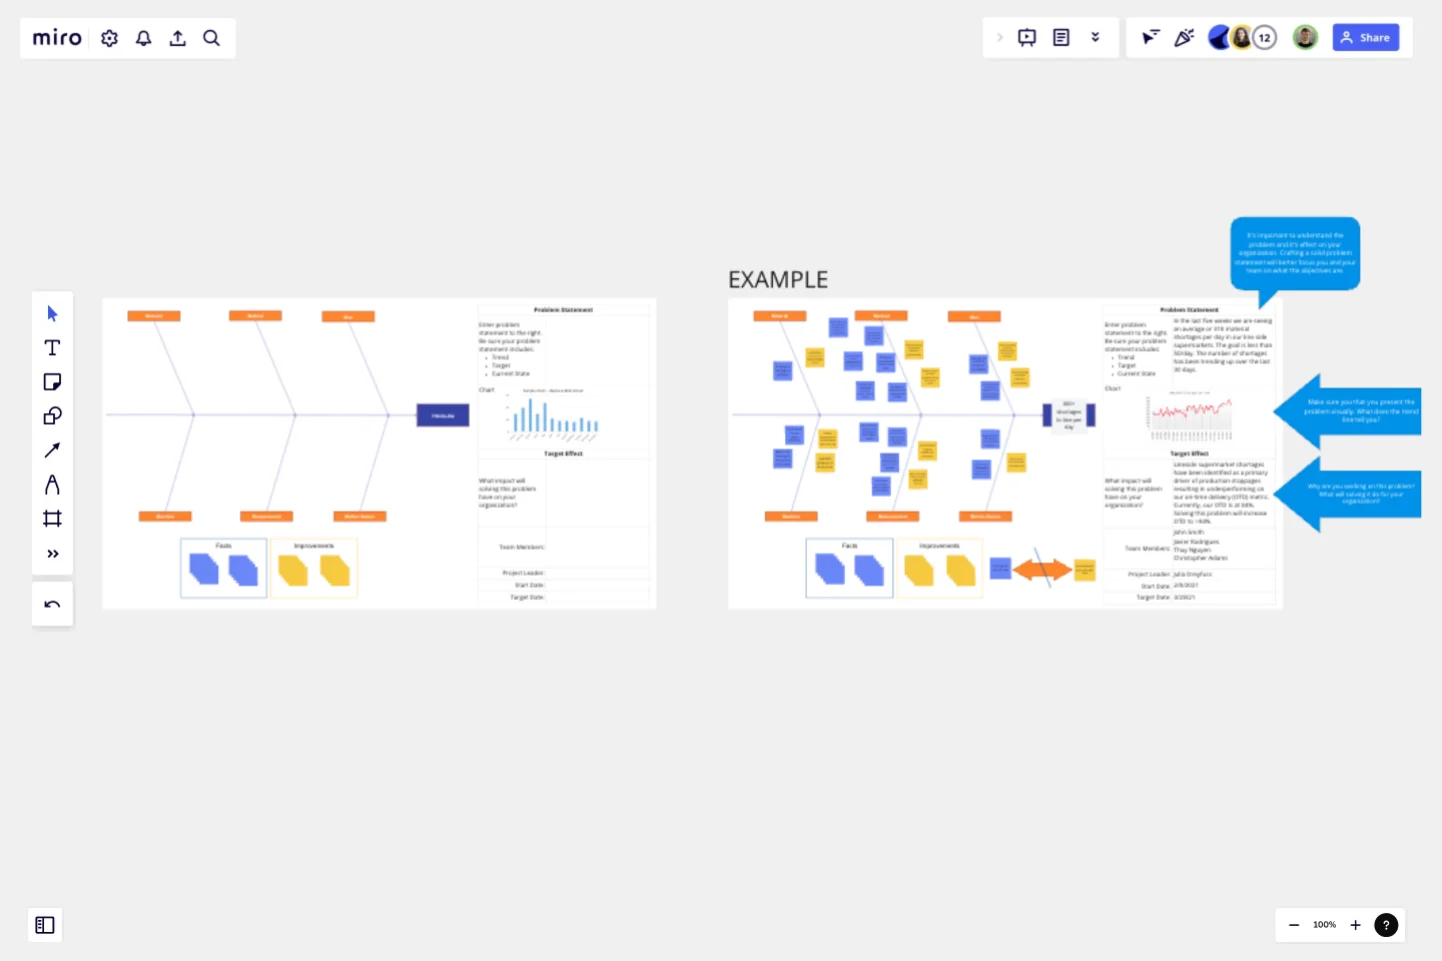
Crowd Sourced Cause and Effect
CEDAC stands for Cause and Effect Diagram with the Addition of Cards.
To many, CEDAC is a fishbone diagram with ribs that contain issues on one side of the rib and solutions on the other. But really, it was intended to be more than that. It’s inventor, Fukuda won a Deming Prize for its development. To him, CEDAC was a management technique. So, unlike many other techniques used by practitioners of lean that assume the answer/solution can be created from what is already available, Fukuda’s CEDAC can spawn experiments and research to gain better understanding.
The CEDAC tool is highly diverse and can be used to visualize and problem solve across a wide variety of issues. You can use it to understand issues with new product development, to discern why certain software features are not working as intended, to define possible failure modes in product design, or to comprehend why your accounts receivable backlog is growing (just to name a few). Perhaps the most interesting applications come in defining obstacles where the problem is “created” and the solution is not readily apparent. Created problems don’t necessarily look back historically at what happened to get us here but define a future state not yet achieved. Utilizing CEDAC it’s possible to visualize obstacles that must be overcome before reaching our defined target. These targets could be driven by a desire to increase market share, launch a new business, increase our customers spend per transaction, the list really goes on and on.
Using this tool in Miro you have the ability to gain insights from far more resources than what is available to you with a physical board. Perhaps you can make the board public and get insights from other industry professionals via a post of your favorite social media outlet. Or, you can imbed the board into a collaboration space that you use frequently and challenge your team members to add a number of cards throughout their workday. Think of the possibilities for crowdsourcing solutions!
This template was created by NEXT LEVEL Partners.
Get started with this template right now.
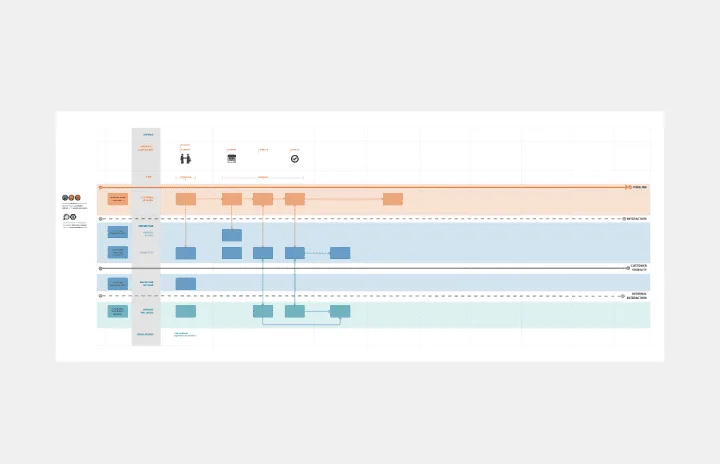
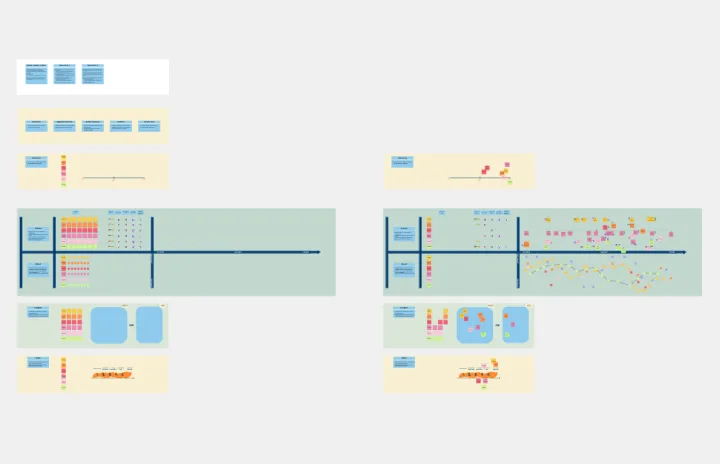
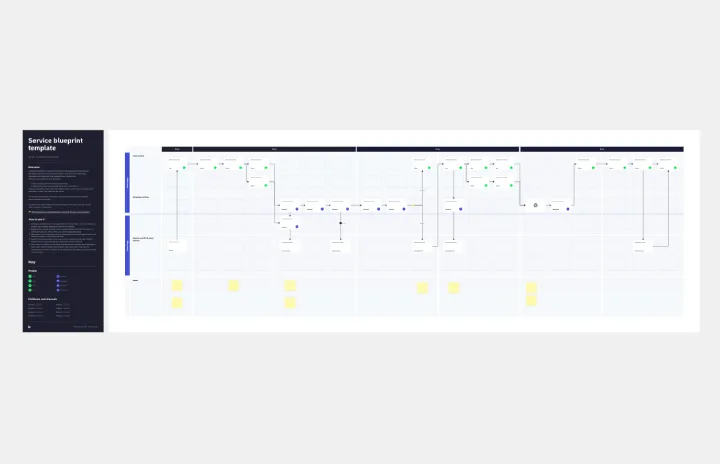
Service Blueprint by Edmond Gozo
Works best for:
Diagramming
The Service Blueprint template is a visual tool for designing and optimizing service experiences. It provides a structured framework for mapping customer journeys, identifying touchpoints, and aligning internal processes. This template enables teams to visualize the entire service ecosystem, uncover pain points, and innovate solutions to enhance customer satisfaction. By promoting customer-centricity and collaboration, the Service Blueprint empowers organizations to deliver exceptional service experiences and drive sustainable growth.
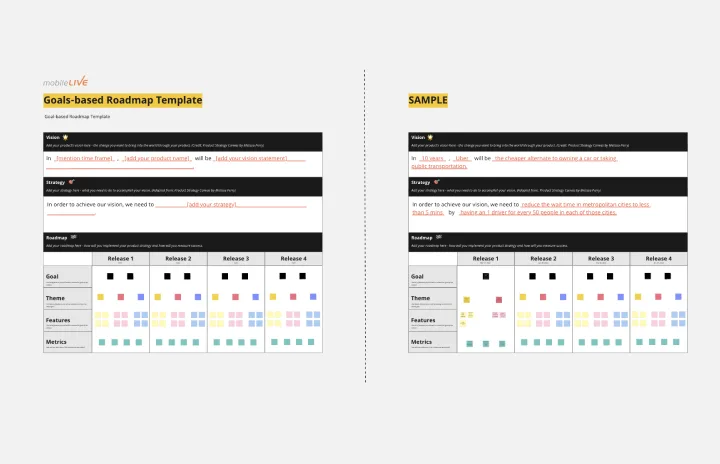
Goals-based Roadmap
Works best for:
Roadmap, Planning, Mapping
The Goals-based Roadmap template enables teams to set clear objectives and chart a course for achieving them. By defining specific goals and milestones, teams can track progress and adapt their strategies accordingly. This template fosters accountability and transparency, ensuring that everyone is working towards common objectives. With a focus on outcomes, teams can prioritize initiatives that drive the greatest impact and value.
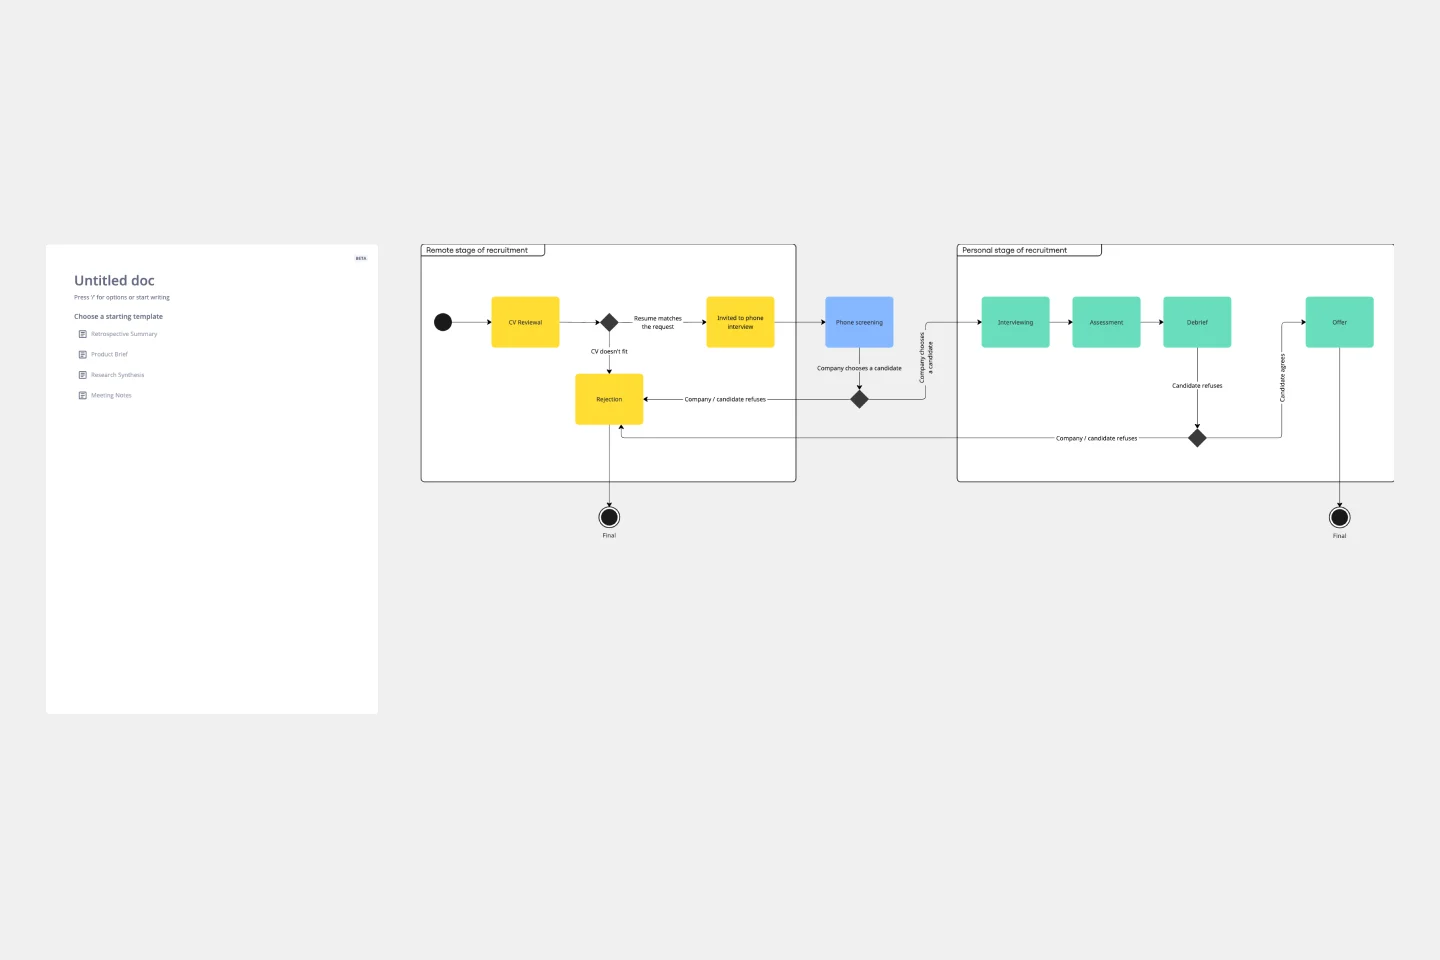
UML State Machine Diagram Template
Works best for:
Software Development, Mapping, Diagrams
Visualize the workflow of a process and how objects perform actions based on different stimuli. State machine diagrams are valuable for understanding how an object responds to events at the different stages of its life cycle. They are also helpful for visualizing event sequences in a system.
Timeline-Retrospective
Works best for:
Timeline, Planning
Use the Timeline Retrospective template to review project progress and outcomes. It’s ideal for identifying what worked well and what didn’t, facilitating continuous improvement. This template helps teams reflect on their performance and make informed decisions for future projects.
Service Blueprint by Hyperact
Works best for:
Research & Design
The Service Blueprint template is perfect for visualizing the orchestration of service components. It maps out frontstage and backstage elements, helping you analyze and enhance customer experiences. Use this template to align teams, identify pain points, and streamline processes, ensuring a seamless service delivery. It's ideal for creating a shared understanding of service dynamics among stakeholders and collaborators.
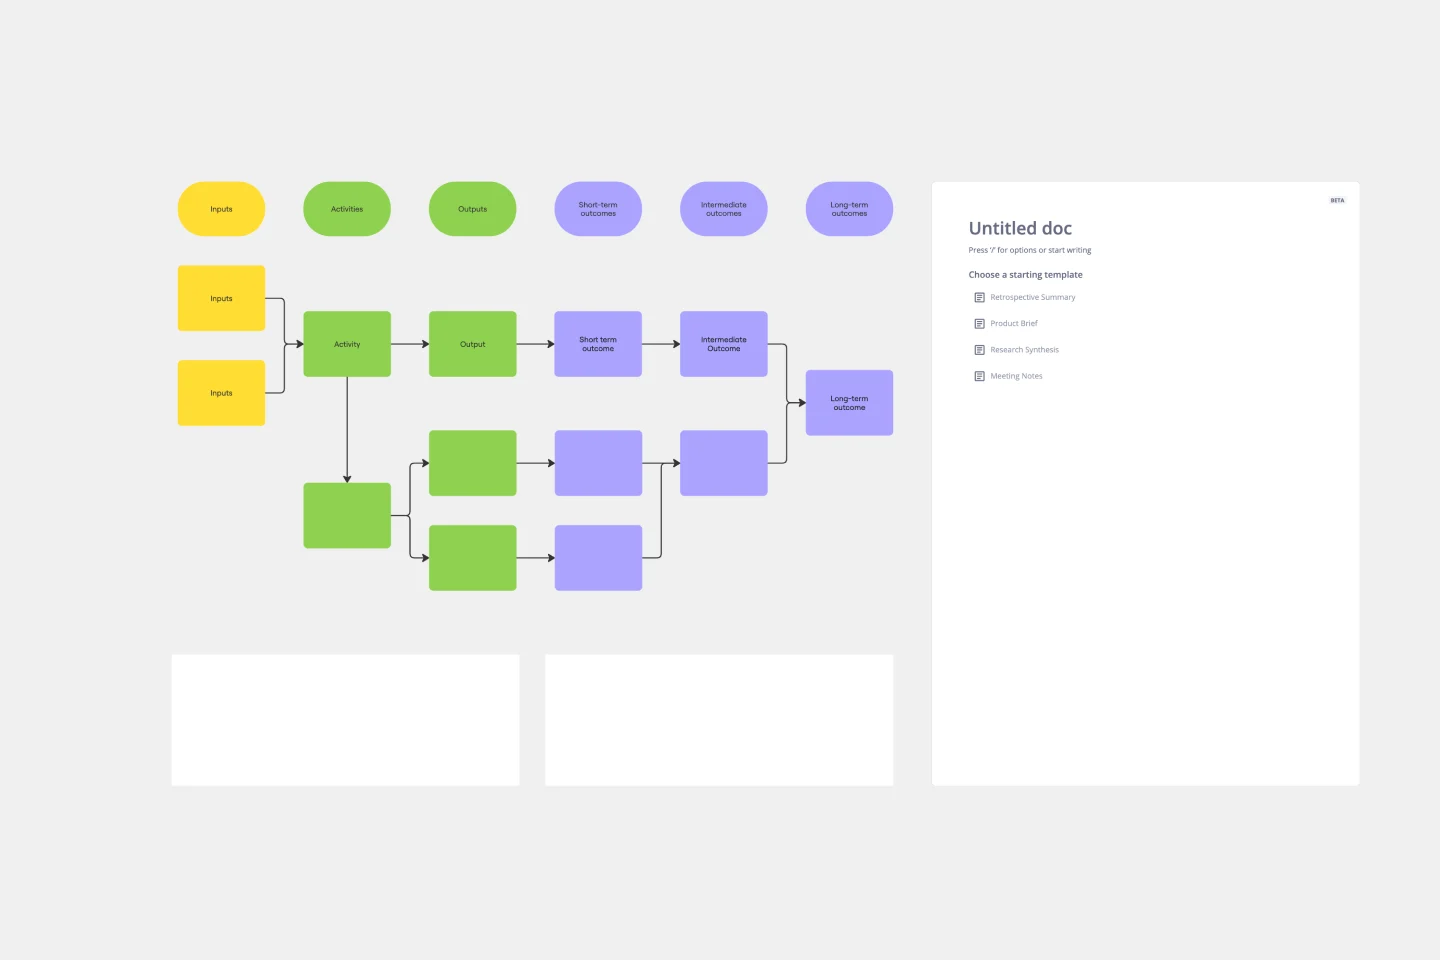
Logic Model Template
Works best for:
Diagramming
The logic model template is a strategic visual tool designed to delineate the relationship between a program's inputs, activities, outputs, and outcomes. By providing a clear and comprehensive map of the project lifecycle, stakeholders can swiftly grasp the intricate connections within a given initiative. One standout benefit of this template is its ability to enhance clarity: by visually representing the transformation of resources into anticipated results, teams can ensure more efficient and targeted use of their resources, thus maximizing the potential for success in their endeavors.