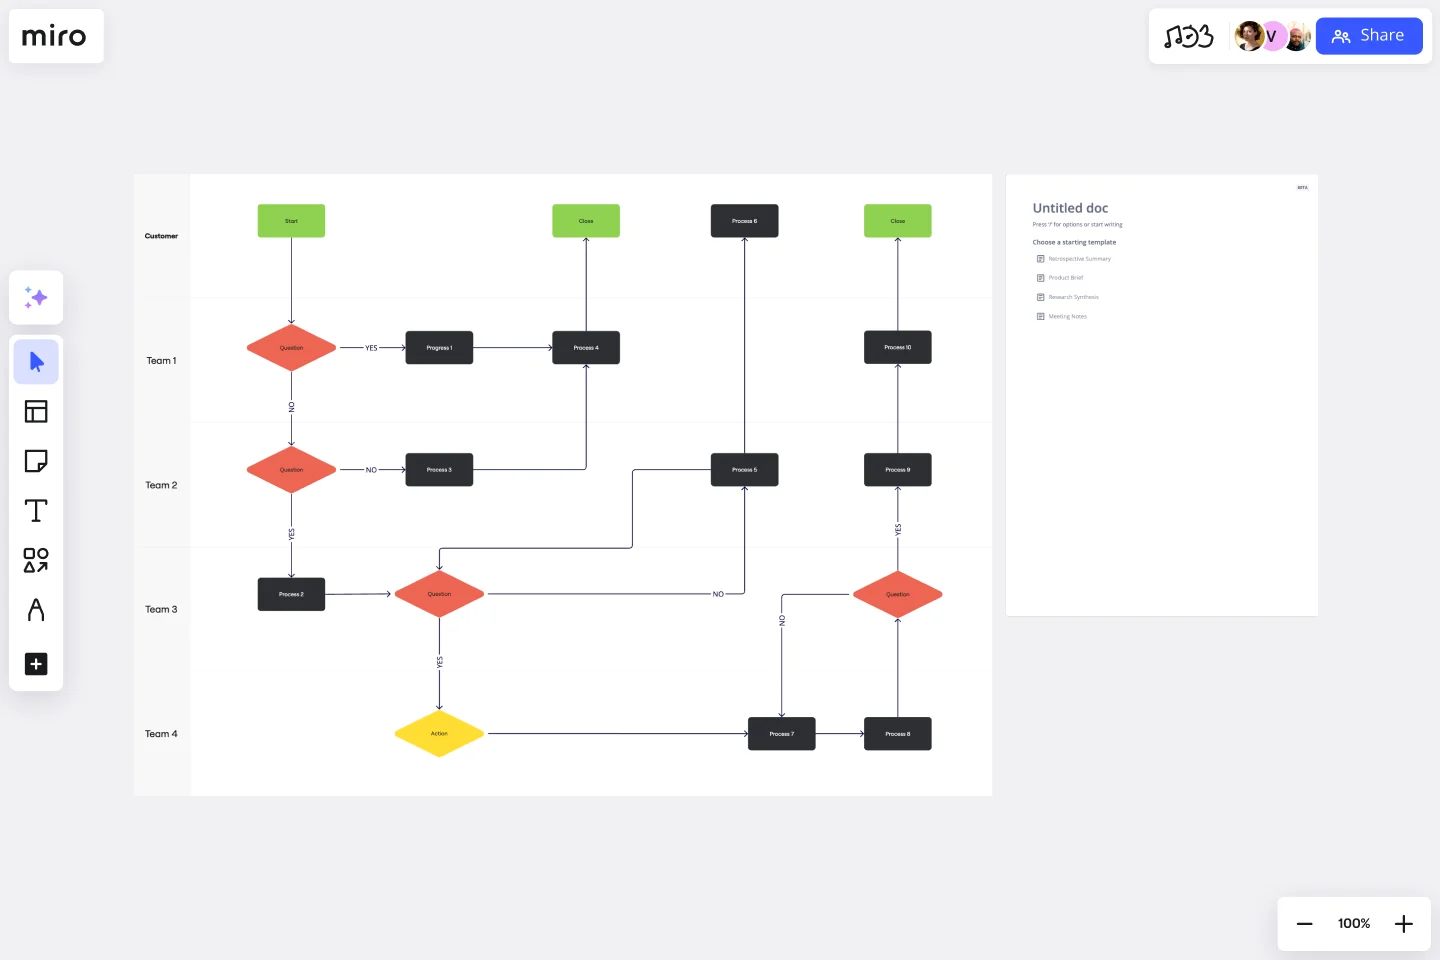
Cross Functional Flowchart
Plan for any undesirable actions, outcomes, or behaviors that occur in the workplace. Clarify different team responsibilities and identify bottlenecks using a Cross-Functional flowchart.
About the Cross-Functional Flowchart
Cross-functional flowcharts (also known as a “swim lane diagram” or “cross-functional process map” ) can help you visualize business relationships and end-to-end project contributions. These elements that depend on each other can include the relationship between functions and stakeholders (such as departments and clients) or project phases and milestones.
The map format allows you to make your business processes or project phases more transparent with added layers of detail and structure.
Keep reading to learn more about cross-functional flowcharts.
What is a Cross-Functional flowchart?
A cross-functional flowchart shows how people from different teams contribute to, and complete, a business process or project.
The lanes in the chart can help separate and clarify which department, employee, or person outside of the business contributes to a business or project.
Each person (such as a customer, client, or representative from a specific function) who contributes to the big-picture process is assigned a lane. That assigned area outlines all the activities they are responsible for moving forward to the finish line.
When to use a Cross-Functional flowchart
Cross-functional flowcharts can be used to improve your team and organizational processes. These changes can include the need to work out what factors create inefficiencies and address delays that impact both internal and external stakeholders.
A cross-functional flowchart can also help different teams or departments better understand each other’s responsibilities and capabilities. These details are especially useful when people haven’t worked together before or struggle to understand what different teams do on a day-to-day basis. Consistently collaborating with an online flowchart creates greater transparency and alignment.
Create your own Cross-Functional flowchart
Making your own cross-functional flowchart is easy. Miro’s virtual collaboration platform is the perfect flowchart maker and canvas for sharing them. Get started by selecting the Cross-Functional Flowchart Template, then take the following steps to make one of your own.
1. Decide what your lanes are.
Decide what divisions (functions) or identities (internal or external stakeholders) need representation on the flow chart.
2. Define what the start of your process is.
What’s the first action that triggers a series of tasks or interactions? Maybe it’s a client confirmation or a customer request. Each division will have a different starting point, but you’ll see that there may be points in the journey or interaction where functions or individuals coincidentally meet (or need to coordinate and communicate, for a smoother process to roll out).
3. Keep adding steps to your process until you get to the last step or endpoint.
What does the flow of information look like from start to finish? What decisions need to be made? Ask yourself and your team these questions as you map out each situation. Try to convert your quick sketches to sticky notes, shapes, and connecting lines that work together to create a logical flow chart.
4. Update your flow chart as needed—and use it alongside other process-based templates.
Cross-functional process maps were designed to work alongside – or be connected to – other templates, such as a product roadmap or stakeholder mapping tool. Rally your teammates, stakeholders, and leadership team around a people-first vision by helping them see the bigger picture alongside the all-important details.
Get started with this template right now.
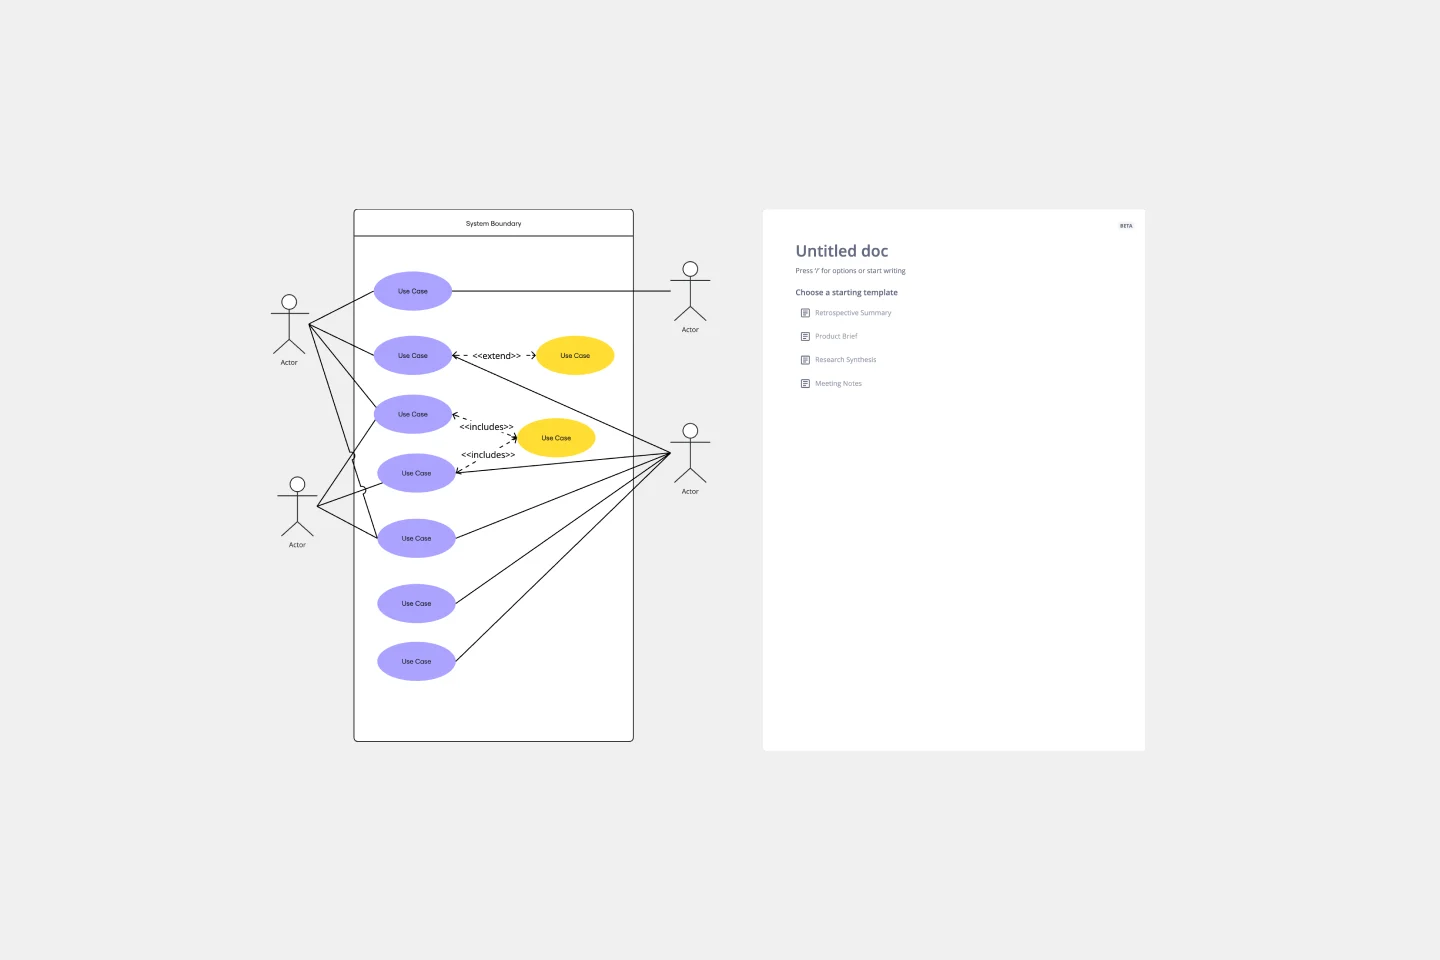
Use Case Diagram Template
Works best for:
Marketing, Market Research, Diagrams
A use case diagram is a visual tool that helps you analyze the relationships between personas and use cases. Use case diagrams typically depict the expected behavior of the system: what will happen and when. A use case diagram is helpful because it allows you to design a system from the perspective of the end user. It’s a valuable tool for communicating your desired system behavior in the language of the user, by specifying all externally visible system behavior.
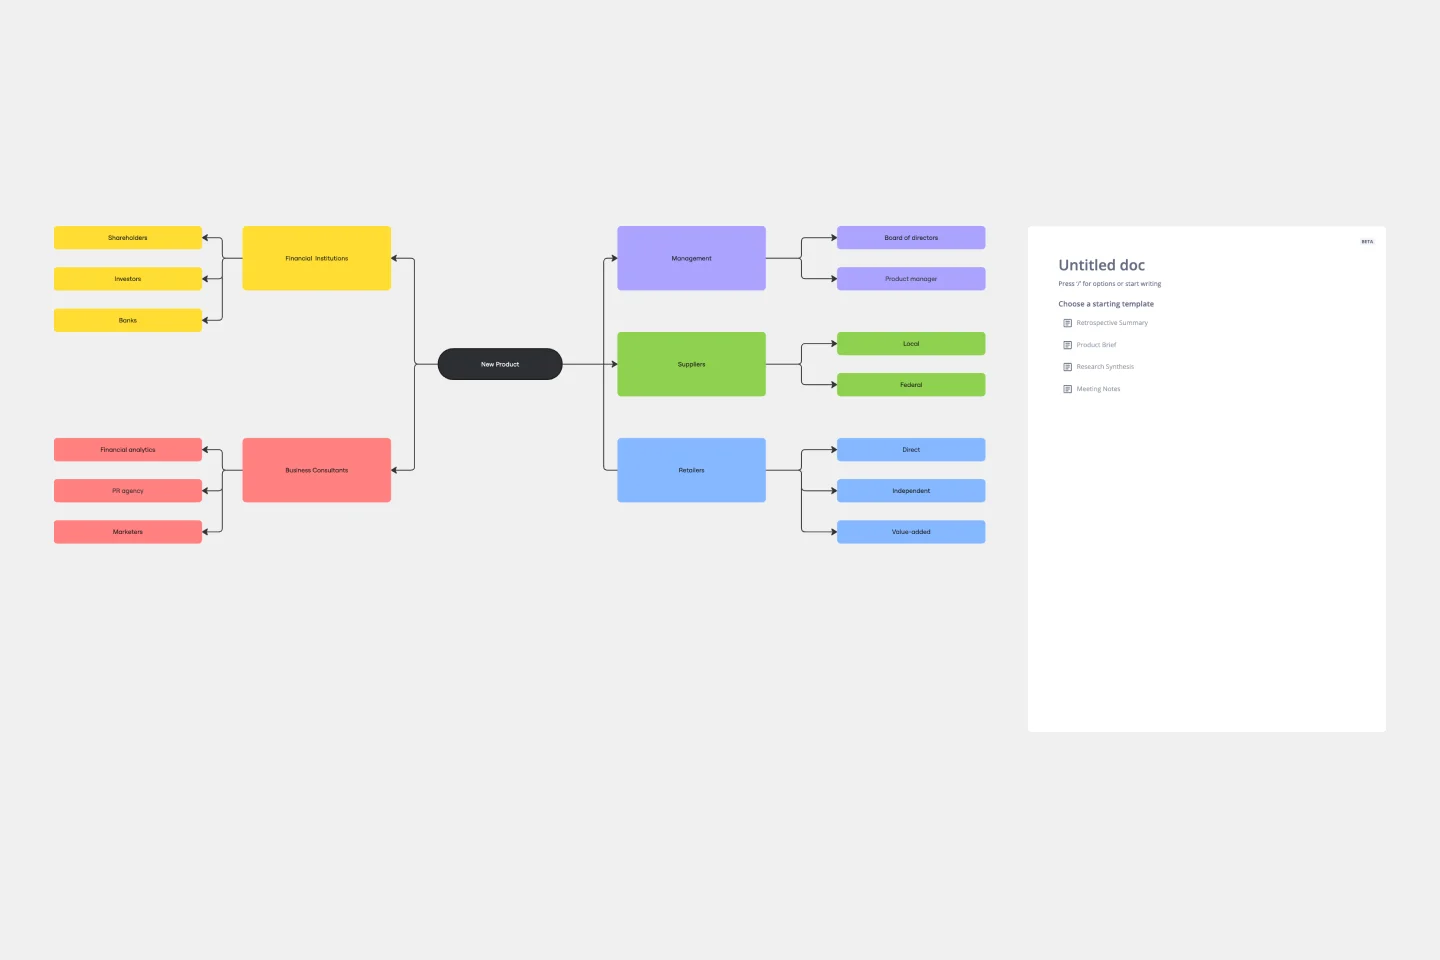
Stakeholder Mapping Template
Works best for:
Business Management, Mapping, Workflows
A stakeholder map is a type of analysis that allows you to group people by their power and interest. Use this template to organize all of the people who have an interest in your product, project, or idea in a single visual space. This allows you to easily see who can influence your project, and how each person is related to the other. Widely used in project management, stakeholder mapping is typically performed at the beginning of a project. Doing stakeholder mapping early on will help prevent miscommunication, ensure all groups are aligned on the objectives and set expectations about outcomes and results.
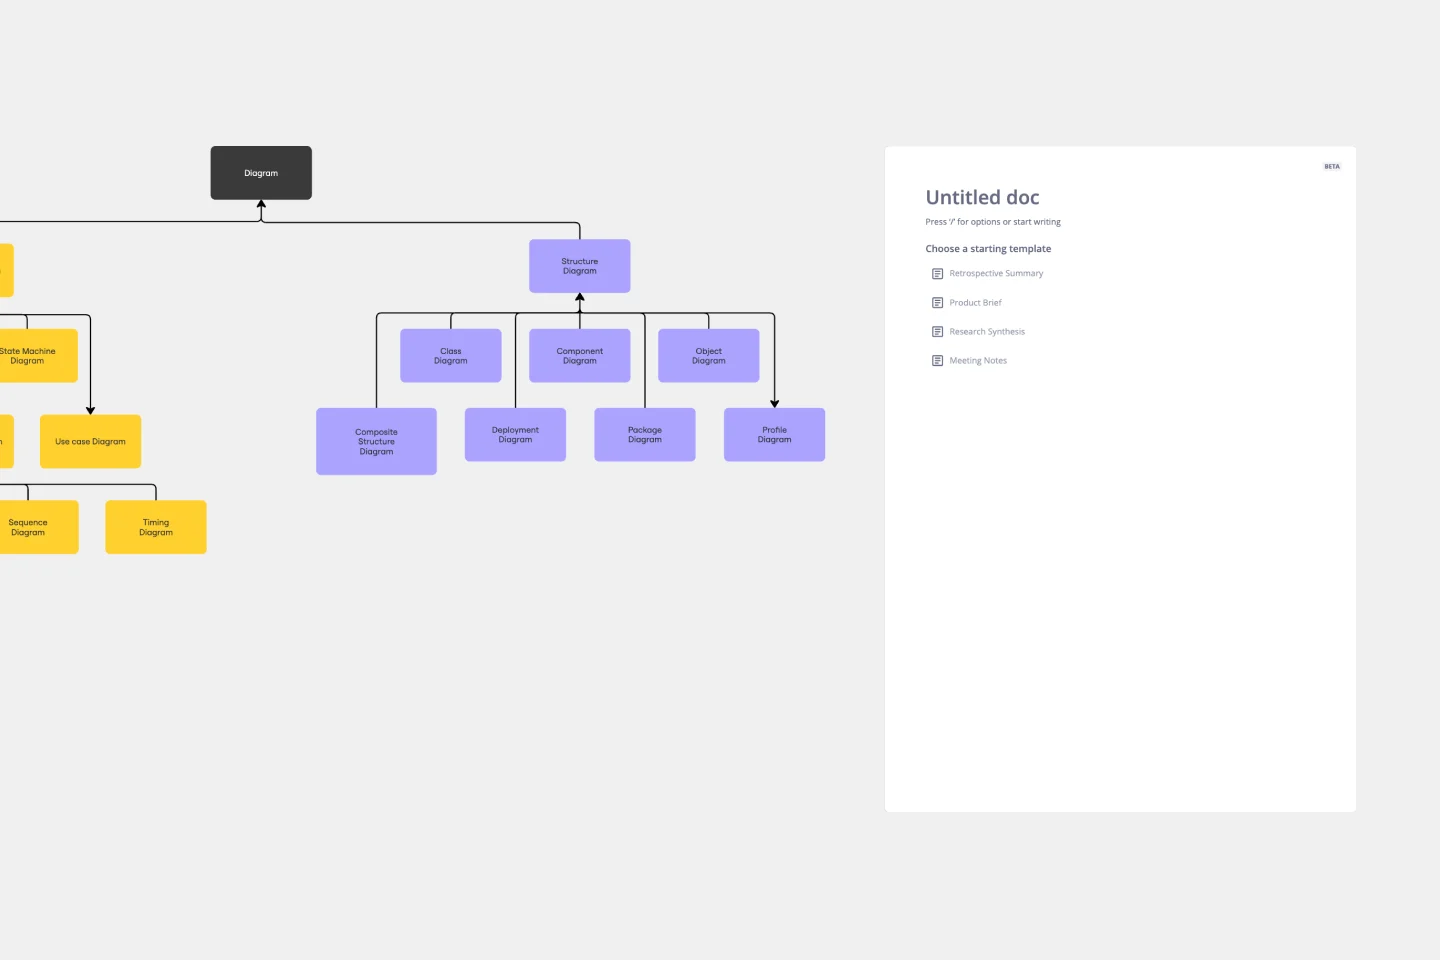
UML Class Diagram Template
Works best for:
UML Class Diagram Template, Mapping, Diagrams
Get a template for quickly building UML class diagrams in a collaborative environment. Use the UML class diagram template to design and refine conceptual systems, then let the same diagram guide your engineers as they write the code.
AHA! Moment Flowchart
Works best for:
Mapping, Flowcharts
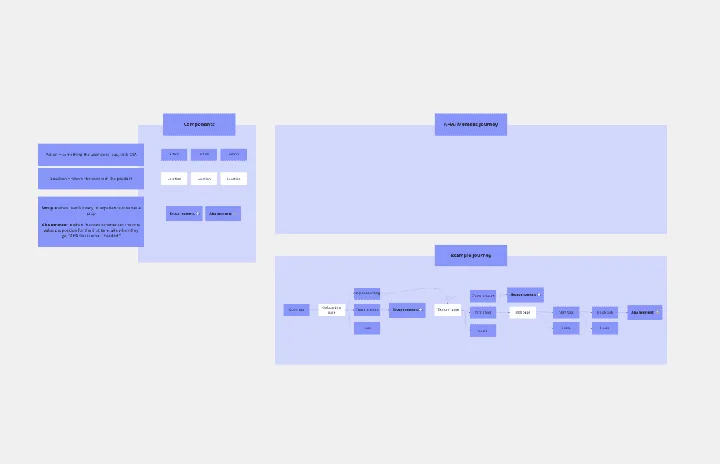
The AHA! Moment Flowchart template offers a visual tool for mapping out the journey of users or customers and identifying key moments of realization or insight (AHA moments). It provides a structured framework for documenting user interactions, emotions, and pain points throughout their journey. This template enables teams to understand user experiences, identify opportunities for improvement, and enhance product or service offerings. By promoting empathy and customer-centric design, the AHA! Moment Flowchart empowers organizations to create meaningful and impactful user experiences effectively.
Johari Window Model
Works best for:
Leadership, Meetings, Retrospectives
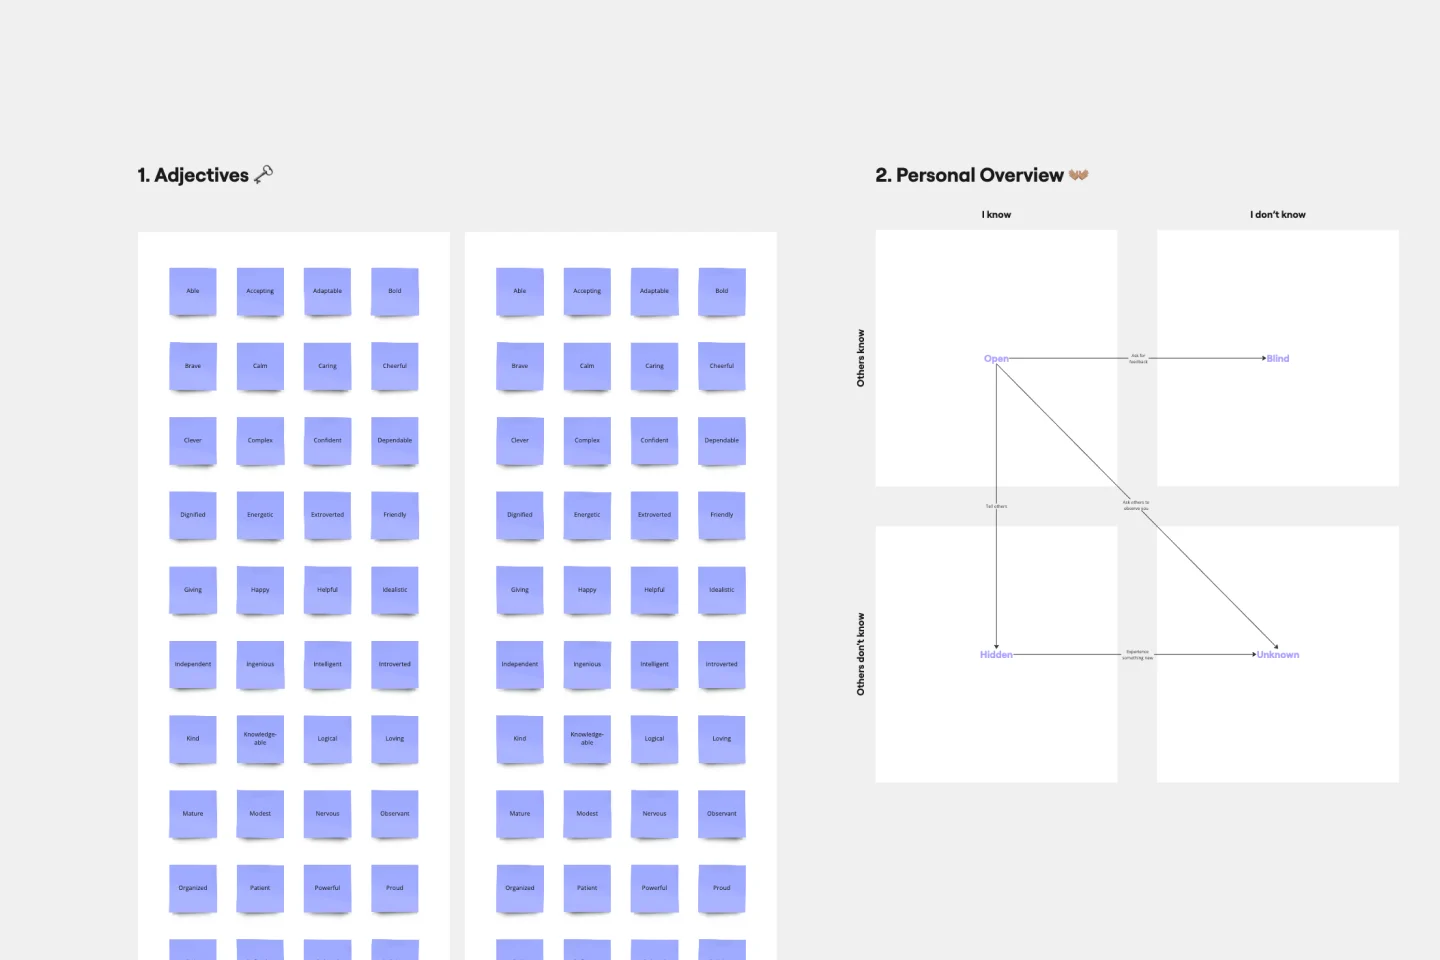
Understanding — it’s the key to trusting others better and yourself better as well. Built on that idea, a Johari Window is a framework designed to enhance team understanding by getting participants to fill in four quadrants, each of which reveals something they might not know about themselves or about others. Use this template to conduct a Johari Window exercise when you’re experiencing organizational growth, to deepen cross-functional or intra-team connections, help employees communicate better, and cultivate empathy.
Fishbone Diagram by Dave Westgarth
Works best for:
Fishbone diagram
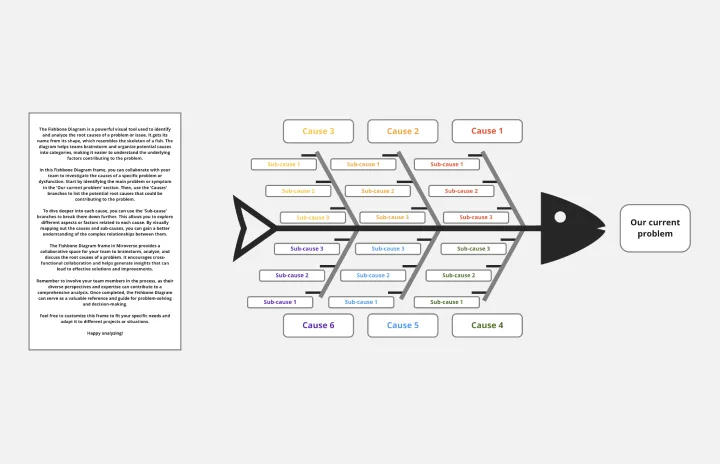
Identify and solve problems effectively with the Fishbone Diagram by Dave Westgarth. This template helps you break down complex issues into root causes, enabling a thorough analysis and targeted solutions. Use it for quality control, process improvement, and troubleshooting in various industries. Ideal for teams focused on continuous improvement and problem-solving.