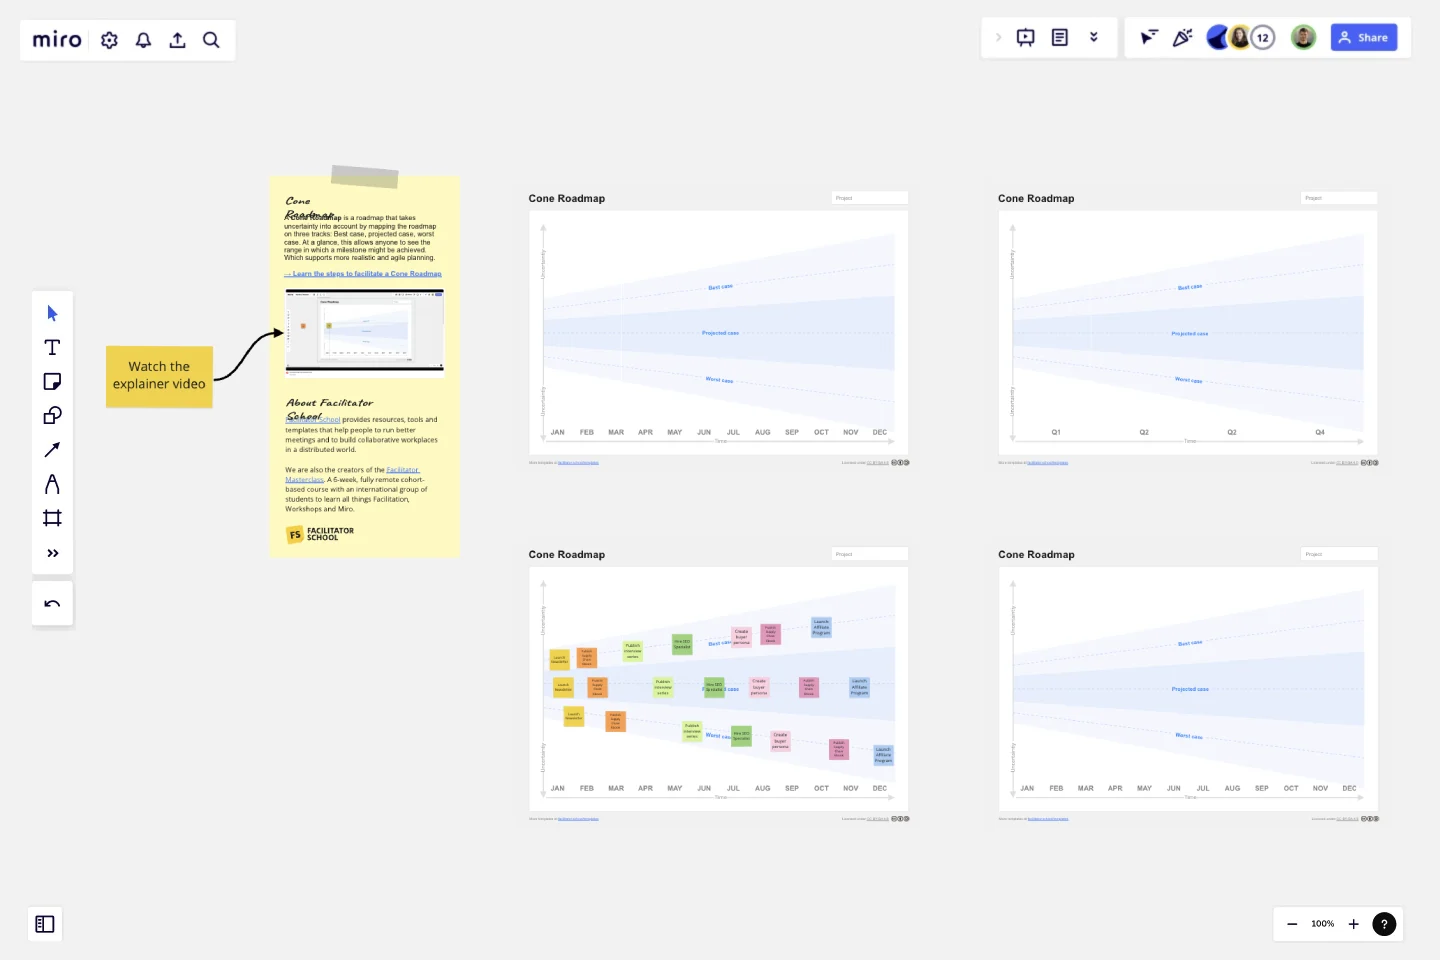
Cone Roadmap
A Cone Roadmap is a roadmap that takes uncertainty into account by mapping the roadmap on three tracks: Best case, projected case, worst case. At a glance, this allows anyone to see the range in which a milestone might be achieved. Which supports more realistic and agile planning.
How does the Cone Roadmap work?
Step 1: Map out the best case
Ask yourself "How would the roadmap look like, when everything goes well?". Given your answer, add the milestones to the top track that represents the best case for the roadmap. Where you place the milestones should be optimistic, but at the same time realistic and achievable.
Step 2: Map out the worst case
Ask yourself "How would the roadmap look like, when everything goes wrong?". Especially think about how long it might take to achieve a milestone. Now duplicate and place the same milestones on the bottom track to represent the worst case scenario.
Step 3: Map out the projected case
Given the best and worst case of the roadmap, you can now see a range for when each milestone might be achieved. As the last step, duplicate each milestone one last time and place it in the middle of the range. When you are done with all milestones, this creates an average between the two extremes and gives you the projected case.
This template was created by Facilitator School.
Get started with this template right now.
Agile Product Roadmap (Now, Next, Later)
Works best for:
Product Roadmap
Stay ahead in your product development with the Agile Product Roadmap Now Next Later template. This tool allows you to plan and prioritize features and improvements dynamically, ensuring your product evolves with market needs. Visualize short-term, mid-term, and long-term goals to keep your team focused and aligned. Perfect for product managers and agile teams aiming to deliver continuous value.
OKR Planning Template
Works best for:
Strategic Planning, Meetings, Workshops
The OKR Planning template helps you turn exhaustive OKR sessions into dynamic and productive meetings. Use this template to make OKR planning more interactive, guiding your team through the session with creative Ice Breakers and Brainstorms, so you can co-create your OKRs and define the key results and action plans to achieve them.
Opportunity Canvas Template
Works best for:
Leadership, Decision Making, Strategic Planning
Features and capabilities — they make or break a product, which is why companies spend so much time and effort focusing on them. Sound like you? Try it with an Opportunity Canvas. This streamlined one-pager gives you and your team the power to improve your product by exploring the use cases, potential setbacks, strategies, challenges, and metrics. An Opportunity Canvas is ideal if you’ve already built a product, because you don’t need to consider the operational or revenue model.
Event Planning Template
Works best for:
Planning, Workshops
Whether you’re planning a product launch, fully remote conference, or milestone event, the Event Planning Template will act as a visual checklist and map for all the details you need to consider before the big day. The Event Planning Template is an adaptable way to make sure the creative and strategic vision of your event doesn’t get lost in the details. By mapping out different sections - from the marketing plan, to the agenda, to snacks and swag for guests — you and your team can focus on the details most important to your functions, and collaborate as needed when overlaps occur.
Product Launch Lifecycle
Works best for:
Product Management, Planning
The Product Launch Lifecycle template guides product managers through the stages of launching new products. By outlining pre-launch, launch, and post-launch activities, this template ensures comprehensive product launch planning and execution. With sections for defining launch objectives, identifying target audiences, and tracking performance metrics, it facilitates coordinated efforts across marketing, sales, and product teams. This template serves as a roadmap for successful product launches, maximizing market impact and customer adoption.
Project Proposal Template
Works best for:
Project Management, Documentation, Project Planning
For any type of project, the Project Proposal template can be a crucial step toward clarifying the context, goals, and scope of a project to get stakeholder buy-in. A project proposal outlines what you want to accomplish, your goals, and how you plan to achieve them. Generally, a project proposal gives the reader some context on the project, explains why it is important, and lists the actions that you will take to complete it. Project proposals have myriad uses. Often, businesses use project proposals to get external buy-in from a donor or outside stakeholder. But many companies draw up project proposals for internal buy-in too.
