Cluster Diagram Template
Organize complex ideas and bring clarity to teams with the cluster diagram template.
About the Cluster Diagram Template
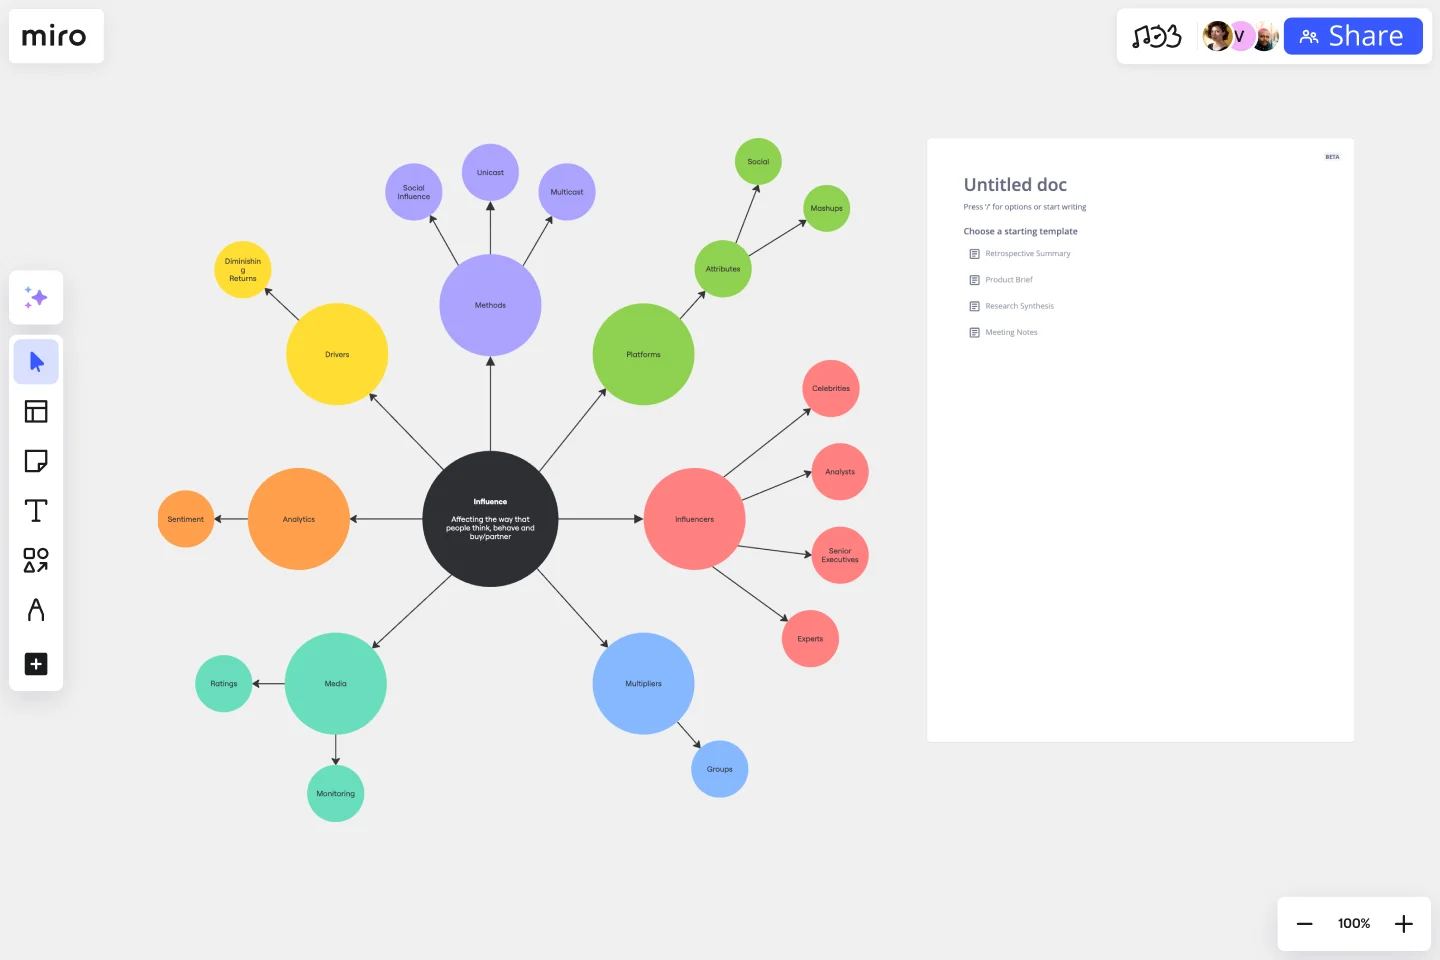
Unlock the potential of organized ideas with the cluster diagram template - a tool that brings structure to thoughts and processes. Essentially, this template is a method for visually grouping and comprehending complex ideas, information, or data sets. With its intuitive layout and adaptable features, it encourages collaborative analysis and categorization, revolutionizing the way concepts are connected and perceived.
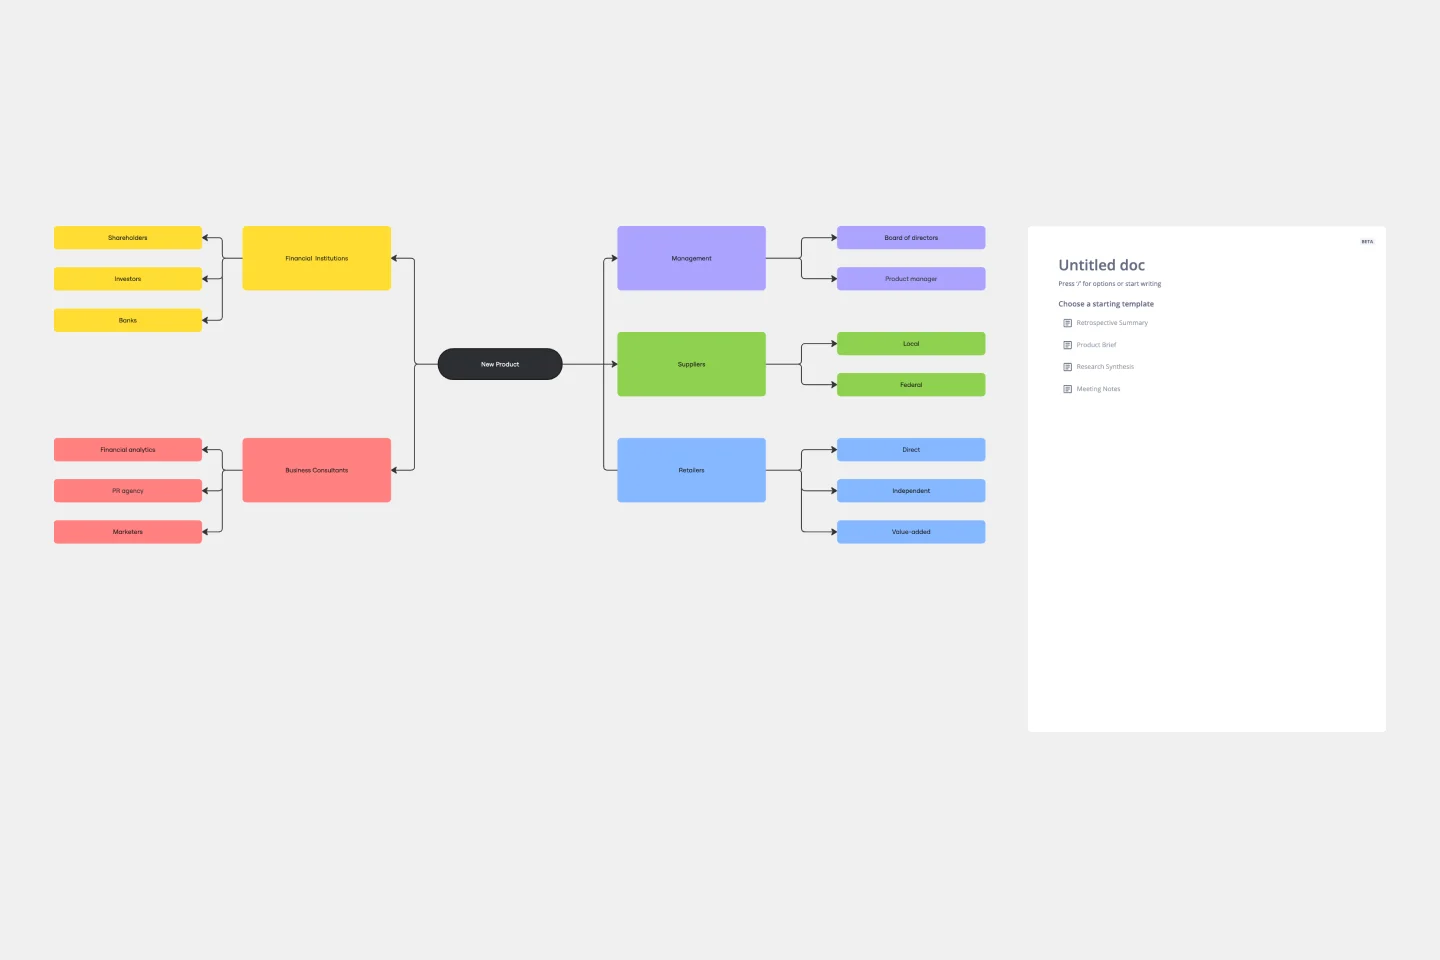
The cluster diagram consists of several key areas that work together to create a visual information ecosystem. It has central nodes representing main ideas, surrounding clusters categorizing related concepts, and connector lines that map their relationships. This template helps to understand the relationships and hierarchies within a subject by placing core ideas at the center and branching them out into detailed subtopics. By using this template, you can create a map that is as informative as it is visually engaging.
How to use the cluster diagram template in Miro
Creating a detailed and dynamic cluster diagram is a seamless experience:
Start with the central node: Identify the main concept or idea and place it at the center of your board.
Add clusters: Branch out from the central node with clusters representing subtopics or related ideas.
Connect with lines: Draw connector lines between the central node and clusters and among clusters to illustrate the relationships.
Customize effortlessly: Edit the template with just a few clicks, changing colors, texts, and more to suit the specific needs.
Expand with ease: Use the automated diagramming features to add more branches and connector lines, growing the diagram organically.
Enrich the context: Drag and drop any artifact – images, documents, links – onto the board, integrating them into the diagram for enhanced depth and clarity.
This highly editable template invites users to iterate rapidly, expanding the clusters and refining ideas without sacrificing clarity or visual appeal.
Why should you use a cluster diagram template?
Using a cluster diagram template offers several compelling advantages:
Enhanced organization: It categorizes information into clear, visually distinct groups.
Improved understanding: The template simplifies complex systems, making them easier to grasp and communicate.
Increased engagement: Visual clustering captures attention and encourages interactive participation.
Flexible adaptation: It's adaptable enough to suit various contexts, from business strategies to education.
Facilitates idea generation: It provides a structured framework that can spark creativity and innovation.
Is it possible to work on the cluster diagram template collaboratively?
Yes, the template is perfect for collaboration, allowing multiple users to contribute simultaneously, share insights, and build upon each other's ideas in real time.
How does the cluster diagram template integrate with other analytical methods?
It's highly complementary and can be used alongside other analytical tools and methods to enhance data interpretation and idea generation.
Can the cluster diagram template be exported for presentations?
It can be effortlessly exported to various formats, making it an excellent tool for sharing insights and presenting organized information to stakeholders or team members.
Get started with this template right now.
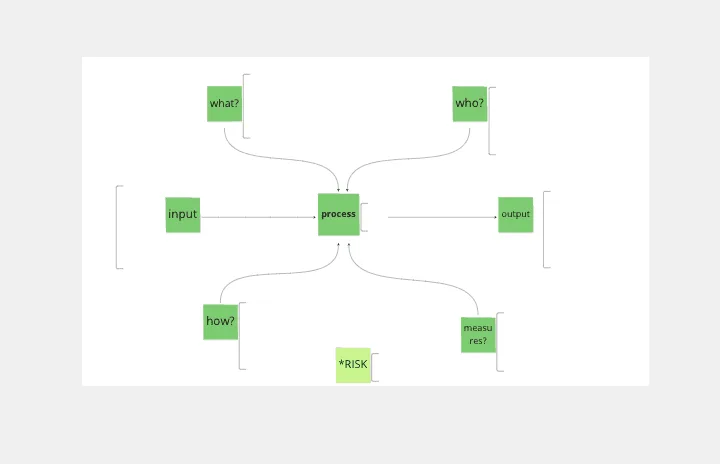
Turtle Diagram for BA
Works best for:
Diagramming
The Turtle Diagram for BA template offers a visual framework for defining and auditing business processes according to ISO 9001 standards. It provides elements for documenting process inputs, outputs, activities, and controls. This template enables organizations to ensure compliance, identify process improvements, and enhance quality management practices. By promoting systematic process documentation and auditability, the Turtle Diagram for BA empowers organizations to achieve and maintain ISO 9001 certification, demonstrating commitment to quality and continuous improvement.
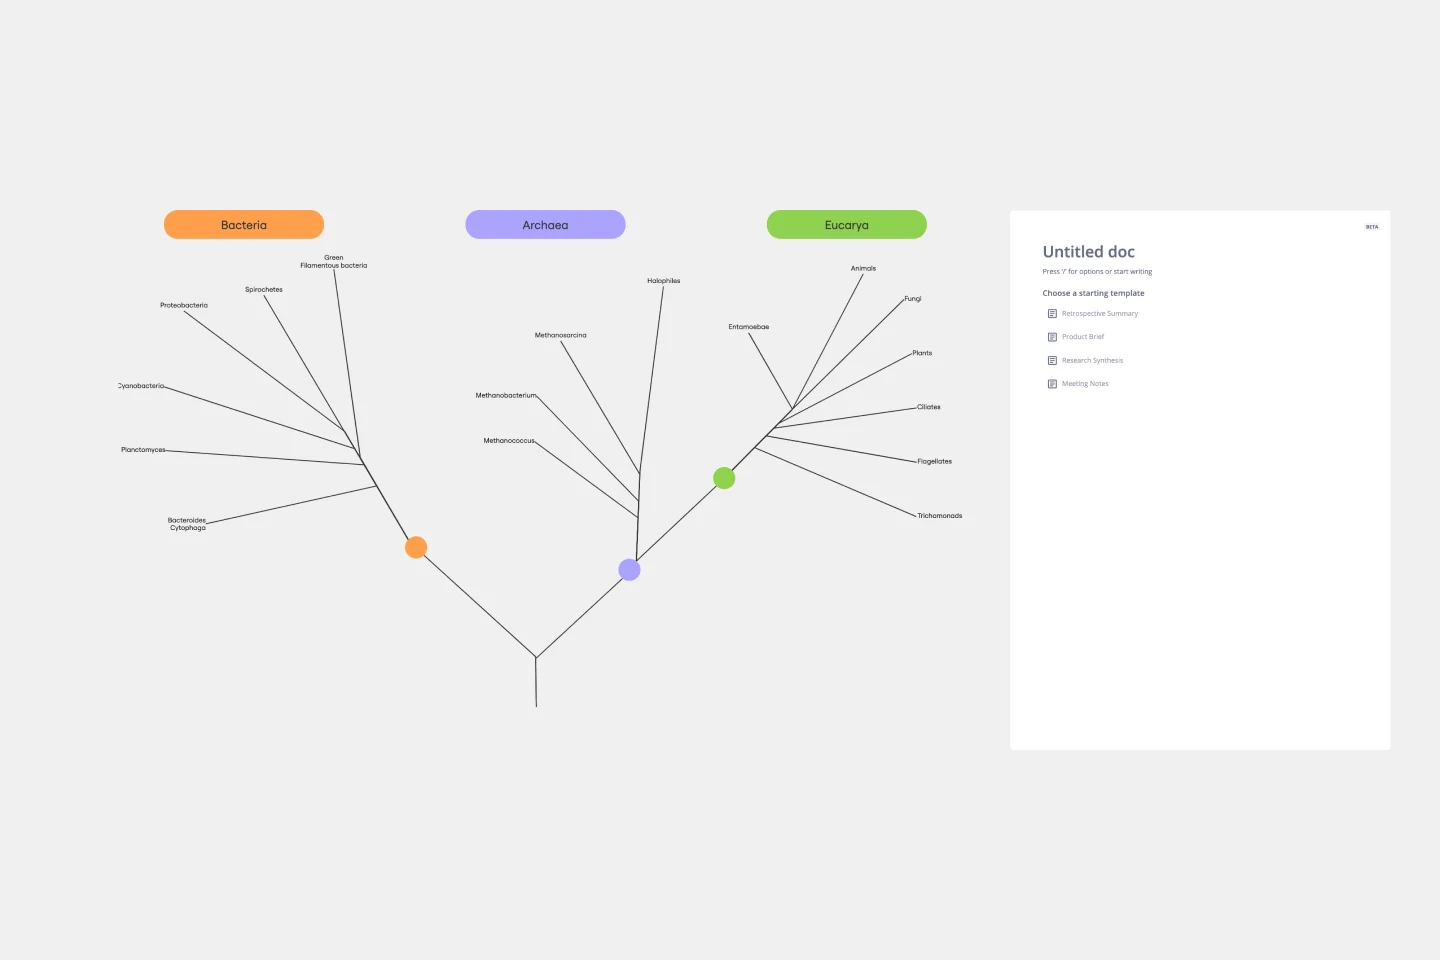
Phylogenetic Tree Template
Works best for:
Diagramming
The Phylogenetic Tree Template is a powerful tool that allows scientists and researchers to visualize evolutionary relationships between species. It is a visual representation of the history of the evolution of life on Earth and helps users identify the relationships between other organisms and their ancestors. The key benefit of this template is that it organizes complex data and makes it more understandable to everyone. Additionally, it offers an efficient way to collect and analyze data, saving time and effort and enabling users to identify significant patterns and relationships in the data.
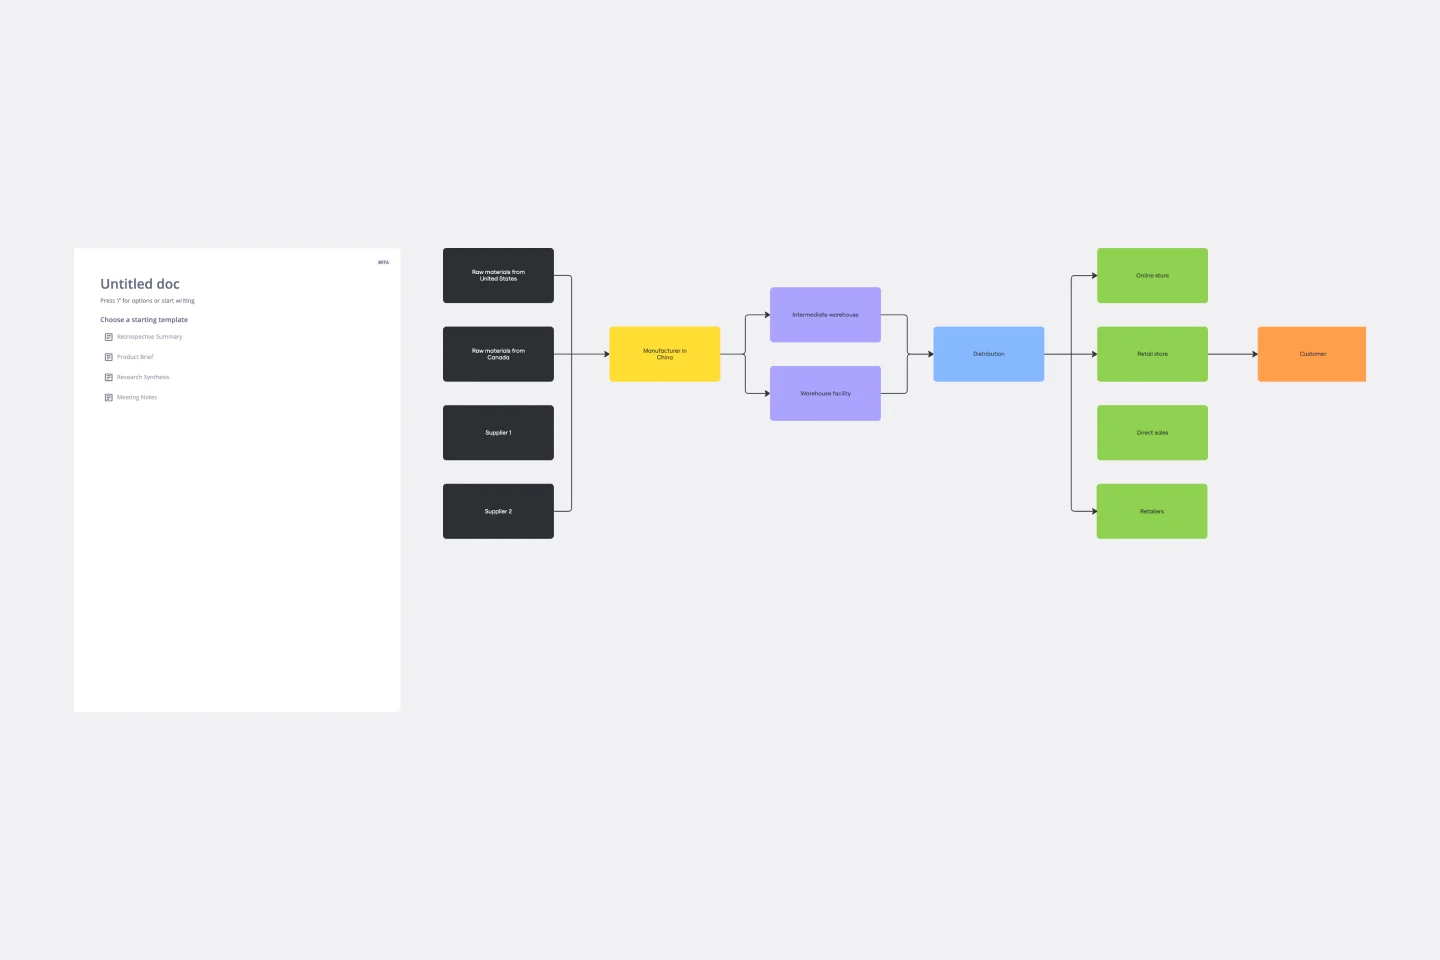
Supply Chain Diagram Template
Works best for:
Diagramming
The Supply Chain Diagram Template is great for businesses to streamline and enhance their supply chain processes. This template lets you visualize the entire supply chain, from sourcing raw materials to delivering finished products. Its intuitive layout simplifies complex networks, making identifying key areas and potential bottlenecks easier. One of the standout benefits of using this template is its clarity. It bridges the gap between complex processes and strategic decision-making by presenting a clear, visual supply chain representation. This clarity enables teams to pinpoint inefficiencies and implement more effective management strategies, which optimizes operations and facilitates better communication and understanding across different departments within an organization.
Stakeholder Mapping Template
Works best for:
Business Management, Mapping, Workflows
A stakeholder map is a type of analysis that allows you to group people by their power and interest. Use this template to organize all of the people who have an interest in your product, project, or idea in a single visual space. This allows you to easily see who can influence your project, and how each person is related to the other. Widely used in project management, stakeholder mapping is typically performed at the beginning of a project. Doing stakeholder mapping early on will help prevent miscommunication, ensure all groups are aligned on the objectives and set expectations about outcomes and results.
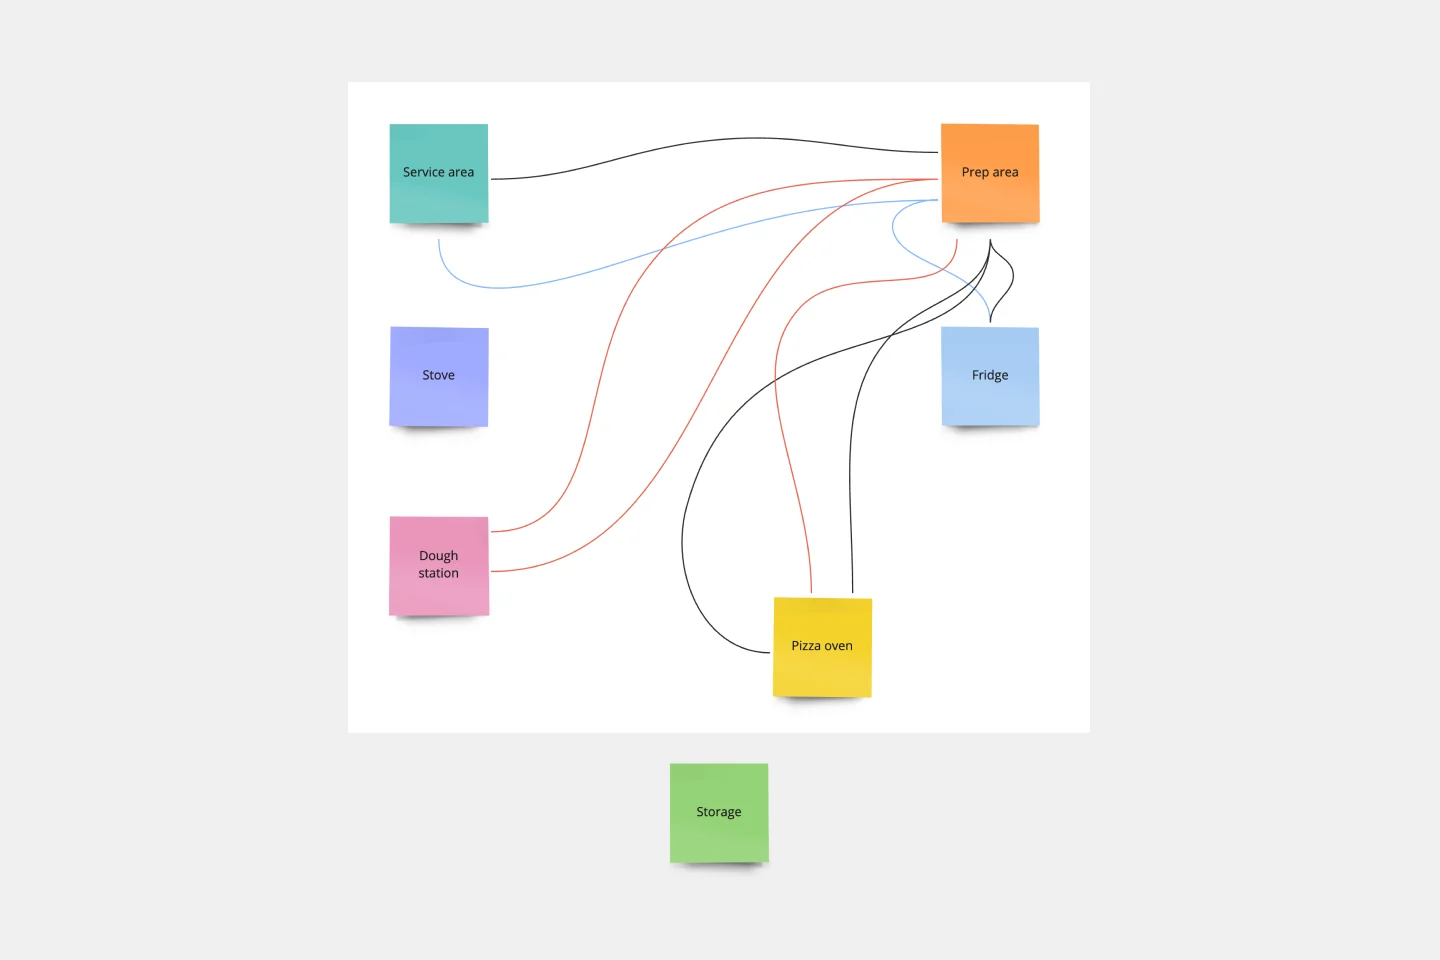
Spaghetti Diagram Template
Works best for:
Operations, Mapping, Diagrams
Spaghetti diagrams are valuable for finding connections between assets, services, and products, as well as identifying dependencies in a visual way. Use this template to get an overview of a process and quickly find areas of improvement.
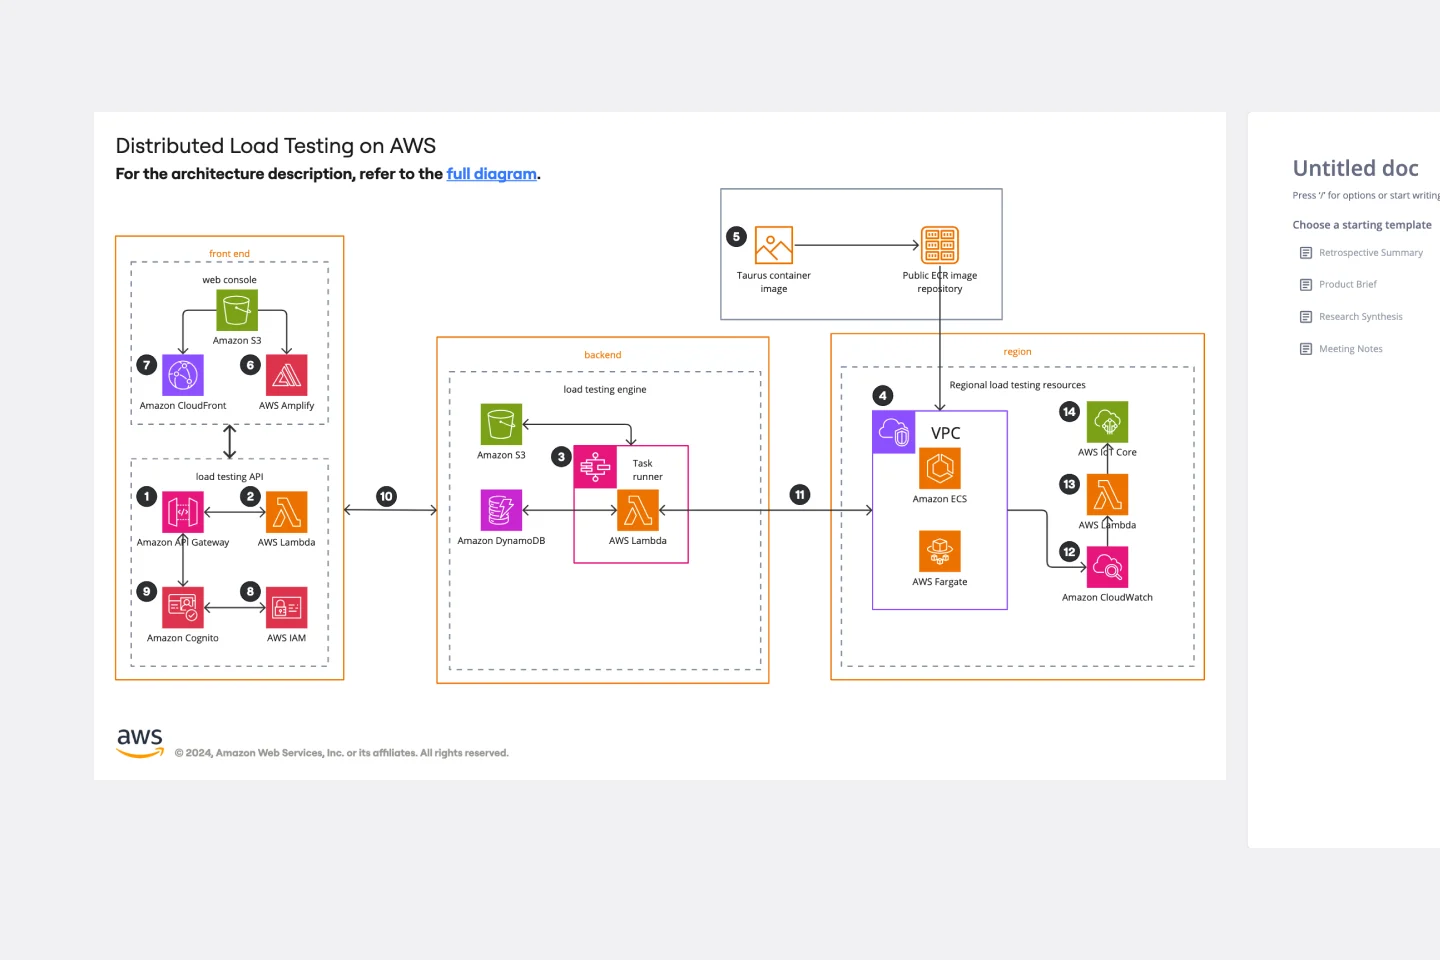
AWS Architecture Diagram Template
Works best for:
Software Development, Diagrams
The AWS Architecture Diagram is a visual representation of the AWS framework, and it also translates the best practices when using Amazon Web Services architecture. You can now have an overview of your AWS architecture with Miro’s AWS Architecture Diagram Template, track your cloud solutions easily, and optimize processes like never before.