On-Premise to Cloud Migration Process Flowchart Template
Break down the cloud migration process into manageable steps with the On-Premise to Cloud Migration Process Flowchart Template.
Available on Enterprise, Business, Education plans.
About the On-Premise to Cloud Migration Process Flowchart Template
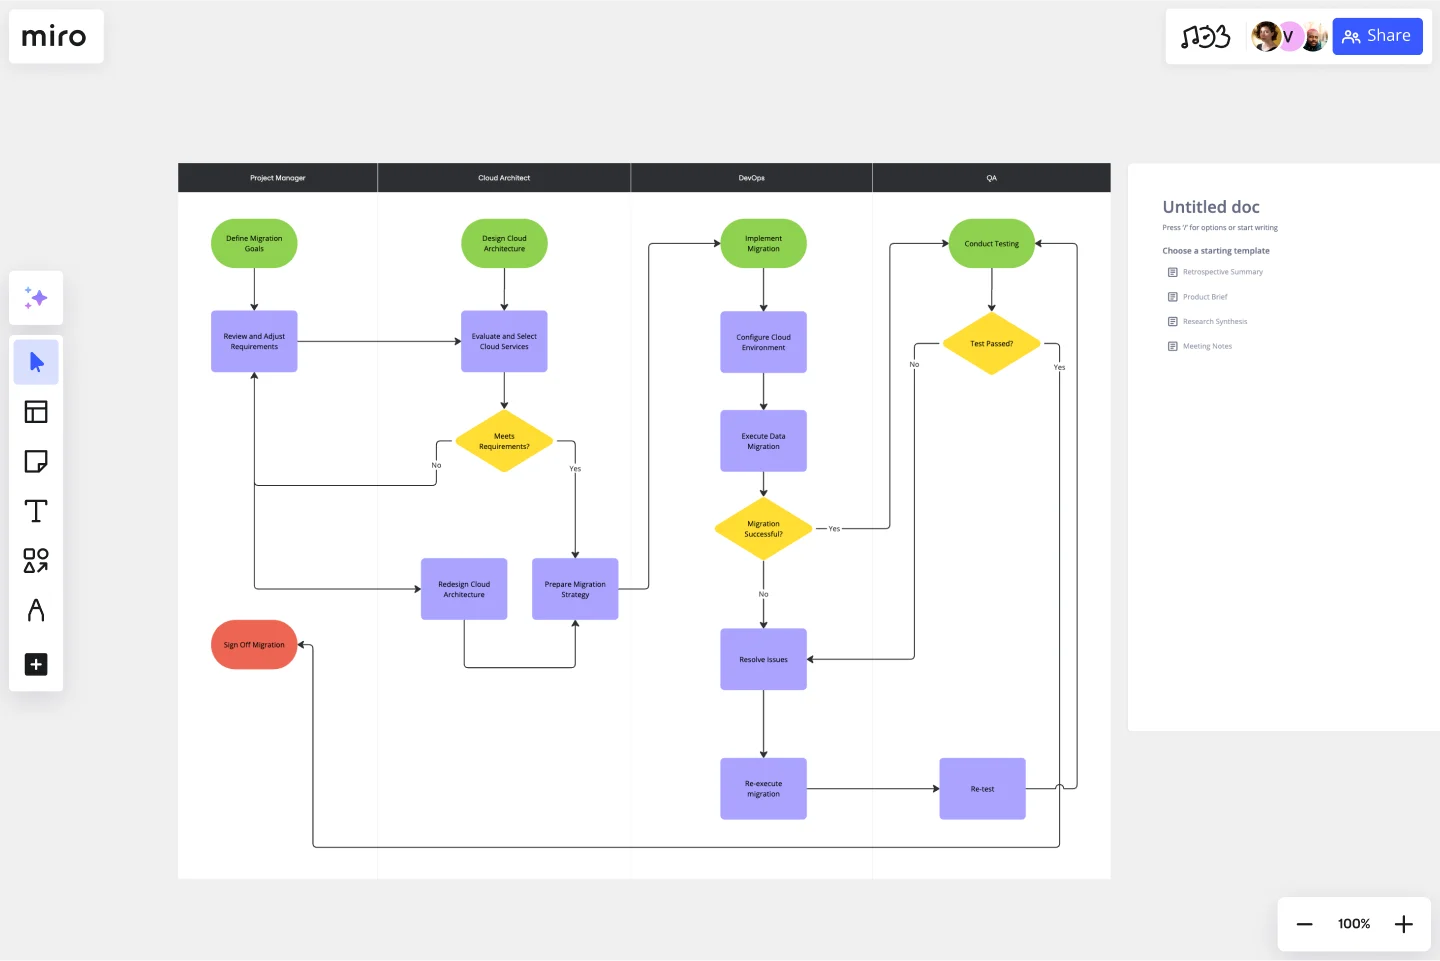
The On-Premise to Cloud Migration Process Flowchart Template simplifies the complex journey of migrating on-premise systems to a cloud-based infrastructure. This template serves as a visual guide, outlining each critical step in the migration process, from initial assessment to the final transition. By leveraging this template, organizations can ensure a structured and efficient migration, minimizing risks and aligning with best practices in cloud adoption.
How to use the On-Premise to Cloud Migration Process Flowchart Template
Customize the flowchart: Once the template is on your board, you can customize it to fit your specific migration project. This includes adding, removing, or modifying steps to align with your organization's processes.
Collaborate with your team: Invite team members to collaborate on the board. Miro's collaborative features allow multiple users to edit, comment, and provide feedback in real time, ensuring a cohesive migration strategy.
Assign tasks: Use Miro's task management features to assign responsibilities for each step of the migration process. This ensures accountability and helps track progress throughout the migration journey.
Review and iterate: As the migration progresses, use the flowchart to review completed steps and plan upcoming activities. The flowchart's visual nature makes it easy to identify bottlenecks or areas requiring additional focus.
Why use the On-Premise to Cloud Migration Process Flowchart Template
Clarity and visibility: The template clearly shows the migration process, making it easier for stakeholders to understand the project's scope and progress.
Efficiency: The template streamlines activities, reduces redundancies, and ensures that nothing is overlooked by outlining each step in the migration process.
Collaboration: Miro's collaborative environment enhances team coordination, allowing for real-time updates, feedback, and task management.
Flexibility: The template is customizable, enabling organizations to tailor the flowchart to their specific needs and migration strategies.
Risk Mitigation: By providing a structured approach to migration, the template helps identify potential risks early in the process, allowing for proactive mitigation strategies.
Discover work breakdown structure examples for your IT projects and create the next big thing.
Get started with this template right now. Available on Enterprise, Business, Education plans.
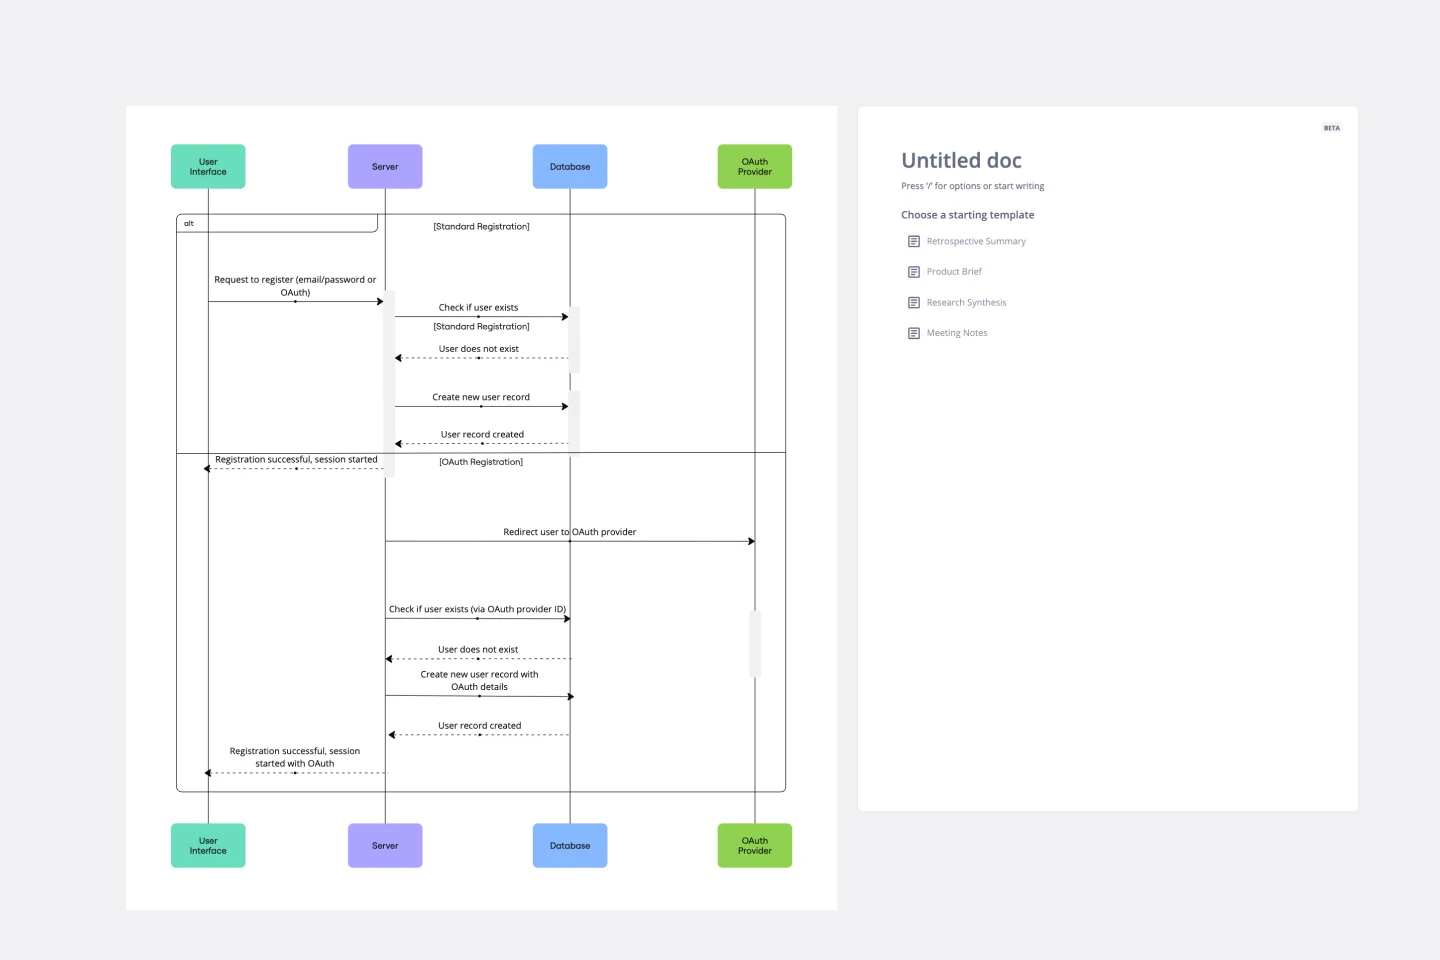
UML Sequence Registration Process Template
Works best for:
UML
The UML Sequence Registration Process Template helps visualize and document user registration processes. It enables the rapid creation of sequence diagrams, which are crucial for enhancing clarity and identifying potential issues early in the design phase. This template not only supports collaborative efforts through Miro's platform, facilitating real-time teamwork, but also ensures a comprehensive system design. Being part of a broader collection of UML diagram templates, it stands as a valuable asset for projects involving registration workflows, contributing to streamlined project execution and effective communication among team members.
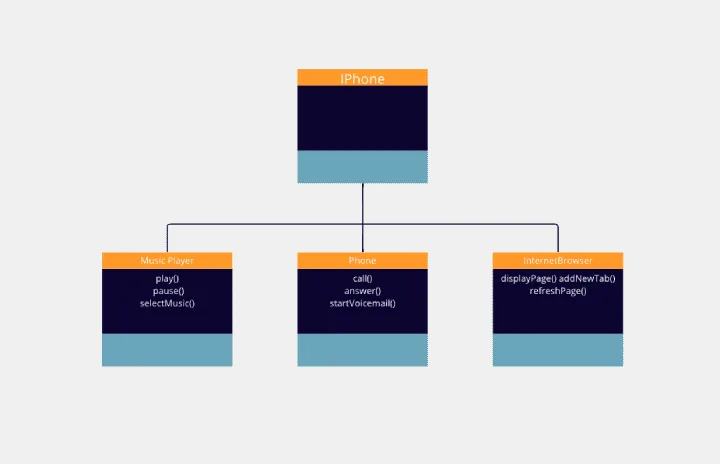
Challenge - UML Iphone
Works best for:
Diagramming
The Challenge UML Iphone template offers a visual framework for designing and modeling iPhone app challenges and solutions using UML (Unified Modeling Language). It provides elements for defining app functionalities, user interactions, and system architecture. This template enables teams to brainstorm ideas, document requirements, and visualize app designs, facilitating collaboration and innovation. By promoting clarity and alignment, the Challenge - UML Iphone template empowers teams to design iPhone apps that meet user needs and deliver exceptional user experiences.
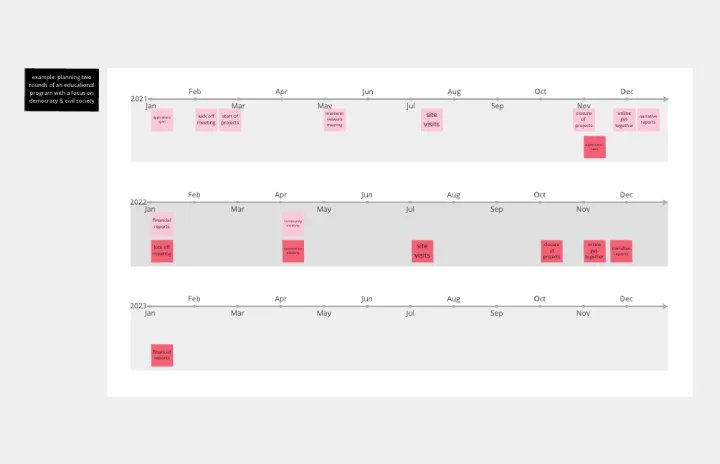
Year Timeline Template
Works best for:
Timeline, Planning
The Year Timeline template provides a comprehensive view of annual events and milestones. Perfect for planning yearly goals, tracking progress, and scheduling important dates, this template helps you stay organized and focused throughout the year.
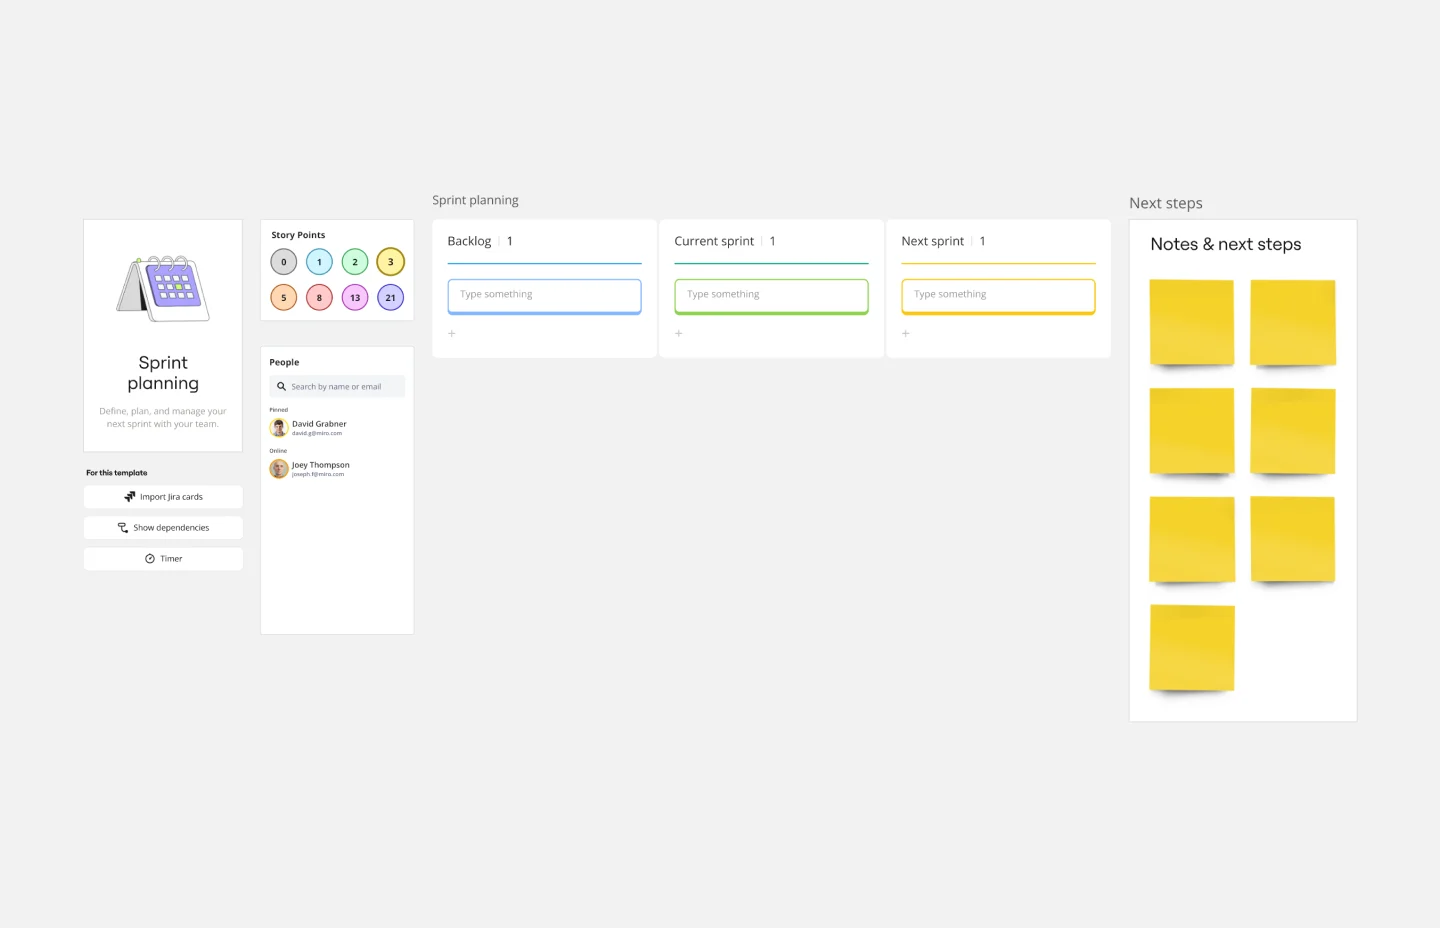
Sprint Planning Template
Works best for:
Agile, Sprint Planning
The Sprint Planning Template is a useful tool for agile teams to organize and conduct sprint planning sessions. It enhances team collaboration and communication by providing a clear visual layout of sprint goals, tasks, and timelines. The interactive design ensures team alignment toward sprint objectives, leading to effective teamwork. The template is a central hub for planning, discussion, and decision-making, creating a collaborative and productive environment.
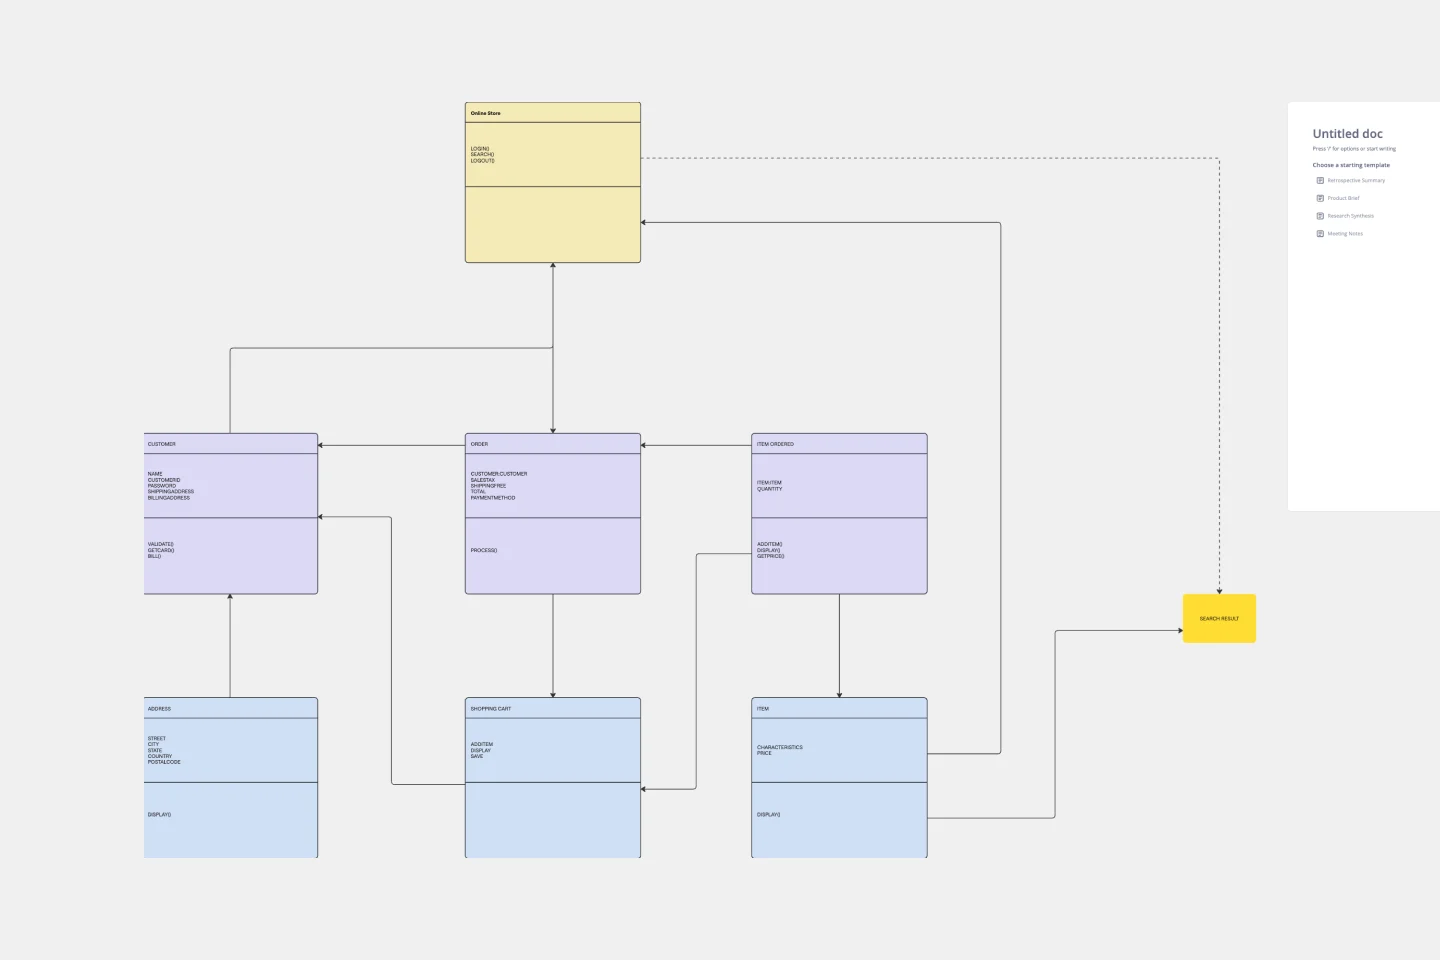
UML Diagram Template
Works best for:
Diagrams, Software Development
Originally used as a modeling language in software engineering, UML has become a popular approach to application structures and documenting software. UML stands for Unified Modeling Language, and you can use it to model business processes and workflows. Like flowcharts, UML diagrams can provide your organization with a standardized method of mapping out step-by-step processes. They allow your team to easily view the relationships between systems and tasks. UML diagrams are an effective tool that can help you bring new employees up to speed, create documentation, organize your workplace and team, and streamline your projects.
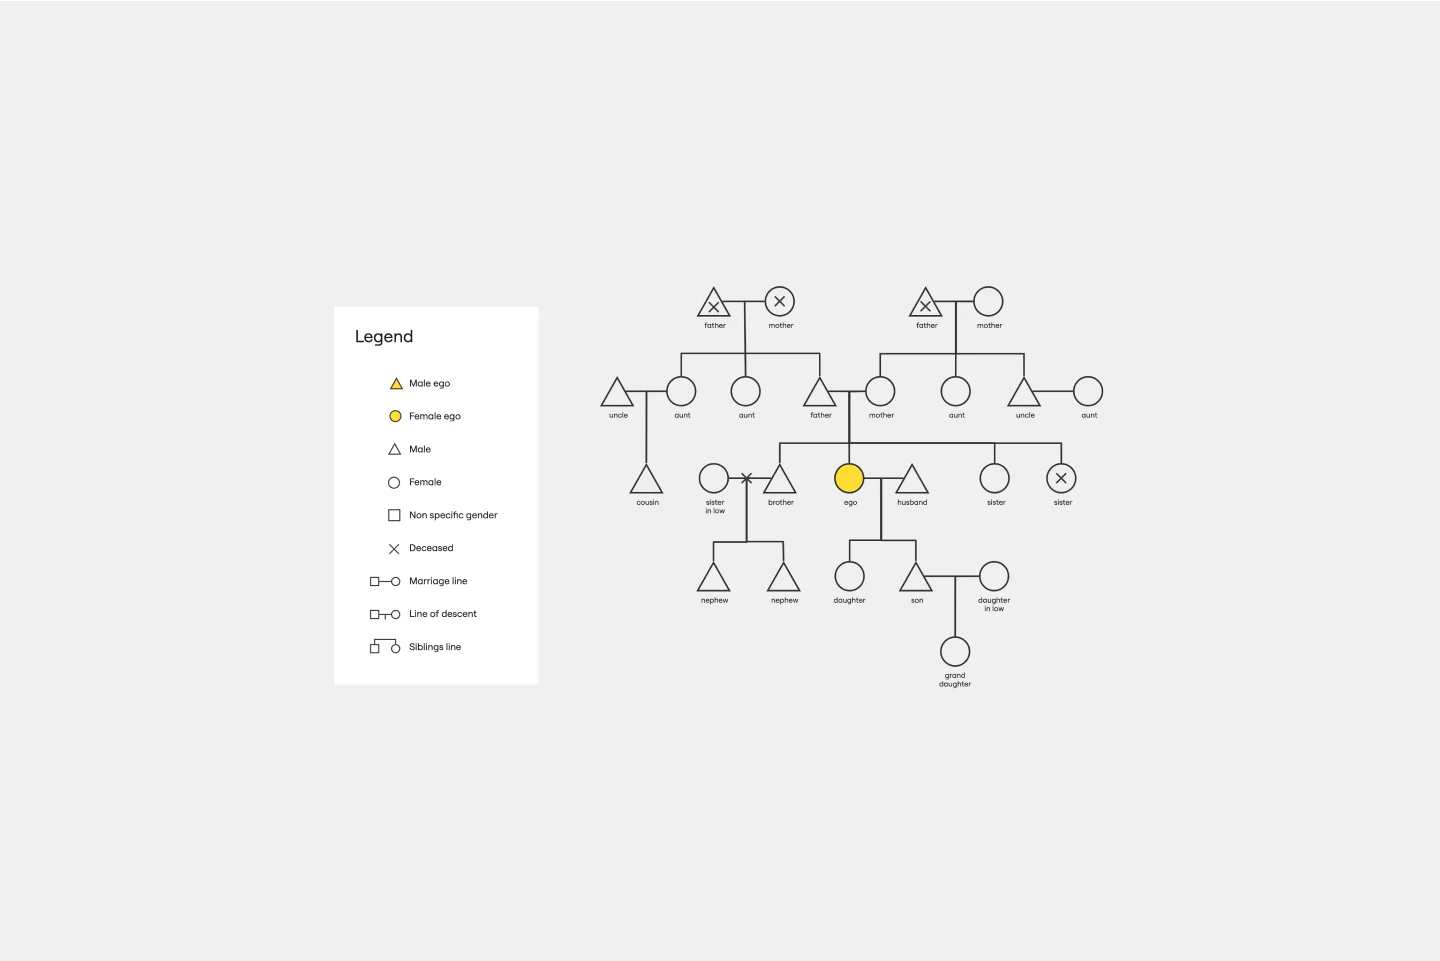
Kinship Diagram Template
Works best for:
Mapping
Use a Kinship Diagram Template to map out a clear picture of your family relationships. With clear guidelines for kinship notation, you can navigate everything from your closest uncle to your third cousin twice removed. Try the Kinship Diagram Template to understand your family relationships.