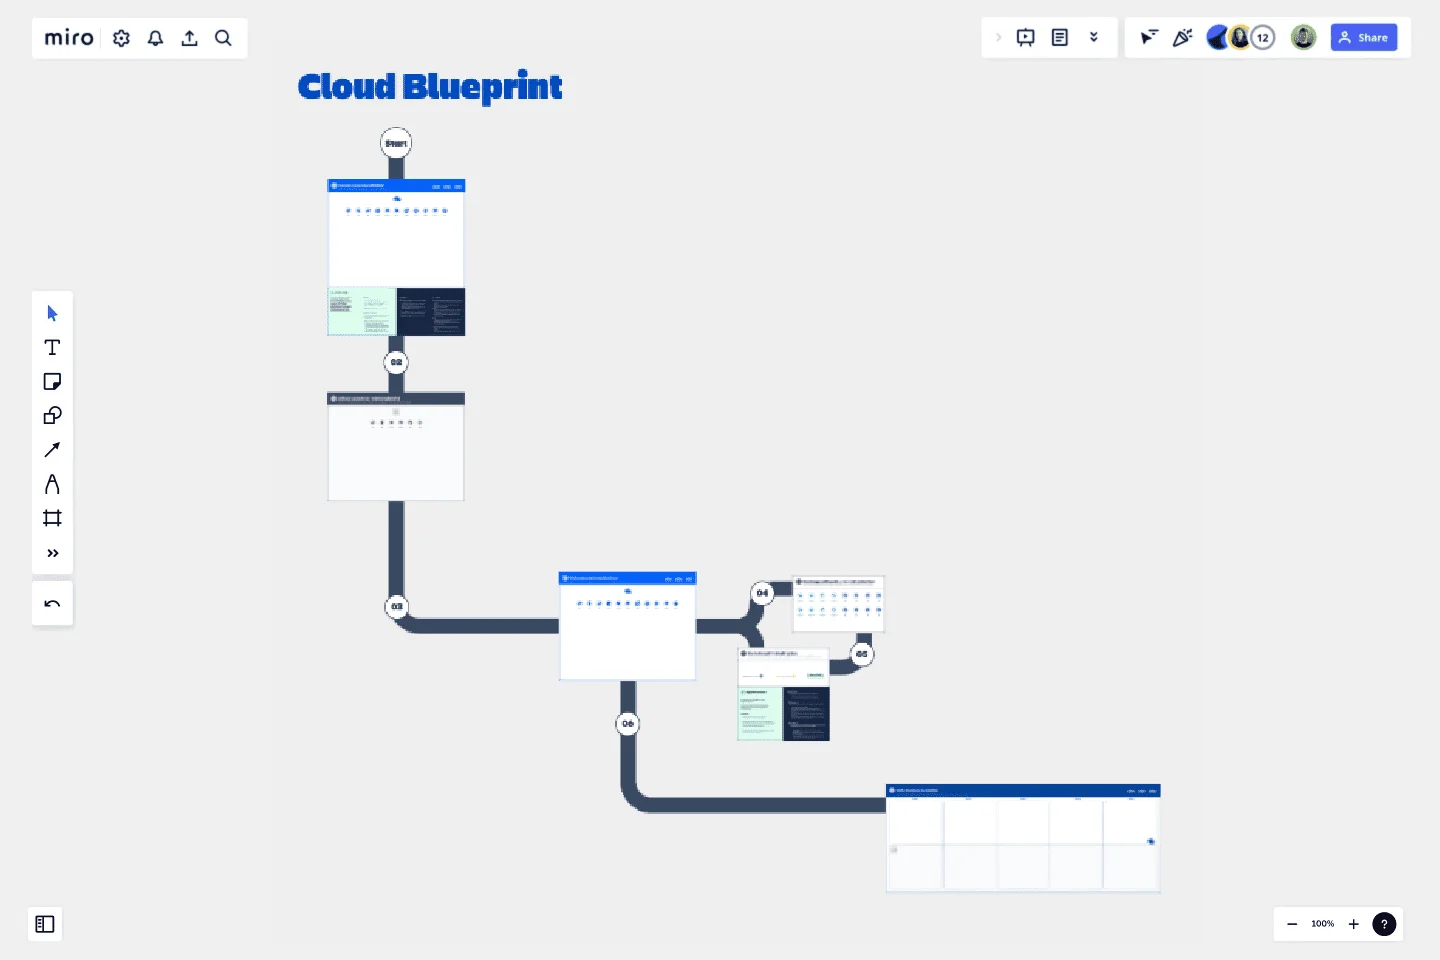
Cloud Blueprint
Make the journey to cloud more than just a copy and paste, and instead take the opportunity for a transformation.
Why create a blueprint?
A blueprint helps you explain where you've come from and where you are going into the future with Atlassian Cloud. Most importantly, it helps you find your narrative on why and how to make the move. Done early in your Cloud migration planning, this can help you confidently decide exactly what will migrate, from where to where, who and when.
It is especially useful if you feel that your current setup is not optimised and need to investigate the value unlocked by transformation.
Who to invite to run the workshop?
It's import to run this with a well rounded crew of stakeholders, such as system administrators, project leads, end users and business strategy and operations experts who can contribute to designing your future state in cloud. You want to assemble a team that will embrace the pros and cons of different cloud architectures, so that you arrive at the right design.
At the end of this workshop you’ll produce what is known in the industry as a tenant map, which visualises your migration paths.
How to use the blueprint?
Key steps:
Determine your dream state in Cloud - How will you organise your teams in Cloud that best supports your future way of working?
Audit what you have on Server - How are your teams organised today on Server?
Bring your present and future state ideas onto the one map
Don’t forget apps and integrations attached to your core data and how they will move
Map where you data will more from and to, and at what rate of change (all at once, by cohort or by start fresh).
Convert your tenant map into a Project timeline
Detailed instructions are provided on the Mire board itself when you use this template. Also, check out the demo video below!
Presto - you’ve got a strategic plan for your move to Cloud!
Designing the right tenant map may take multiple rounds and is best done iteratively, in consultation with the wider business. Plan for a series of 1-2hr workshops.
This template was created by Jason Wong.
Get started with this template right now.
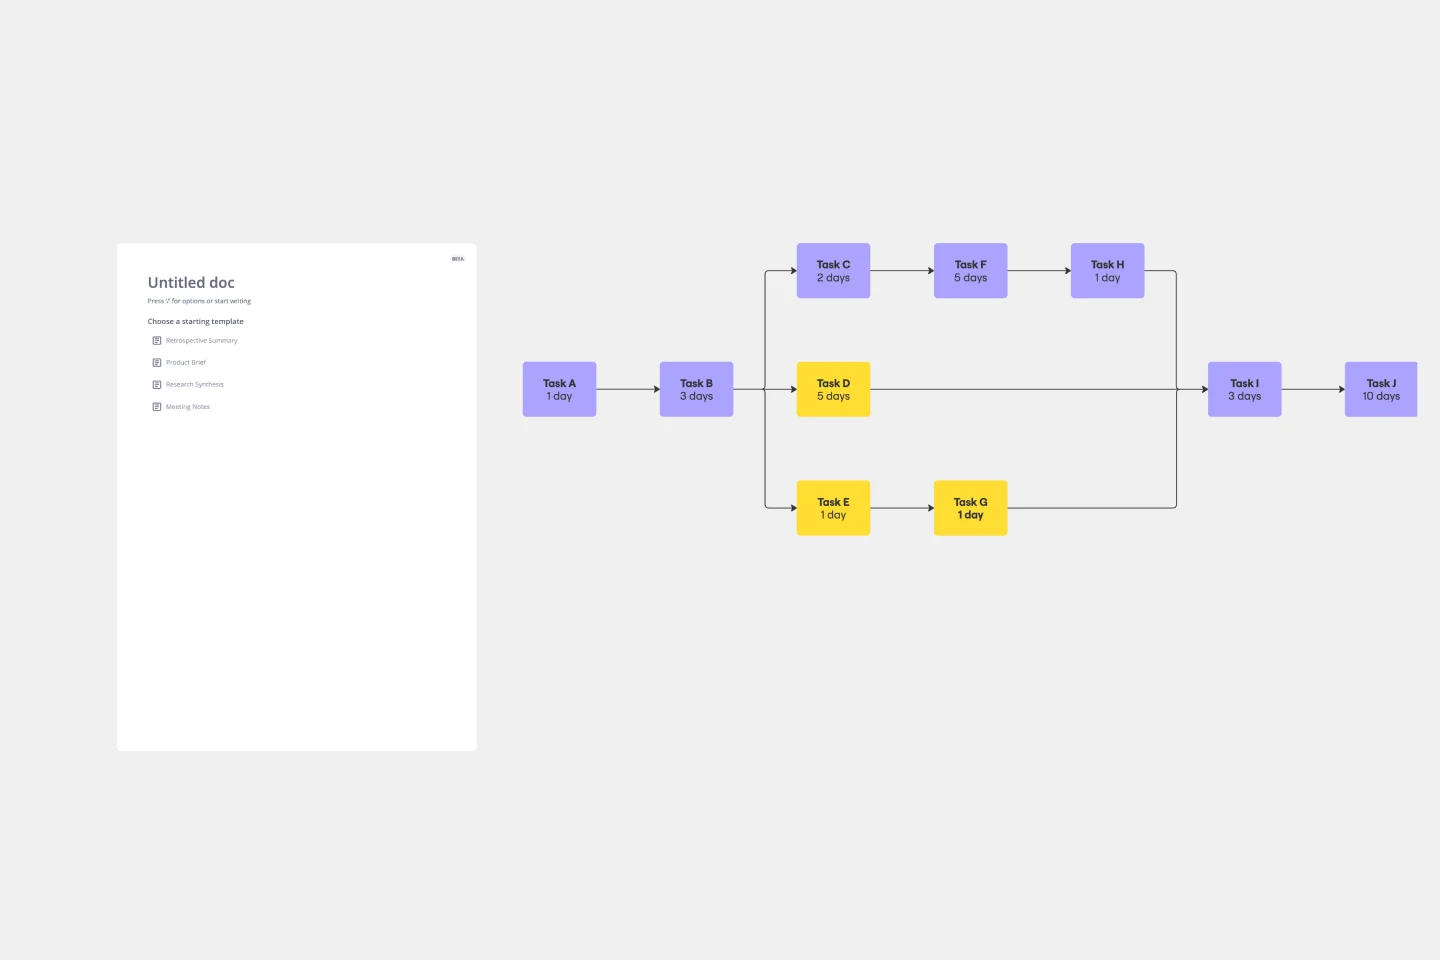
Critical Path Method Template
Works best for:
Diagramming, Project Management
Elevate your project management game with the Critical Path Method Template—an indispensable tool that brings clarity and precision to your project timelines. The template instantaneously adjusts as you edit tasks and dependencies, ensuring that your critical path is consistently up-to-date. This capability not only simplifies the complex process of project scheduling but also empowers your team to proactively respond to evolving project dynamics, fostering adaptability and efficiency throughout the project lifecycle.
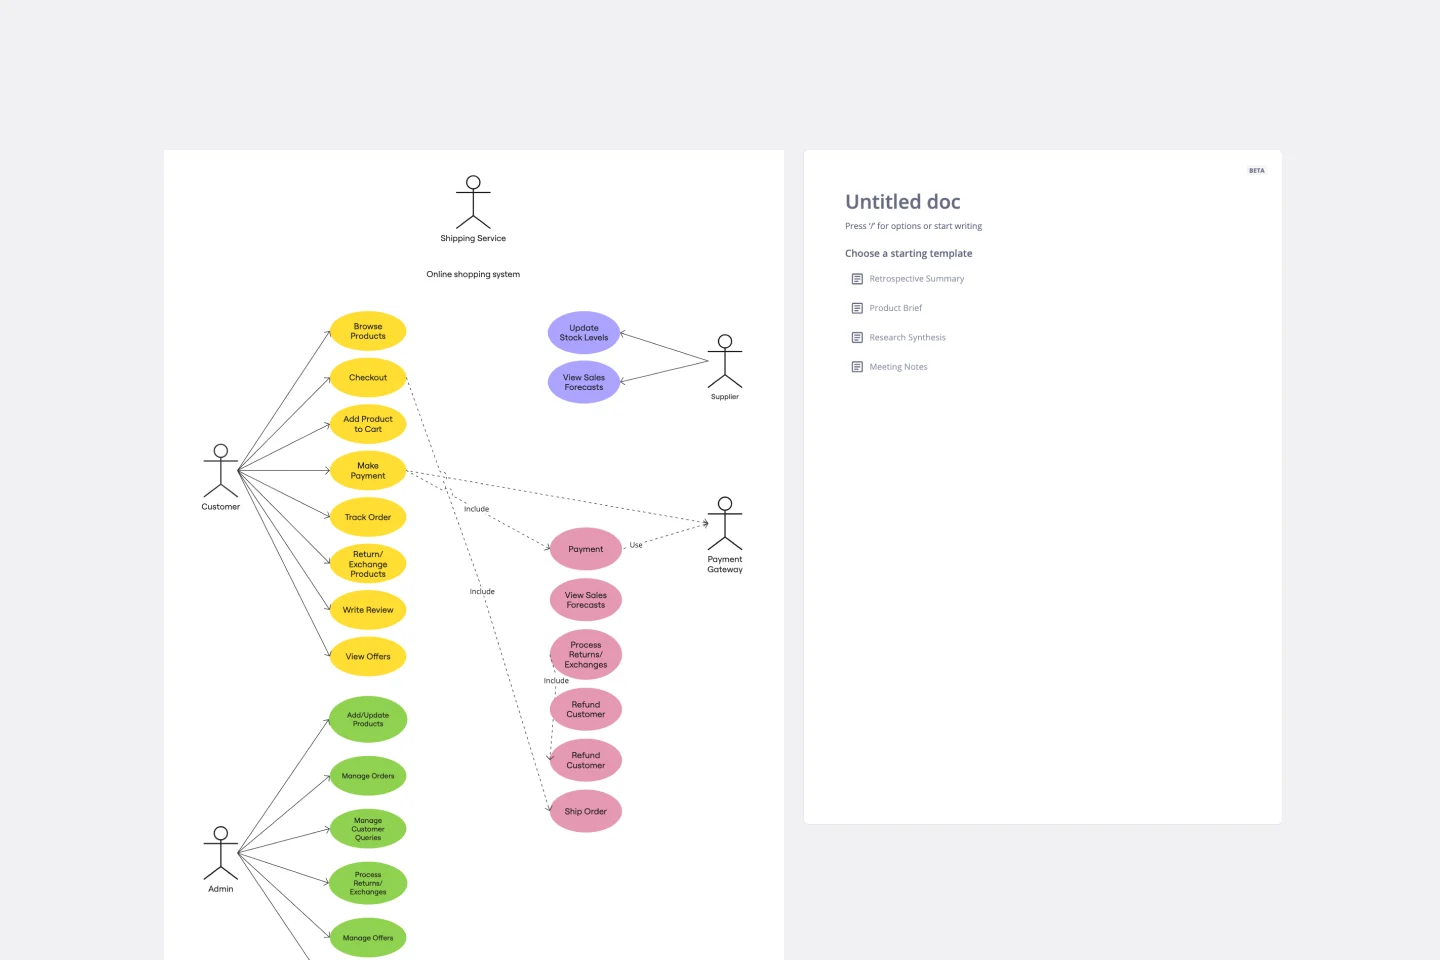
UML Use Case Online Shopping System Template
Works best for:
UML
The Online Shopping System Template simplifies the process of documenting and visualizing how users interact with an online shopping system. It provides a standard way to map out user interactions, such as product listings, inventory management, shopping carts, order processing, payments, and shipping details. By using this template, teams can collaborate effectively in real-time or at different times, adjusting the diagram to meet their project's specific needs. This not only improves clarity and efficiency but also fosters better communication among team members and stakeholders, ensuring a thorough understanding of the system's design and requirements.
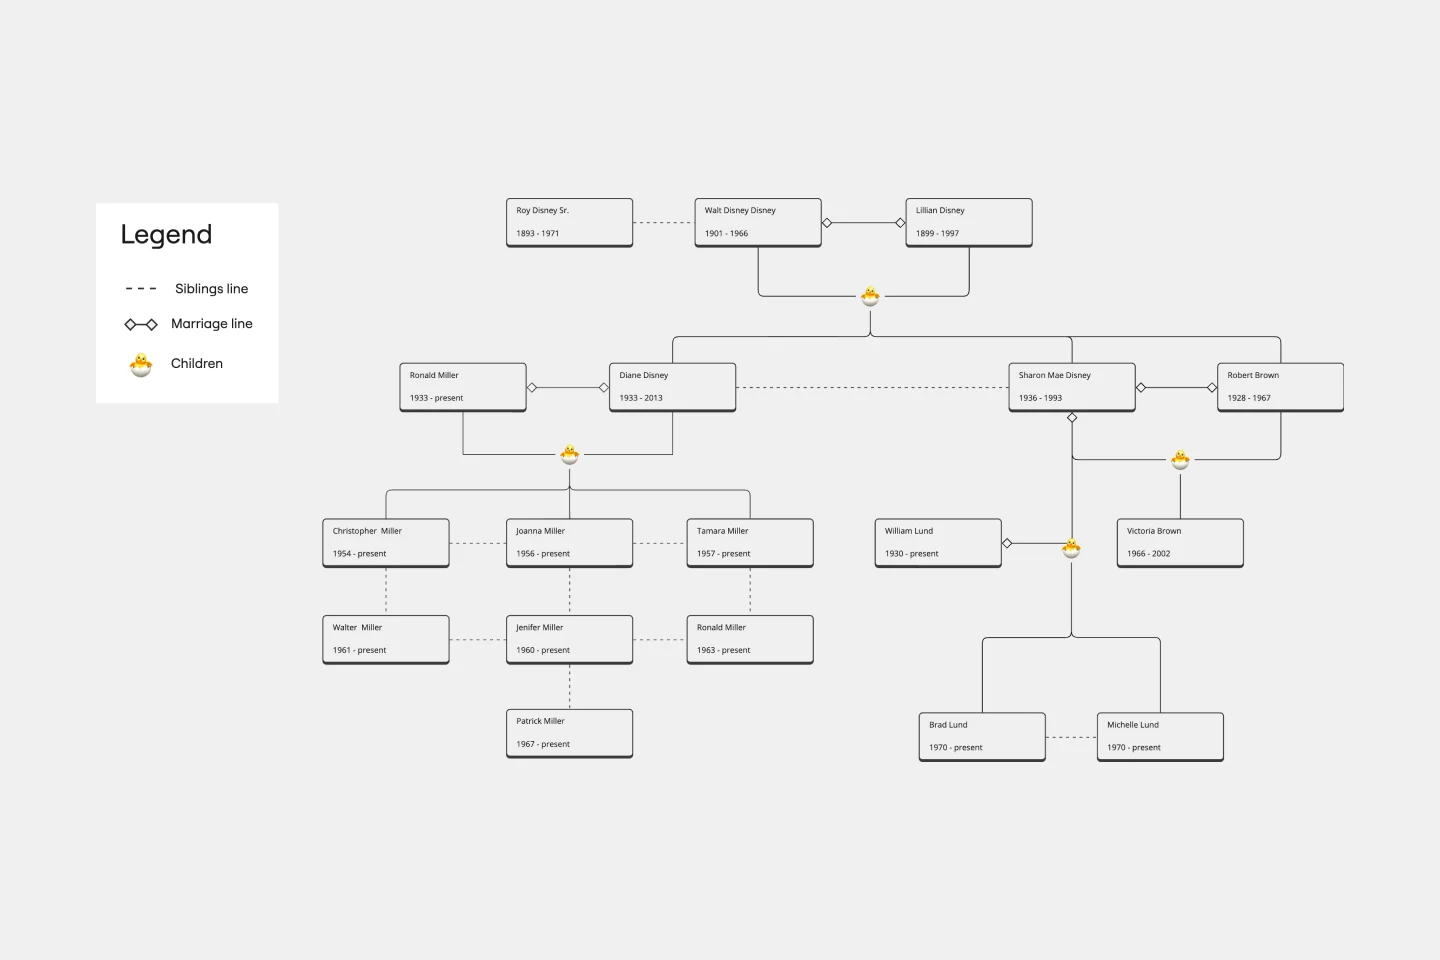
Family Tree Template
Works best for:
Education, Mapping
Family trees help you make sense of complicated family relationships, even generations back. With this Family Tree Template, you can quickly and easily add your siblings, parents, and extended family members. Plus, add extra information, notes, and even images to create a vibrant family tree.
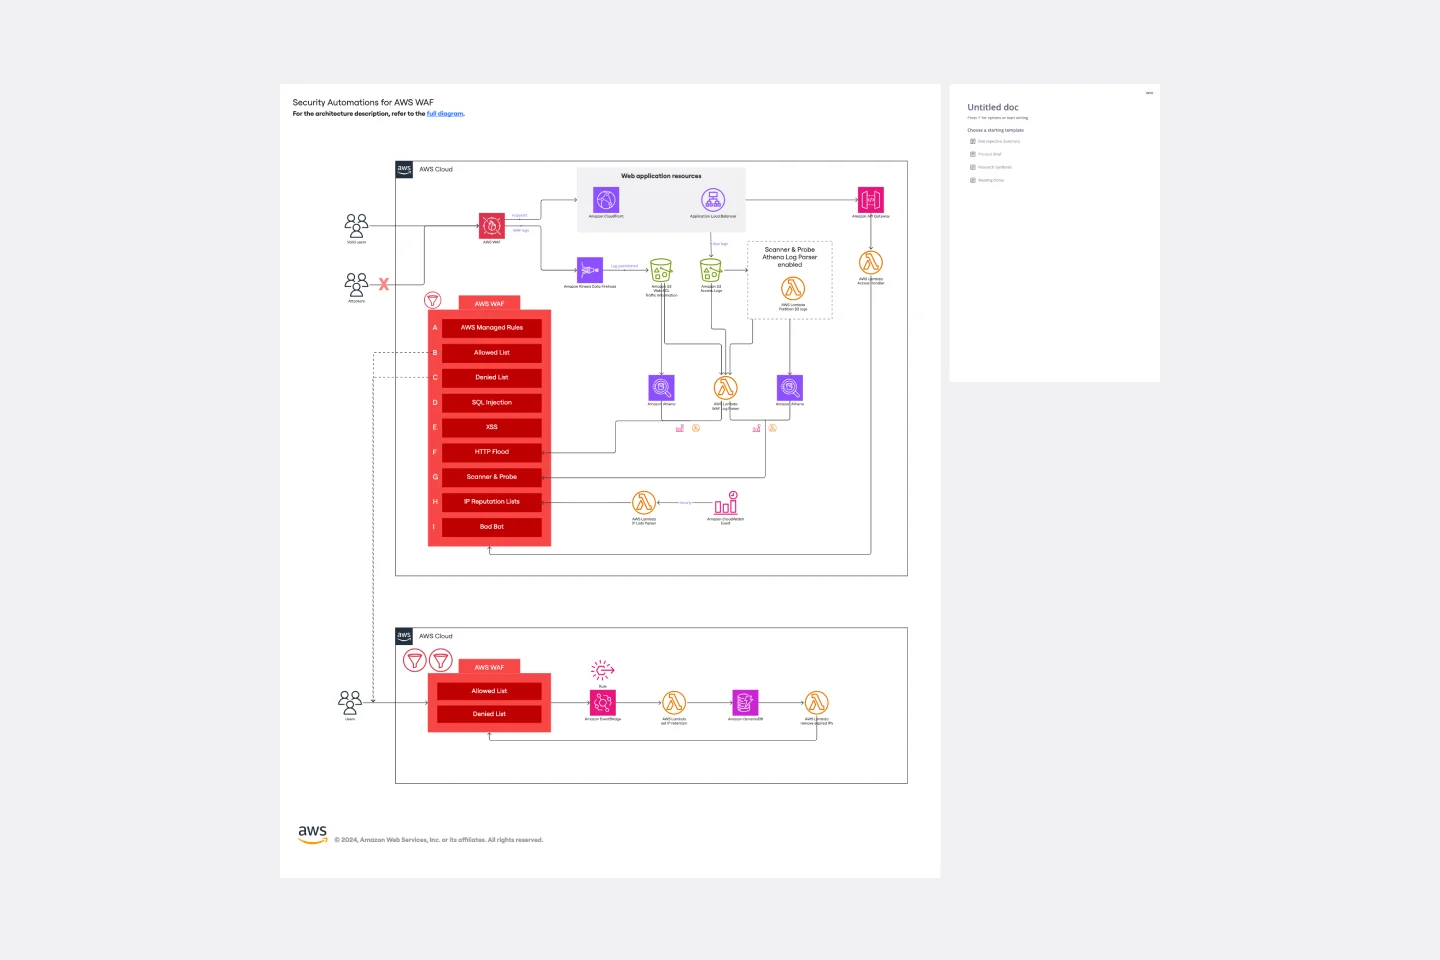
Security Automations for AWS WAF Template
The Security Automations for AWS WAF template is designed to streamline the process of enhancing the security of your AWS applications. It allows teams to collaboratively design, visualize, and refine AWS WAF configurations to protect against common web exploits effectively. This template includes various components such as automated deployment pipelines, instance schedulers, and serverless image handlers, providing a robust framework for managing AWS WAF security automations. By using this template, teams can improve collaboration, achieve a clear visual representation of their AWS WAF configurations, enhance efficiency in managing AWS WAF rules, and customize the template to meet specific application security needs.
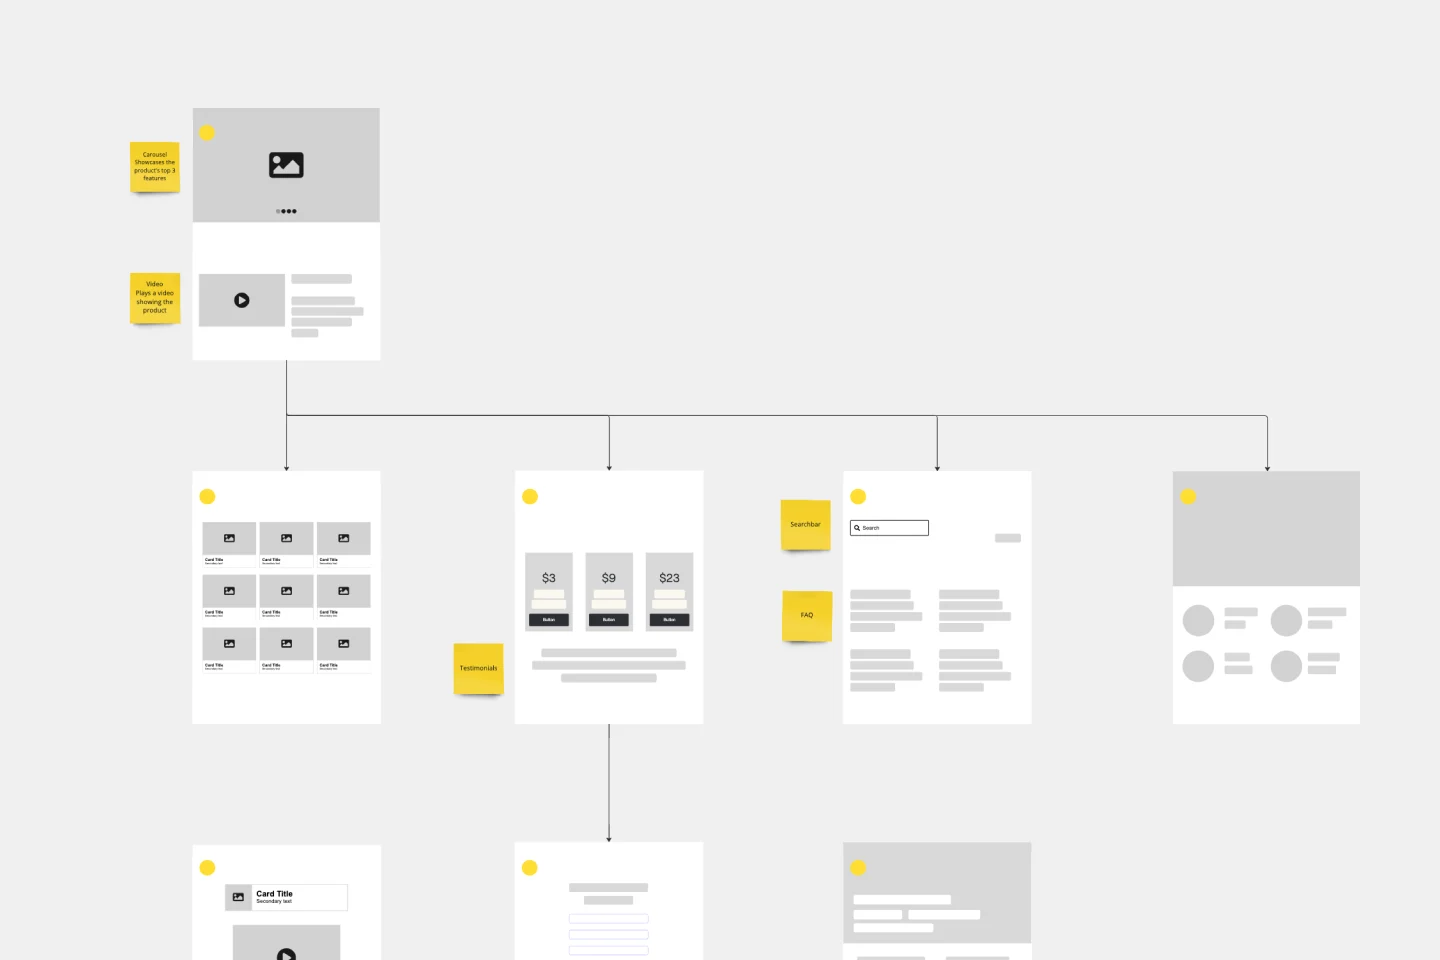
Website Flowchart Template
Works best for:
Flowcharts, Mapping, User Experience
A website flowchart, also known as a sitemap, maps out the structure and complexity of any current or future website. The flowchart can also help your team identify knowledge gaps for future content. When you’re building a website, you want to ensure that each piece of content gives users accurate research results based on keywords associated with your web content. Product, UX, and content teams can use flowcharts or sitemaps to understand everything contained in a website, and plan to add or restructure content to improve a website’s user experience.
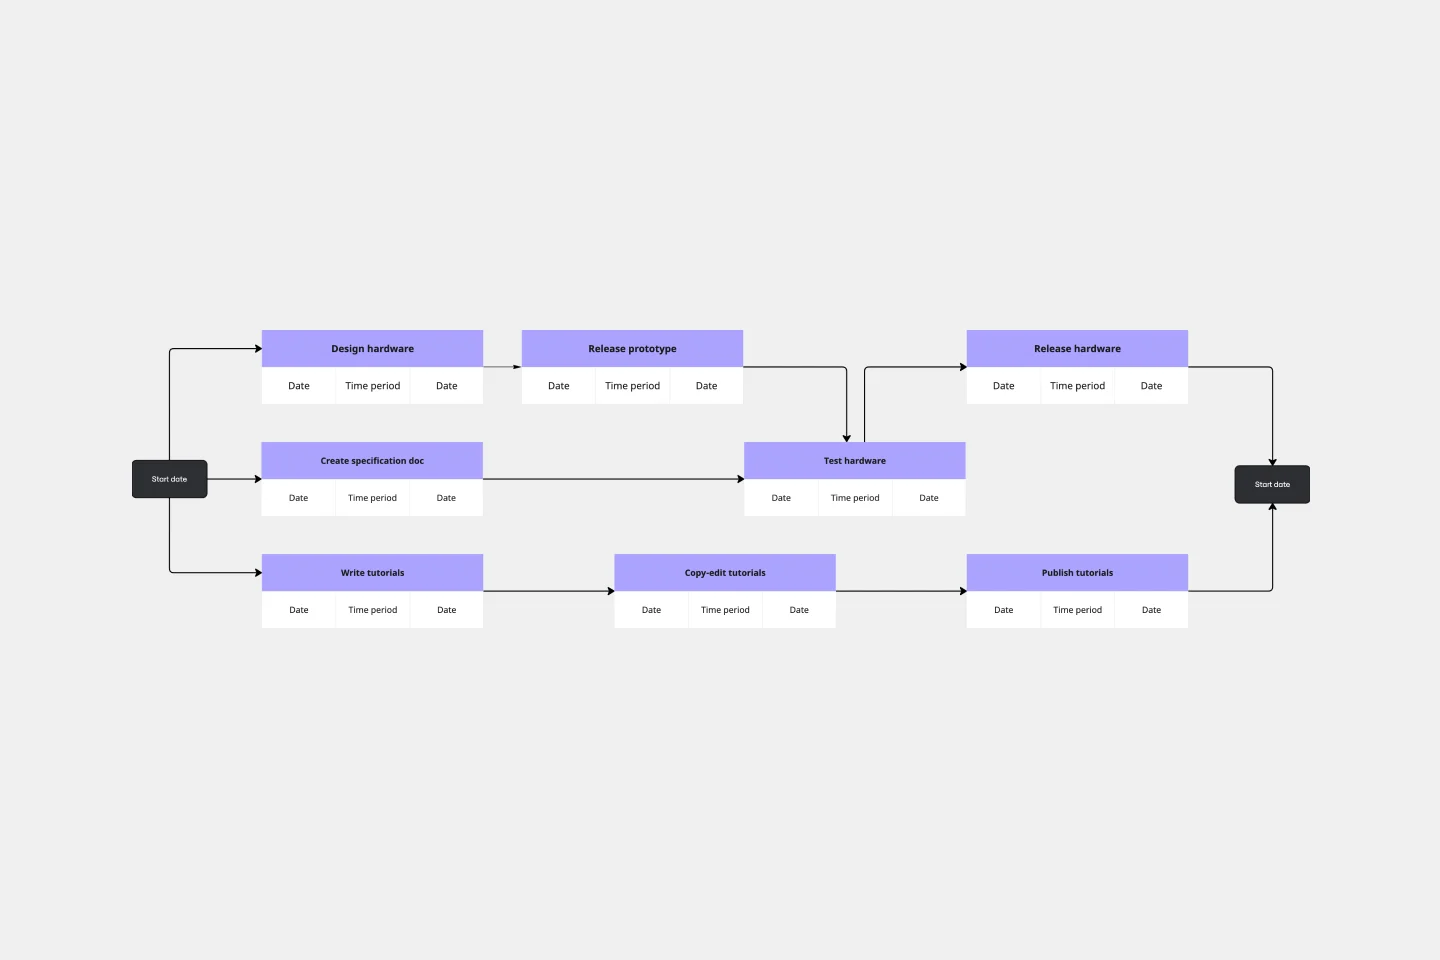
PERT Chart Template
Works best for:
Mapping, Project Planning
A Program Evaluation and Review Technique (PERT) diagram is used to plan projects efficiently. They help you set a clear timeline, plan out tasks and dependencies, and determine a critical path.