Chat-Bot
Create your own chatbot!
Here are some instructions to get you started:
Determine the purpose and scope of your chatbot: First, decide what you want your chatbot to do and what type of conversations it will have. Will it be a customer service chatbot, a personal assistant, or something else entirely? Once you have a clear idea of your chatbot's purpose, you can move on to the next step.
Design your chatbot's personality and tone: Your chatbot's personality and tone will affect how users interact with it. Decide whether you want your chatbot to be formal or casual, friendly or professional, and so on.
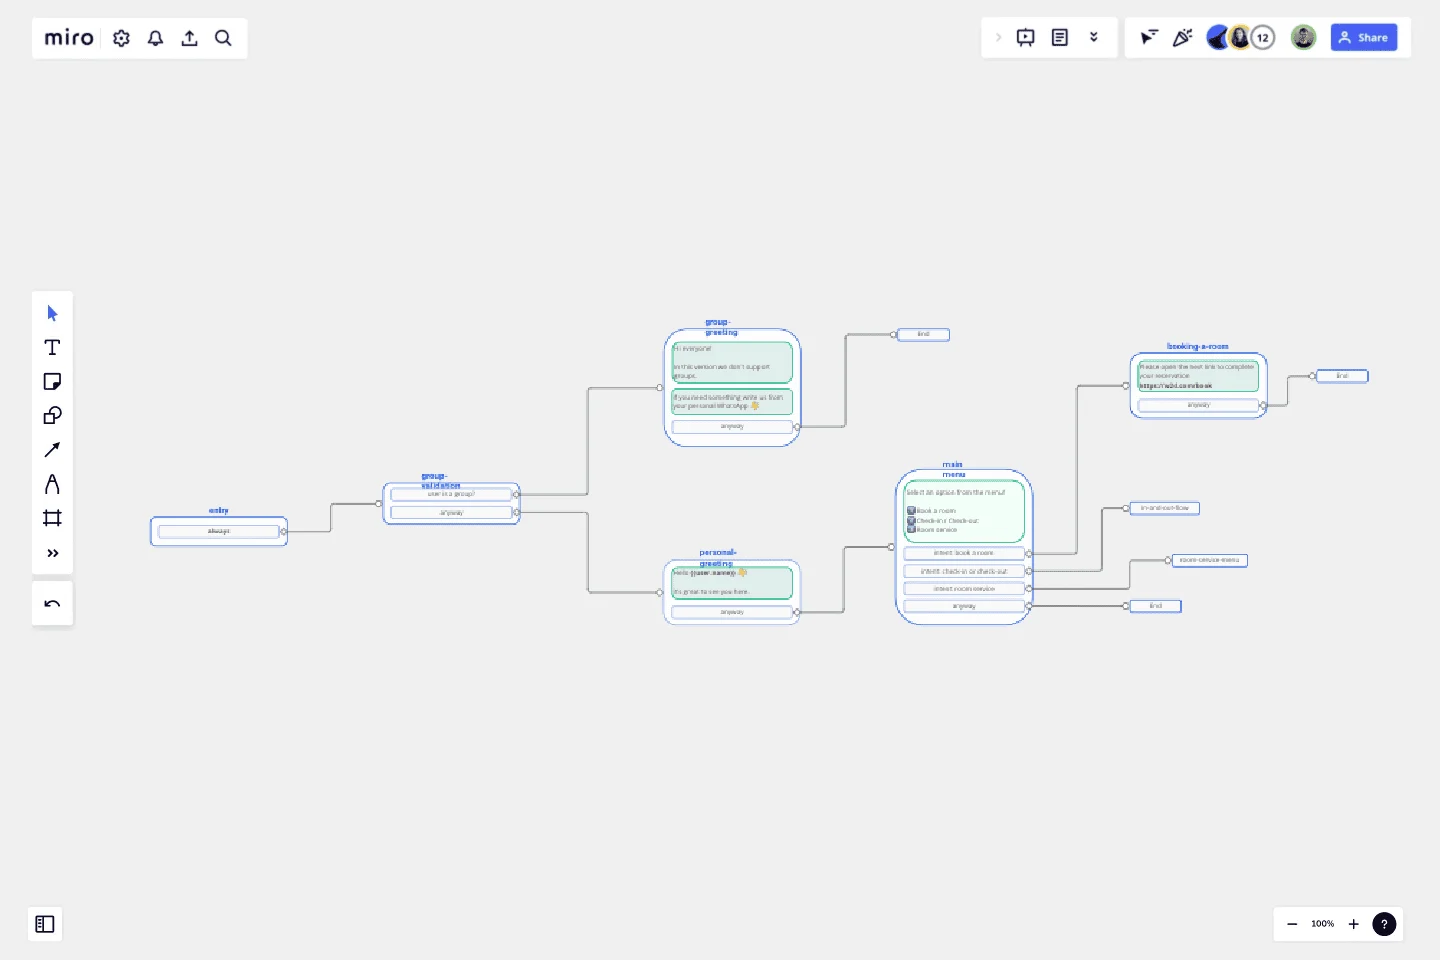
Create your chatbot's conversation flow: Design a conversation flow for your chatbot, outlining the various paths users can take when interacting with it. Consider what questions your chatbot will ask users and how it will respond to their answers.
Train your chatbot: Use your chosen platform to train your chatbot using natural language processing (NLP) and machine learning. This will help your chatbot understand user input and respond appropriately.
Test your chatbot: Test your chatbot with a small group of users to identify any issues or areas for improvement. Refine your chatbot's conversation flow and training as needed.
Deploy your chatbot: Once you're happy with your chatbot's performance, deploy it on your website or messaging platform. Monitor its performance and make adjustments as necessary.
That's it! By following these instructions, you should be able to create a functional chatbot that meets your needs.
Good luck!
This template was created by Kike Rios.
Get started with this template right now.
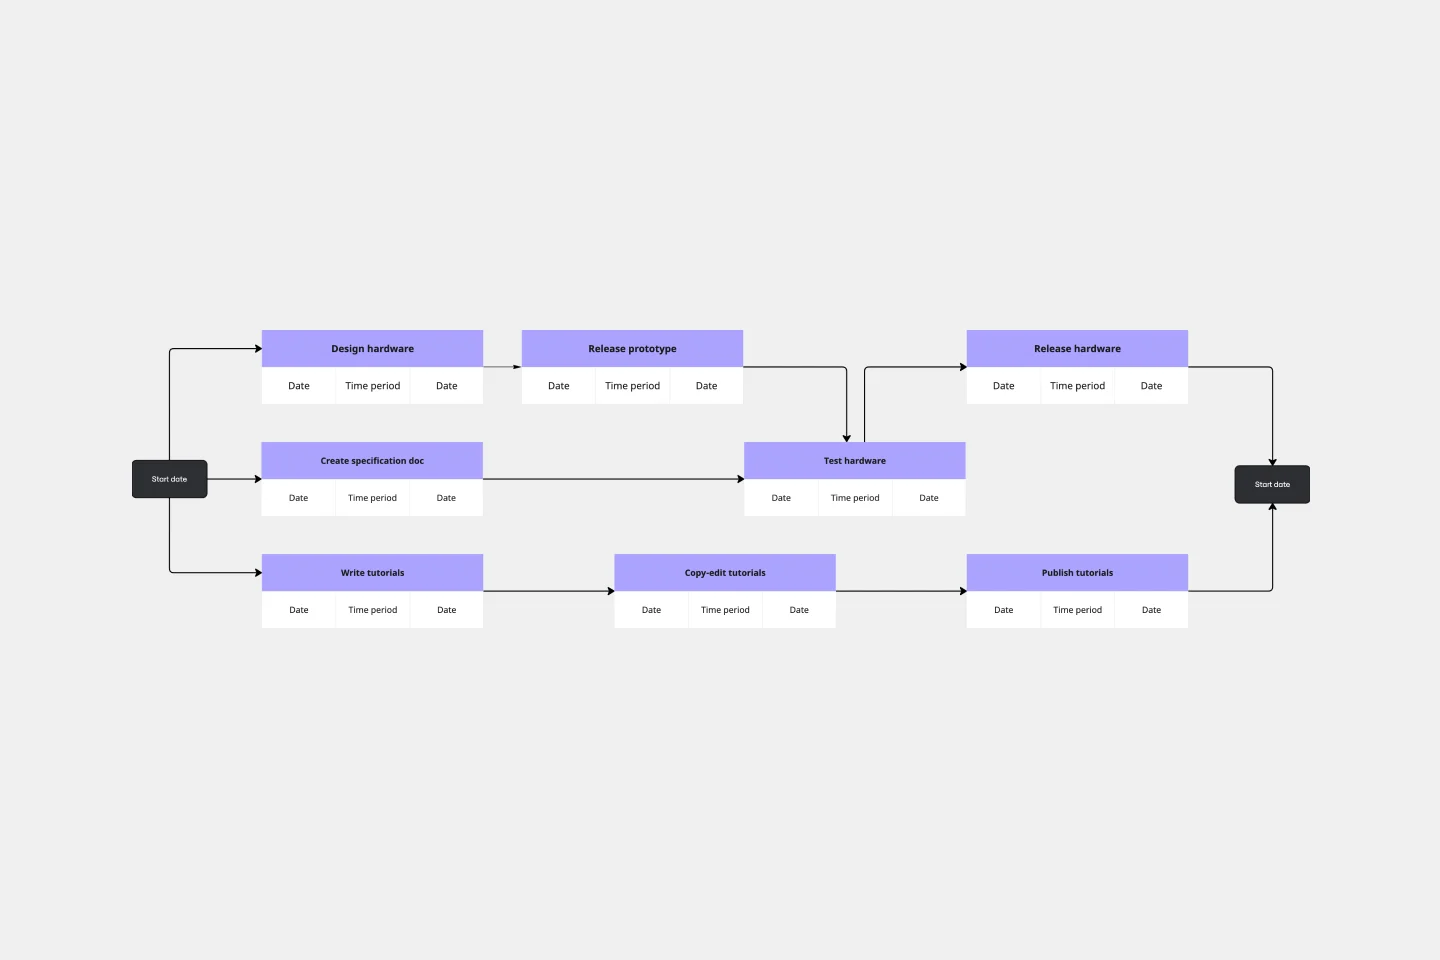
PERT Chart Template
Works best for:
Mapping, Project Planning
A Program Evaluation and Review Technique (PERT) diagram is used to plan projects efficiently. They help you set a clear timeline, plan out tasks and dependencies, and determine a critical path.
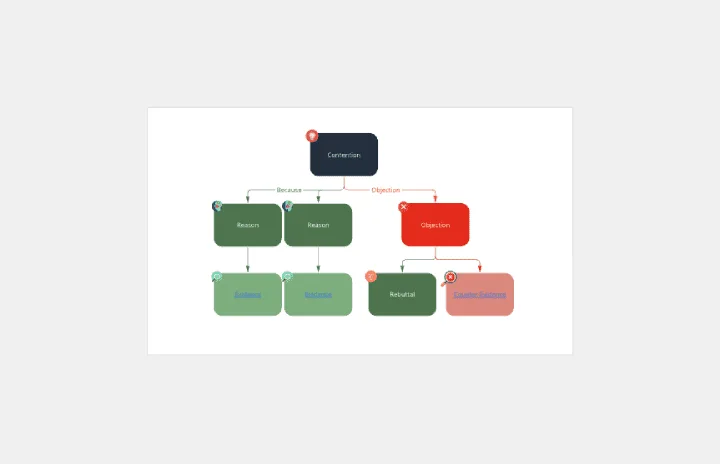
Argument Map
Works best for:
Diagramming
The Argument Map template is a visual tool for structuring and analyzing arguments and debates. It provides a structured framework for capturing premises, conclusions, and logical relationships. This template enables teams to explore complex issues, identify strengths and weaknesses in arguments, and make informed decisions. By promoting clarity and critical thinking, the Argument Map template empowers teams to navigate debates and discussions effectively, fostering consensus and understanding.
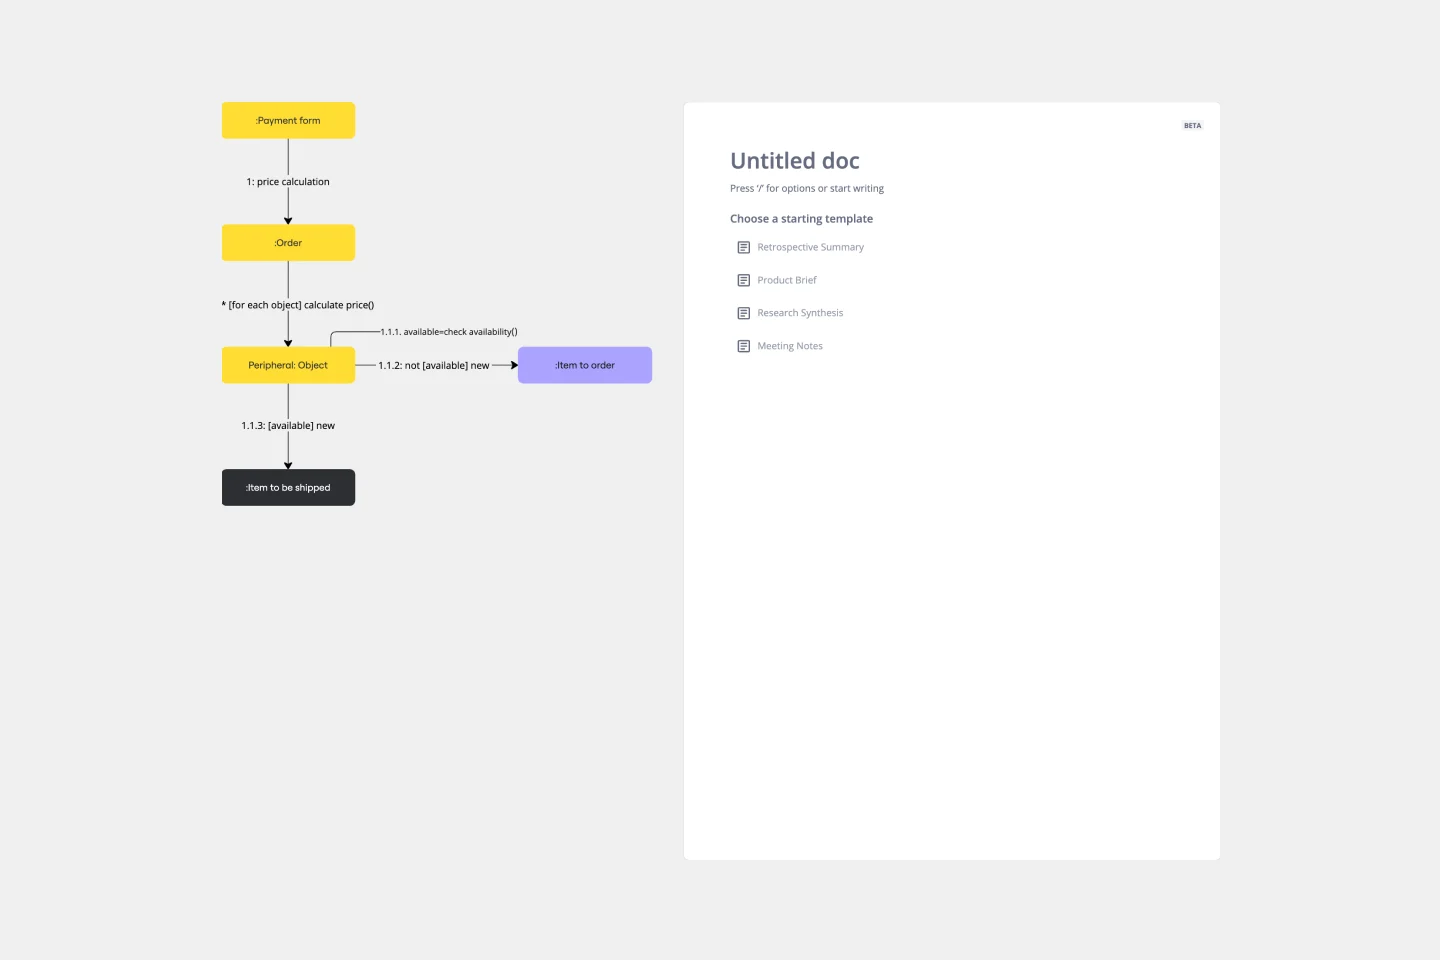
UML Communication Diagram Template
Works best for:
Software Development, Mapping, Diagrams
Most modern programs consist of many moving parts working to a precise set of instructions. With a communication diagram, you can visualize exactly how those parts work together, giving you a clearer understanding of your program as a whole. What’s more, the diagram leaves spaces for expanding the network of relationships as your product grows and evolves. A communication diagram is a vital tool in any software designer’s arsenal.
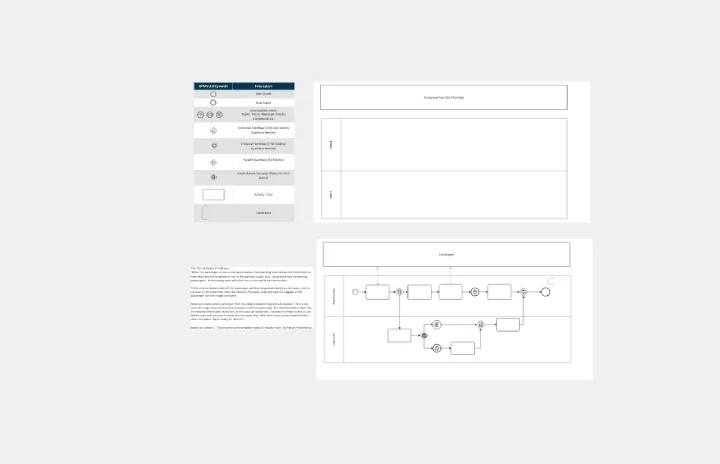
BPMN 2.0
Works best for:
Diagramming
The BPMN 2.0 template offers a visual notation for modeling business processes using the Business Process Model and Notation (BPMN) standard. It provides elements for defining process flows, activities, and decision points. This template enables teams to document and analyze business processes systematically, facilitating process optimization and automation. By promoting standardization and clarity in process modeling, the BPMN 2.0 template empowers organizations to improve efficiency, agility, and compliance in their operations.
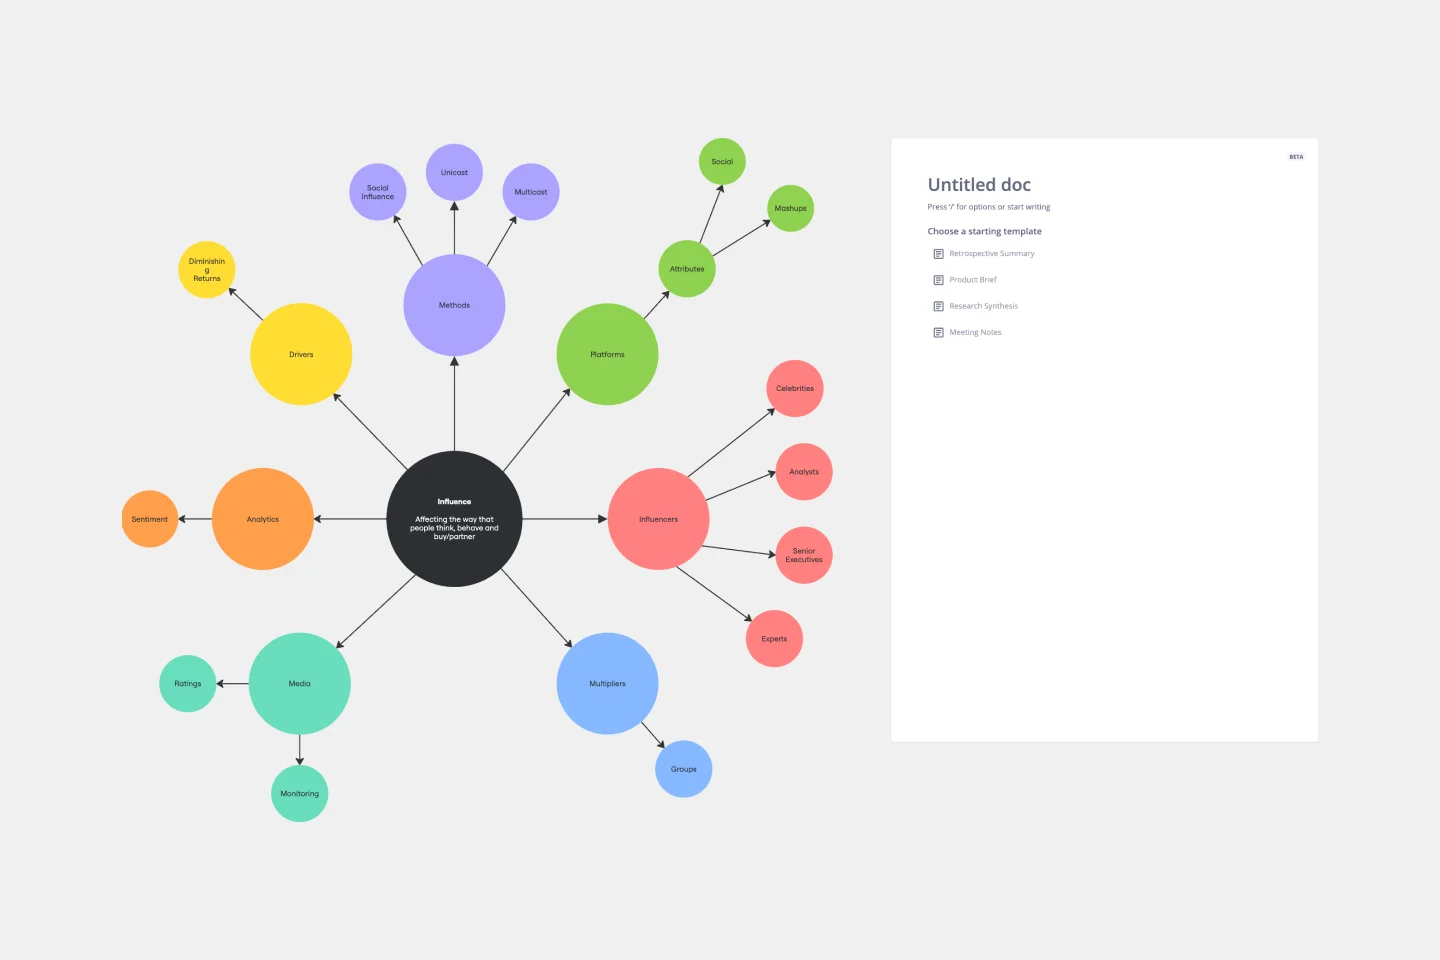
Cluster Diagram Template
Works best for:
Diagramming
The Cluster Diagram Template is a valuable tool for organizing and connecting ideas, concepts, and information in a visually compelling and coherent manner. The template's design centers on grouping related ideas around a core concept, creating a transparent and hierarchical structure. This clustering not only aids in breaking down complex information into manageable segments but also significantly enhances the process of idea generation and brainstorming. A structured yet flexible visual framework encourages deeper engagement and more precise understanding, making it an essential asset for teams and people looking to bring order to their creative and analytical processes.
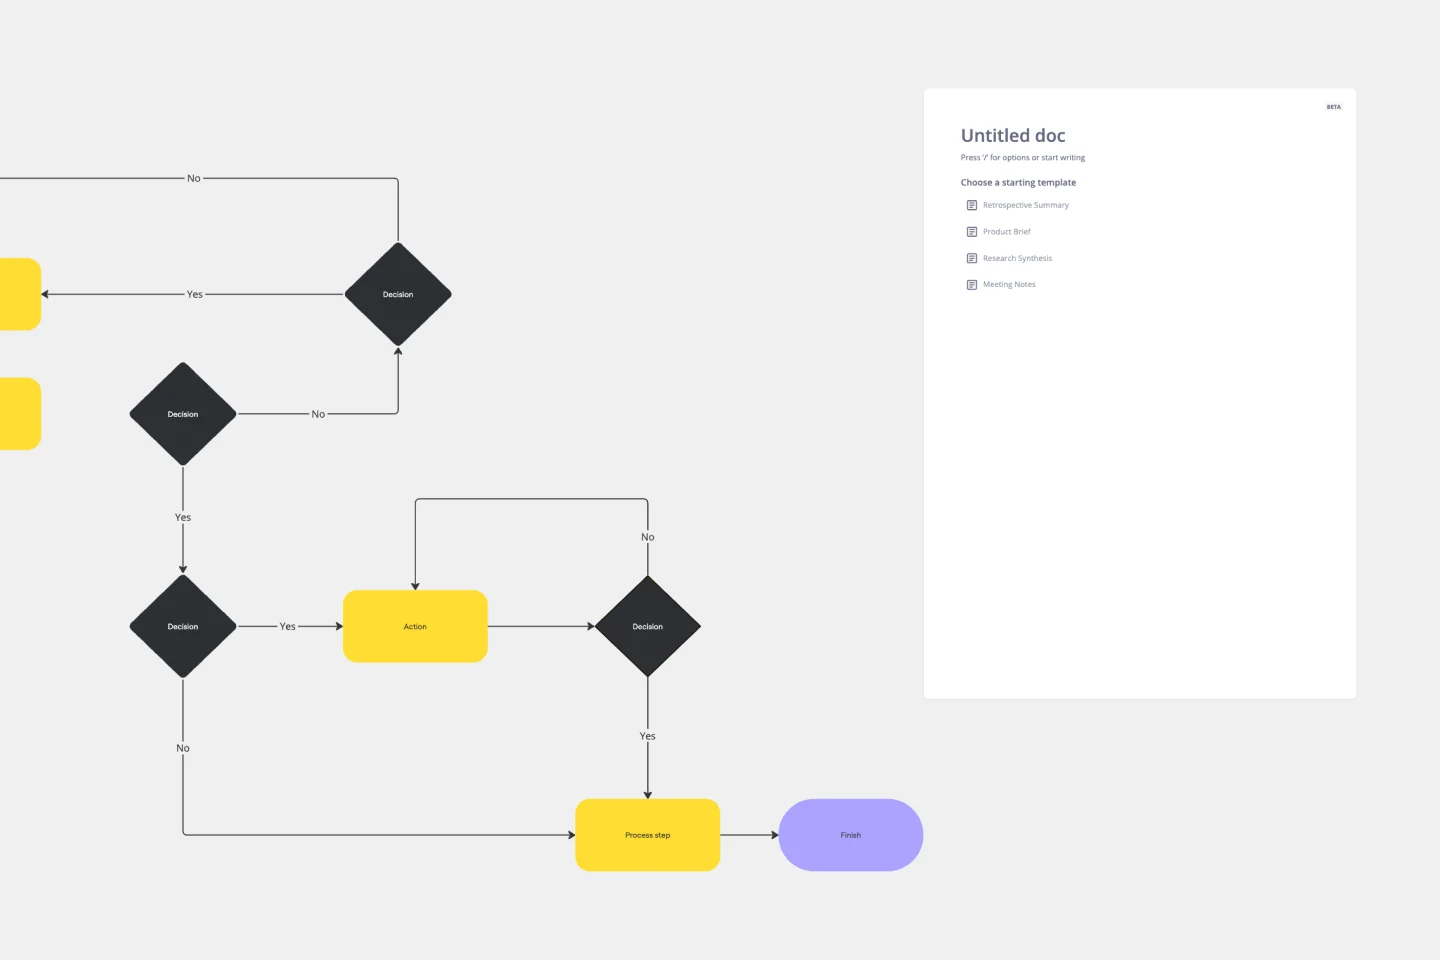
Production Flowchart Template
Works best for:
Flowcharts
The Production Flowchart Template is a well-crafted tool that clearly represents a production process from start to finish. It breaks down complex procedures into easy-to-understand segments, making it easier for stakeholders to grasp the entire process. One of the key benefits of using this template is that it helps to clarify complex production pathways. By mapping out operations visually, teams can identify potential bottlenecks or inefficiencies, facilitating timely and well-informed decision-making.