Cause and Effect Diagram Template
Quickly analyze relationships and identify the root causes within a system with the cause and effect diagram template.
About the Cause and Effect Diagram Template
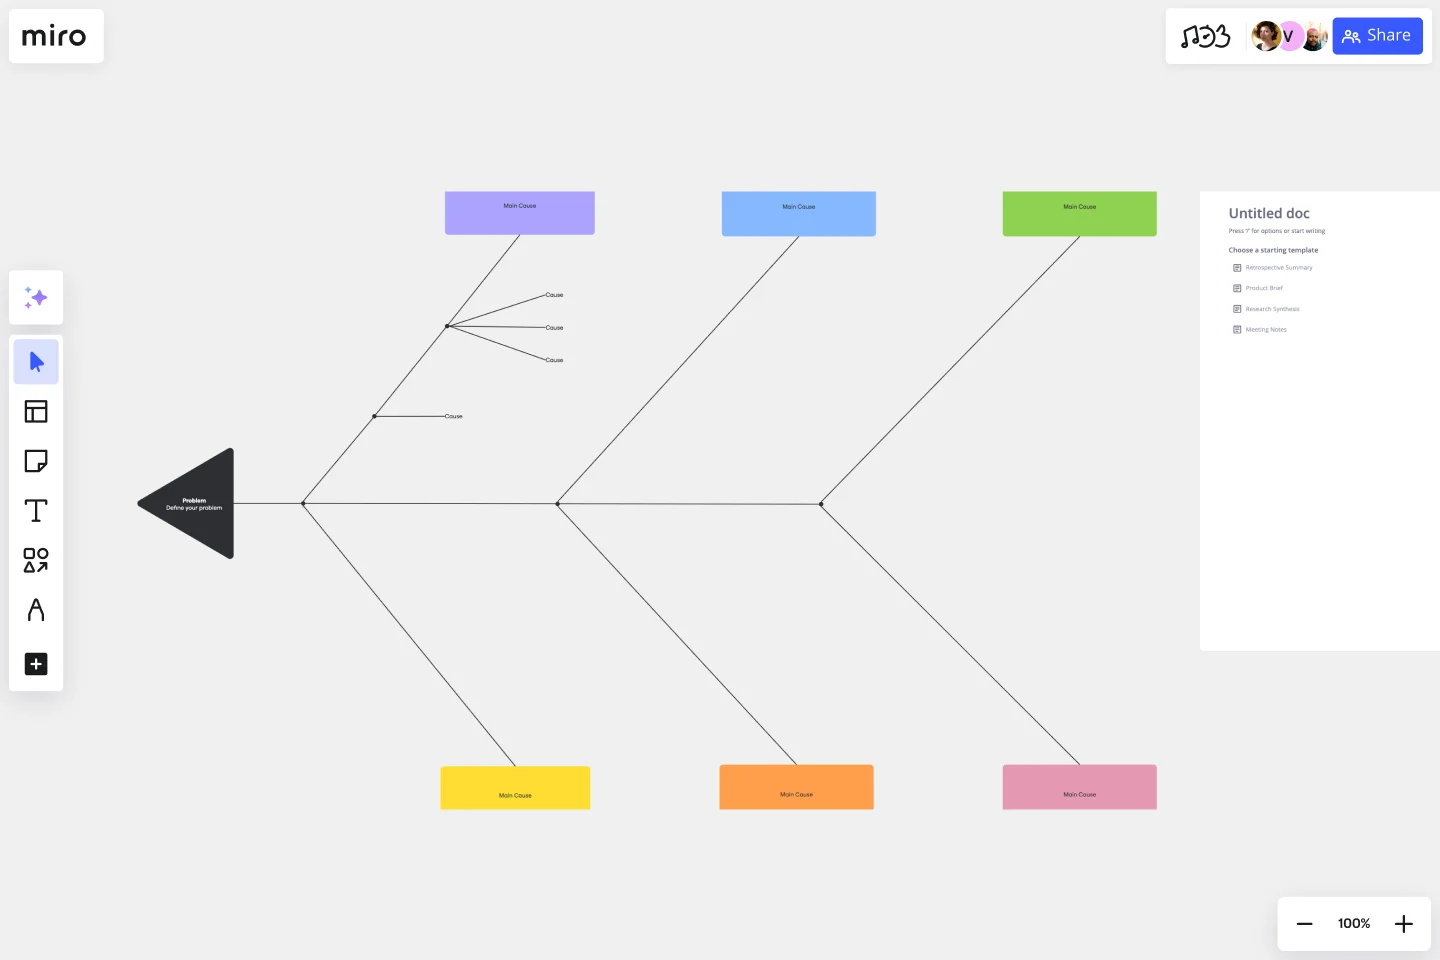
The cause-and-effect diagram template is an effective tool for analyzing complex relationships and identifying the root causes within a system. This template is a more straightforward version of the Fishbone or Ishikawa diagram. It is used to visually represent the cause-and-effect relationships in a structured manner. Whether you are solving problems, improving a process, or troubleshooting, this template provides a systematic approach to identifying and understanding the factors influencing a specific issue.
Understanding the cause and effect diagram template
The cause and effect diagram template categorizes potential causes into branches. Here is how the template is built:
Problem statement: Clearly defines the identified issue as the central focal point for exploring potential causes.
Categories of causes: Organizes potential causes into branches, offering a systematic and categorized approach to analysis.
Main bones: Represents primary categories of causes as main branches extending from the spine of the fishbone diagram.
Sub-branches: Break down each main branch into sub-branches, thoroughly exploring potential causes.
Analysis section: Dedicates space for in-depth analysis, enabling teams to fully explore each cause's impact on the identified problem.
How to use the cause and effect diagram template
Edit with precision: You can customize the template easily by using drag-and-drop functionality. This will help you address your specific problem and its potential causes.
Collaborative analysis: You can engage in real-time collaboration with your team members directly on the Miro board. This will foster collective analysis and brainstorming sessions.
Root cause identification: You can use the template to systematically identify root causes. This will help you gain a thorough understanding of the problem and enable you to solve it effectively.
Why should you use a cause-and-effect diagram template?
Structured problem analysis: Organize and analyze potential causes systematically, providing a structured framework for identifying the root cause of a problem.
Team collaboration: Facilitate collaborative problem-solving sessions, ensuring diverse perspectives contribute to a comprehensive analysis.
Visual clarity: Enhance understanding through visual representation, facilitating comprehension of complex cause-and-effect relationships.
Strategic decision-making: Equip teams with insights to make informed and strategic decisions based on a thorough understanding of the problem's causes.
Process improvement: Drive continuous improvement by systematically addressing root causes enhancing efficiency and effectiveness within processes.
Is there a recommended order for exploring the causes in the template?
While there is no strict order, initiating analysis with main branches and progressively exploring sub-branches for a thorough and structured examination is often beneficial.
Can I export or share the Cause and Effect Diagram created in Miro with stakeholders outside the platform?
Miro offers export and sharing features, allowing users to share the diagram with stakeholders outside the platform for review and collaboration.
Get started with this template right now.
OutSystems Architecture Diagram
Works best for:
Diagramming
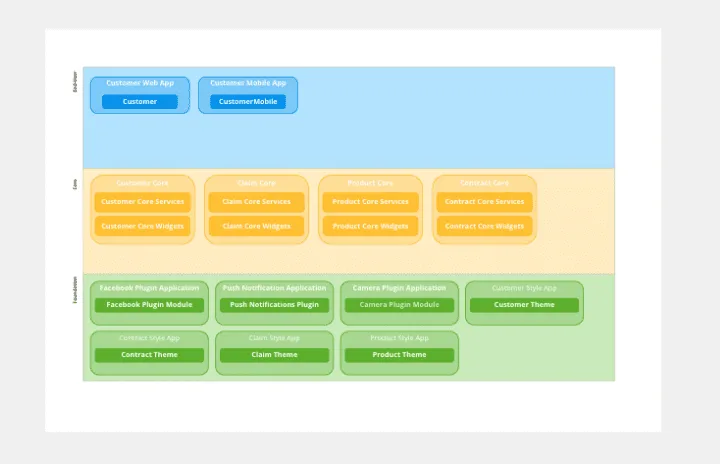
The OutSystems Architecture Diagram template offers a visual tool for designing and documenting software architectures using the OutSystems platform. It provides elements for modeling application components, data structures, and integration points. This template enables teams to visualize and communicate the architecture of their OutSystems applications, facilitating collaboration and alignment among developers and stakeholders. By promoting clarity and understanding of system architecture, the OutSystems Architecture Diagram empowers teams to build scalable, maintainable, and high-performance applications effectively.
Intent to Outcome Diagram
Works best for:
Diagramming
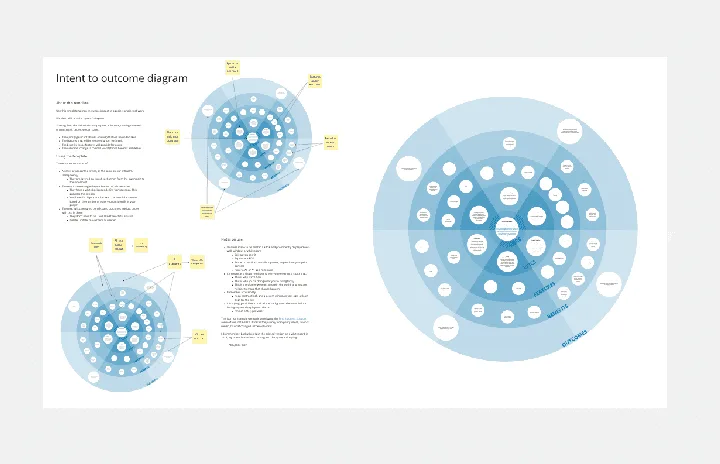
The Intent to Outcome Diagram template is a visual tool for mapping out the relationship between desired outcomes and the actions required to achieve them. It provides a structured framework for defining intentions, outcomes, and key activities. This template enables teams to align on goals, track progress, and identify areas for improvement. By promoting clarity and alignment, the Intent to Outcome Diagram empowers organizations to set strategic direction and drive results effectively.
Miro x AWS: Accelerate your cloud journey
Works best for:
Diagramming
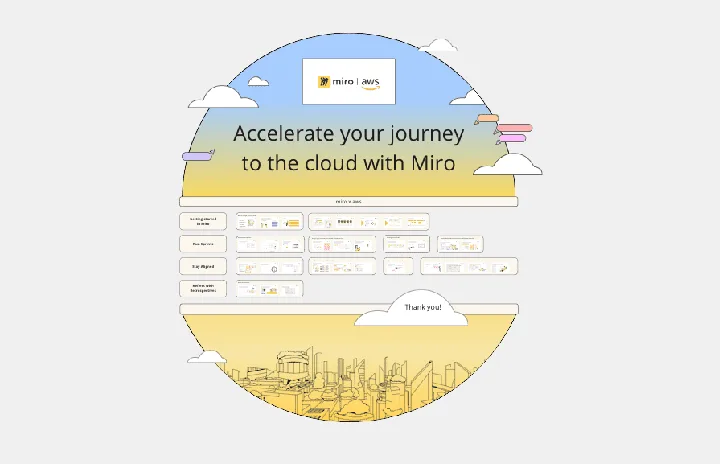
The Miro x AWS: Accelerate your cloud journey template offers a visual framework for planning and executing cloud migration and optimization projects using Amazon Web Services (AWS). It provides elements for mapping out cloud architectures, migration strategies, and cost optimization initiatives. This template enables teams to collaborate effectively, align on objectives, and accelerate their cloud journey with AWS services. By promoting collaboration and alignment, the Miro x AWS template empowers organizations to leverage AWS cloud technologies efficiently and achieve their business objectives effectively.
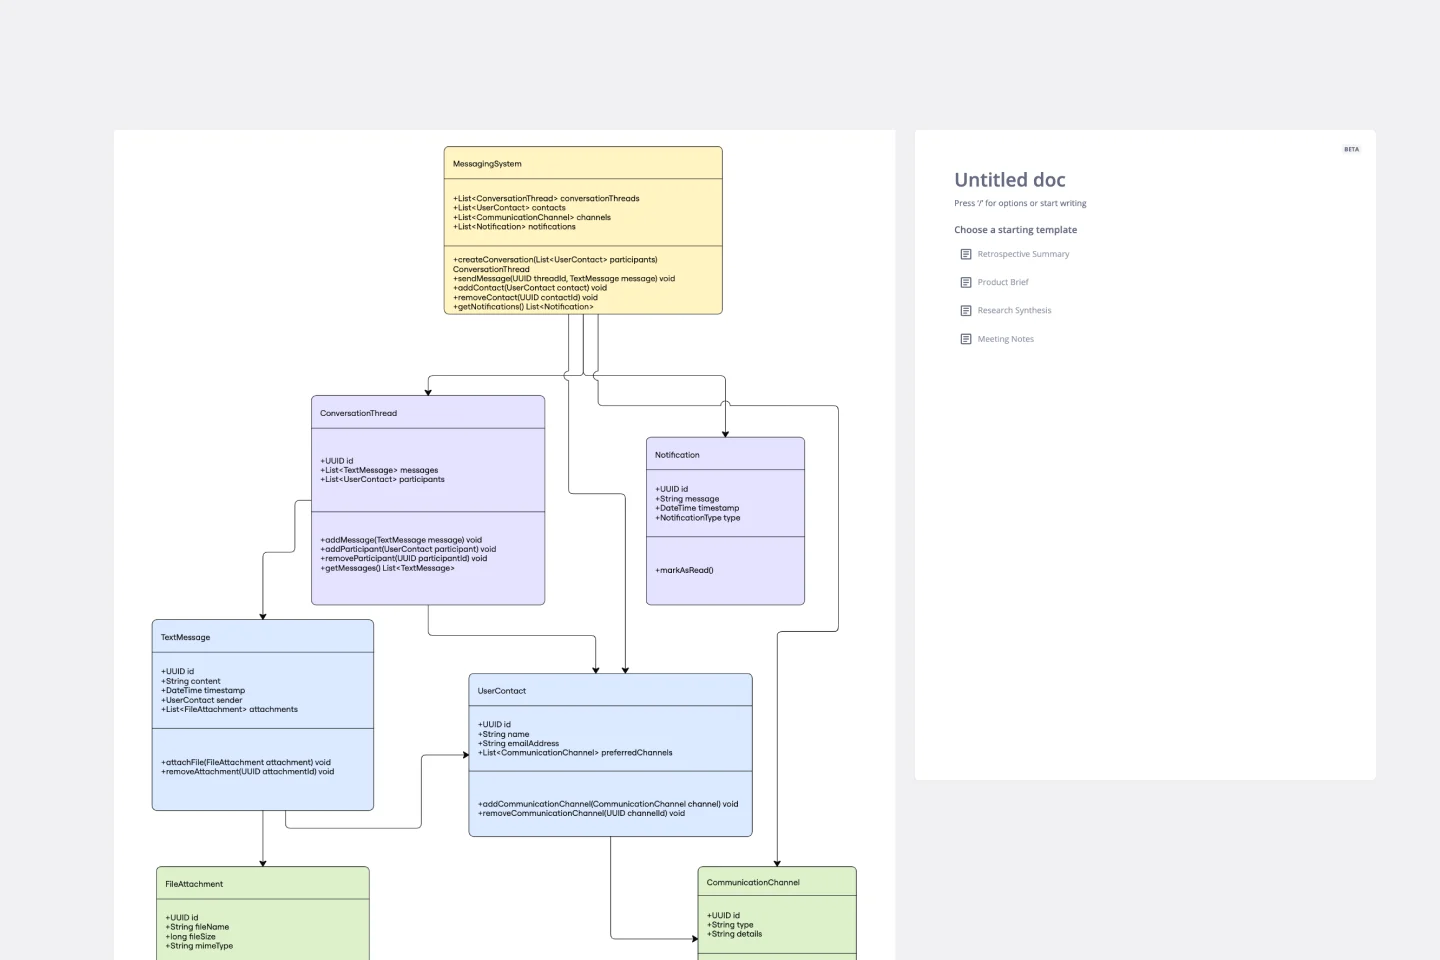
UML Class Messaging System Template
Works best for:
UML
The UML Class Messaging System Template streamlines the process of designing and analyzing messaging systems. It allows users to visually map out the structure of a system by detailing classes, their attributes, operations, and the relationships among objects. This template is particularly useful for illustrating the functionality of a messaging system, including the management of text messages, conversation threads, user contacts, notifications, and channels. It offers a clear visual representation of how all these elements interact within the system, making it an invaluable resource for developers, designers, and stakeholders aiming to enhance communication and reduce errors in the development phase.
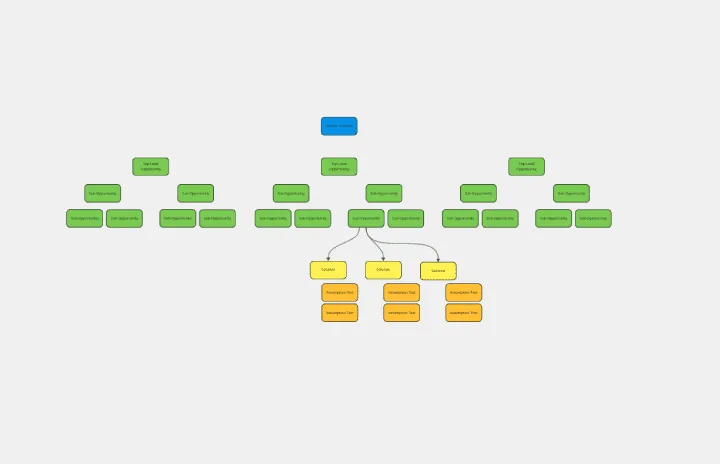
Opportunity Solution Tree
Works best for:
Diagramming
The Opportunity Solution Tree template is a visual tool for identifying and prioritizing opportunities and solutions. It provides a structured framework for mapping customer needs, pain points, and potential solutions. This template enables teams to explore divergent ideas, evaluate alternatives, and focus on high-impact solutions. By promoting customer-centricity and innovation, the Opportunity Solution Tree empowers teams to address market needs effectively and deliver value-driven solutions.
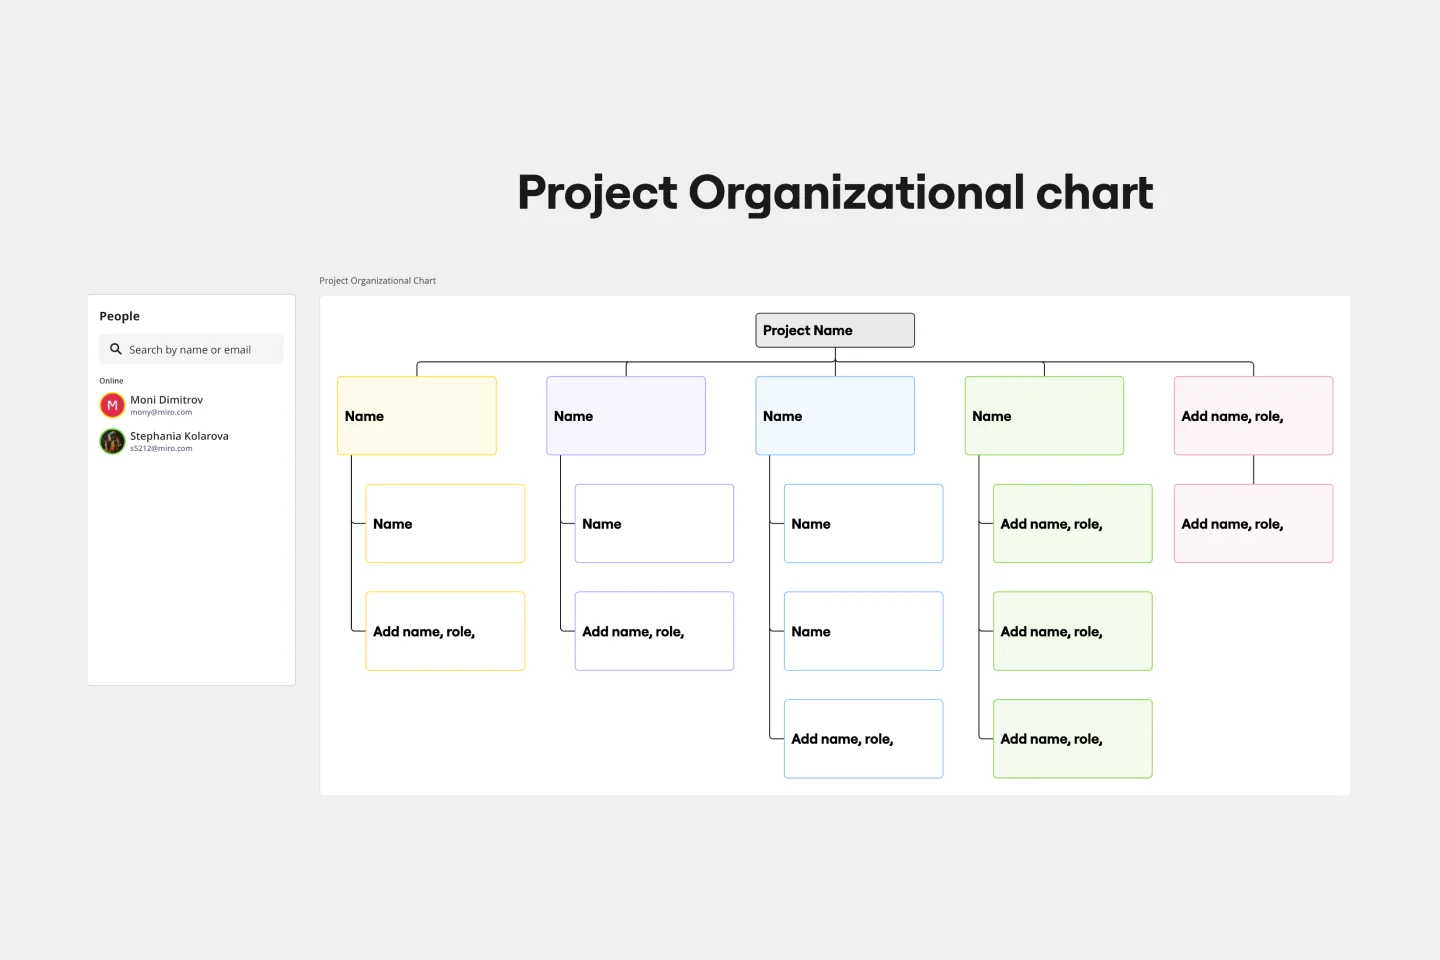
Project Organizational Chart Template
Works best for:
Project Management, Documentation, Org Charts
When you’re embarking on a long, complex project, you will inevitably hit roadblocks and obstacles. It’s important to have your project organizational chart on hand to overcome those challenges. A project organizational chart is a visual diagram that illustrates who is on your team and the role they play in a given project. It documents the structure of the project organization, the hierarchy between team members, and the relationships between employees. Project organizational charts are useful tools for clarifying who does what, securing buy-in, and setting expectations for the group.