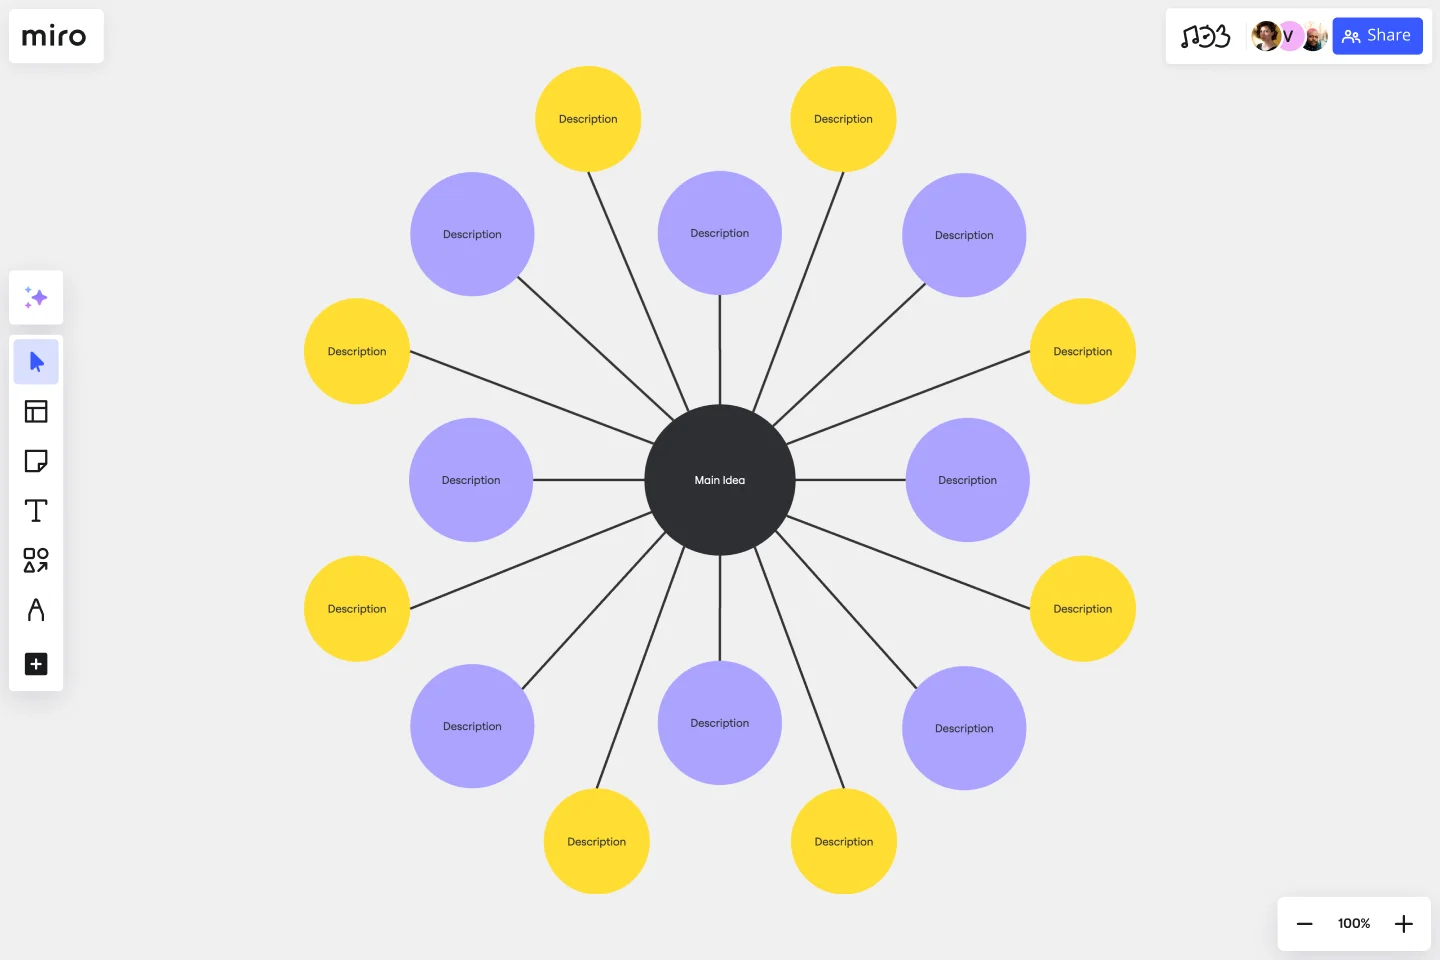
Bubble Map Template
Map ideas and data points quickly with a Bubble Map Template. Streamline complex information, promoting efficient decision-making in every project across your organization.
About the Bubble Map Template
The Bubble Map Template stands out in data visualization and idea organization as an adaptable and easy-to-use tool. It allows you to arrange your thoughts, processes, or data in a visually appealing and understandable format, boosting efficiency and clarity. Whether brainstorming, strategizing, or presenting, use the Bubble Map Template as your go-to solution for turning complex ideas into clear visual narratives.
What's a Bubble Map Template?
A Bubble Map Template is a diagramming tool used for visually organizing information. The diagram uses varying-sized circles or "bubbles" to represent concepts and lines to denote relationships or connections between them. It's a great tool for understanding complex systems, brainstorming ideas, or visualizing hierarchies and relationships.
Why should you use it?
Bubble maps help streamline thoughts, ideas, and information in an easily digestible format. They encourage critical thinking and facilitate understanding of relationships and patterns within complex data.
How to use a Bubble Map Template in Miro?
The Bubble Map Template in Miro offers a streamlined way to visually organize your ideas or data. Here's a quick guide to creating your Bubble Map:
Select the Bubble Map Template: Click on "Use template." The template will then be loaded onto your Miro board.
Edit the bubbles: Click on the template, and a text box will appear in the context menu bar. This will allow you to edit the central bubble or main idea. For resizing, click and drag the circle's edge. In the context menu, change the color of the bubbles and lines, adjust the font size and style within the bubbles, and even add icons or images to make your bubble map more visually engaging.
Auto-arrange and align: If you're dealing with many bubbles, Miro's auto-arrange and align feature can help you keep your map neat and readable.
Remember that you can invite others to collaborate on your bubble map in real-time, making it the ultimate bubble map maker and an excellent tool for brainstorming sessions, project planning, or team meetings. Enjoy visually mapping your thoughts and ideas with Miro's Bubble Map Template.
Can I collaborate with my team on a Bubble Map in real time?
Yes. Miro's collaborative features allow multiple users to work on the same Bubble Map simultaneously. Team members can add their input, make changes, and leave comments in real time, promoting dynamic and efficient collaboration.
Can I share my Bubble Map with others?
Absolutely. Miro lets you share your Bubble Map in several ways – via a link, email, or even embedded on a website. You can control whether recipients can view, comment or edit your map.
Can I use the Bubble Map Template offline?
Miro primarily operates online to enable real time collaboration. However, you can export your Bubble Map Template as a PNG, JPEG, or PDF file to view offline.
Get started with this template right now.
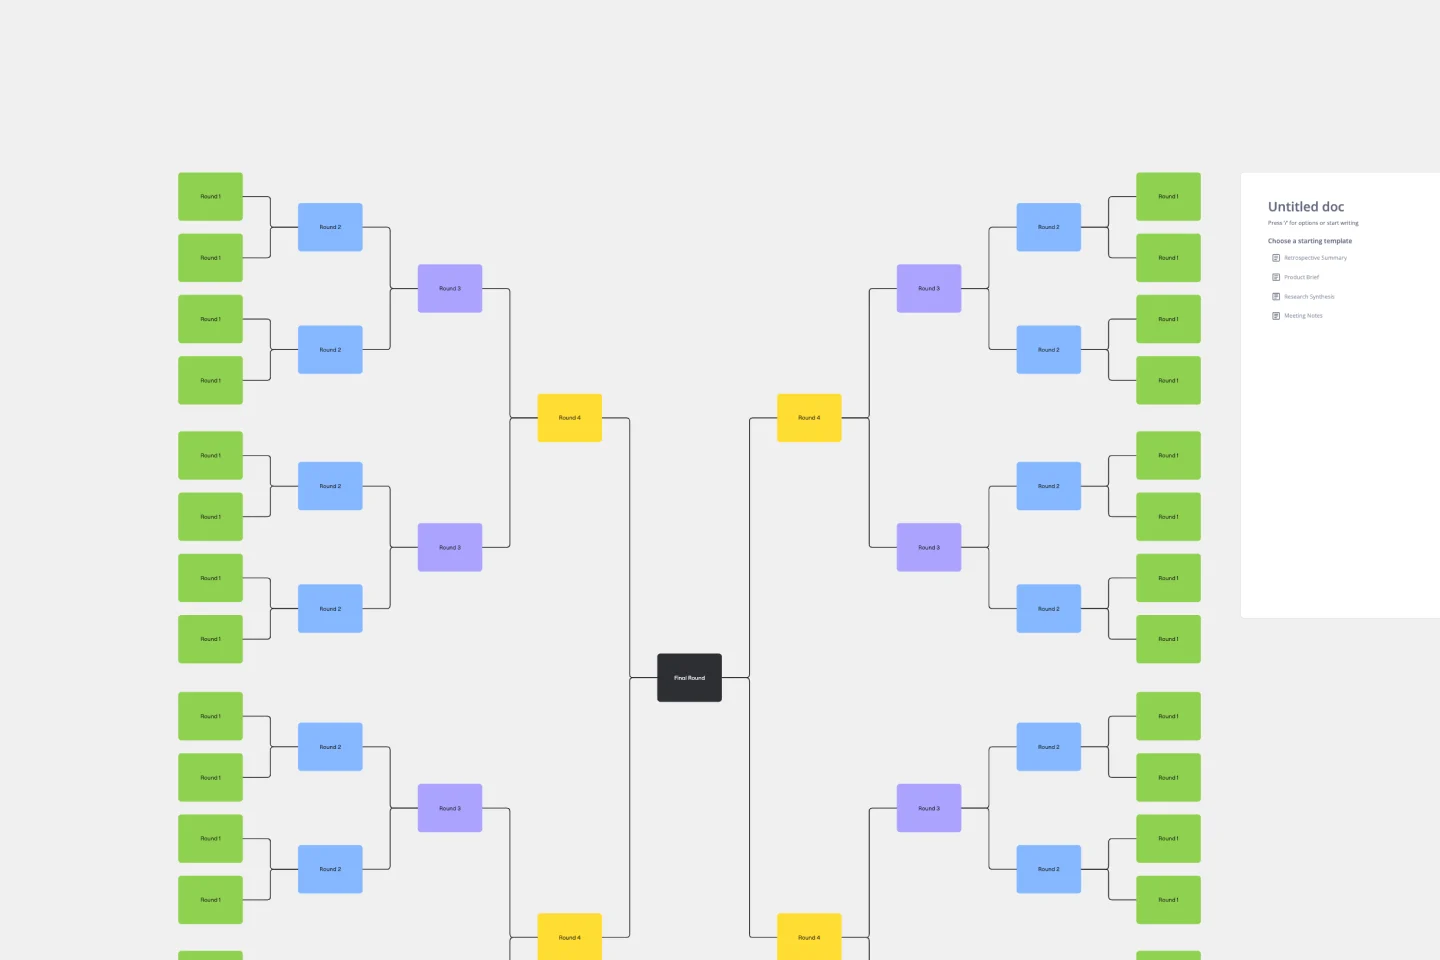
Bracket Template
Works best for:
Diagramming
The Bracket Template is a dynamic visualization tool that helps to organize and rank ideas, entities, or teams in a sequential and competitive manner. It is structured like a tree, starting with multiple entries on either side, which then face off in successive rounds, leading to a single winner or conclusion. One of its standout benefits is its ability to simplify complex decision-making processes. Breaking down choices into smaller, head-to-head comparisons, makes the path to a final decision clearer, ensuring clarity and fostering engagement among participants. Moreover, the Bracket Template is particularly useful when there are multiple options to consider and when there is a need to compare and contrast those options. It is an effective way to streamline decision-making, making it easier and more efficient.
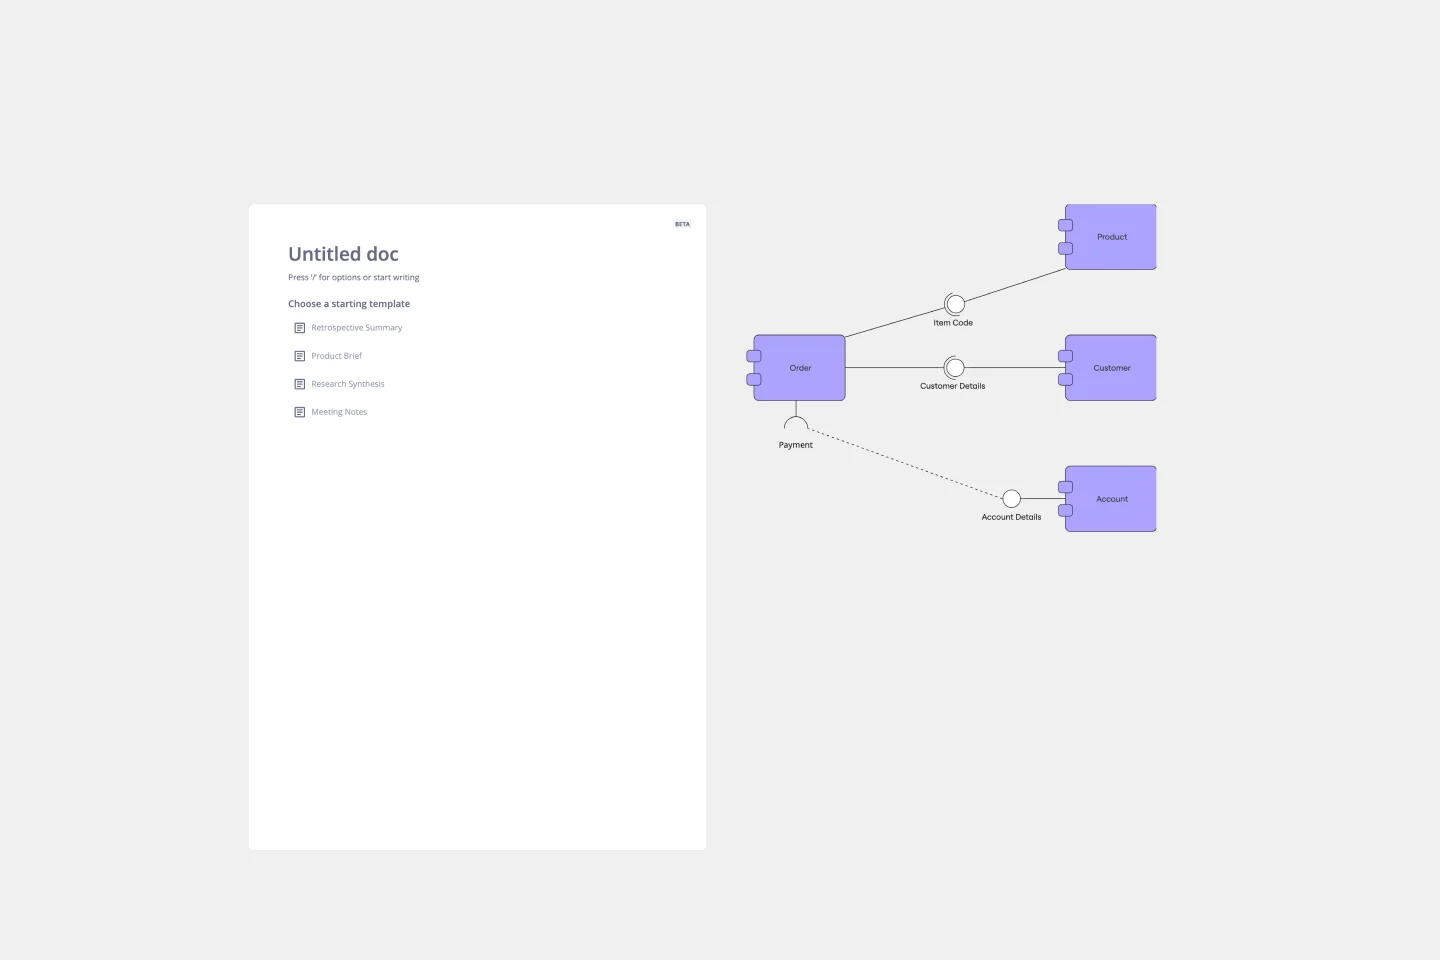
UML Component Diagram Template
Works best for:
Mapping, Diagrams, Software Development
Use our Component Diagram template to show how a system’s physical components are organized and wired together. Visualize implementation details, make sure planned development matches system needs, and more — all in a collaborative environment.
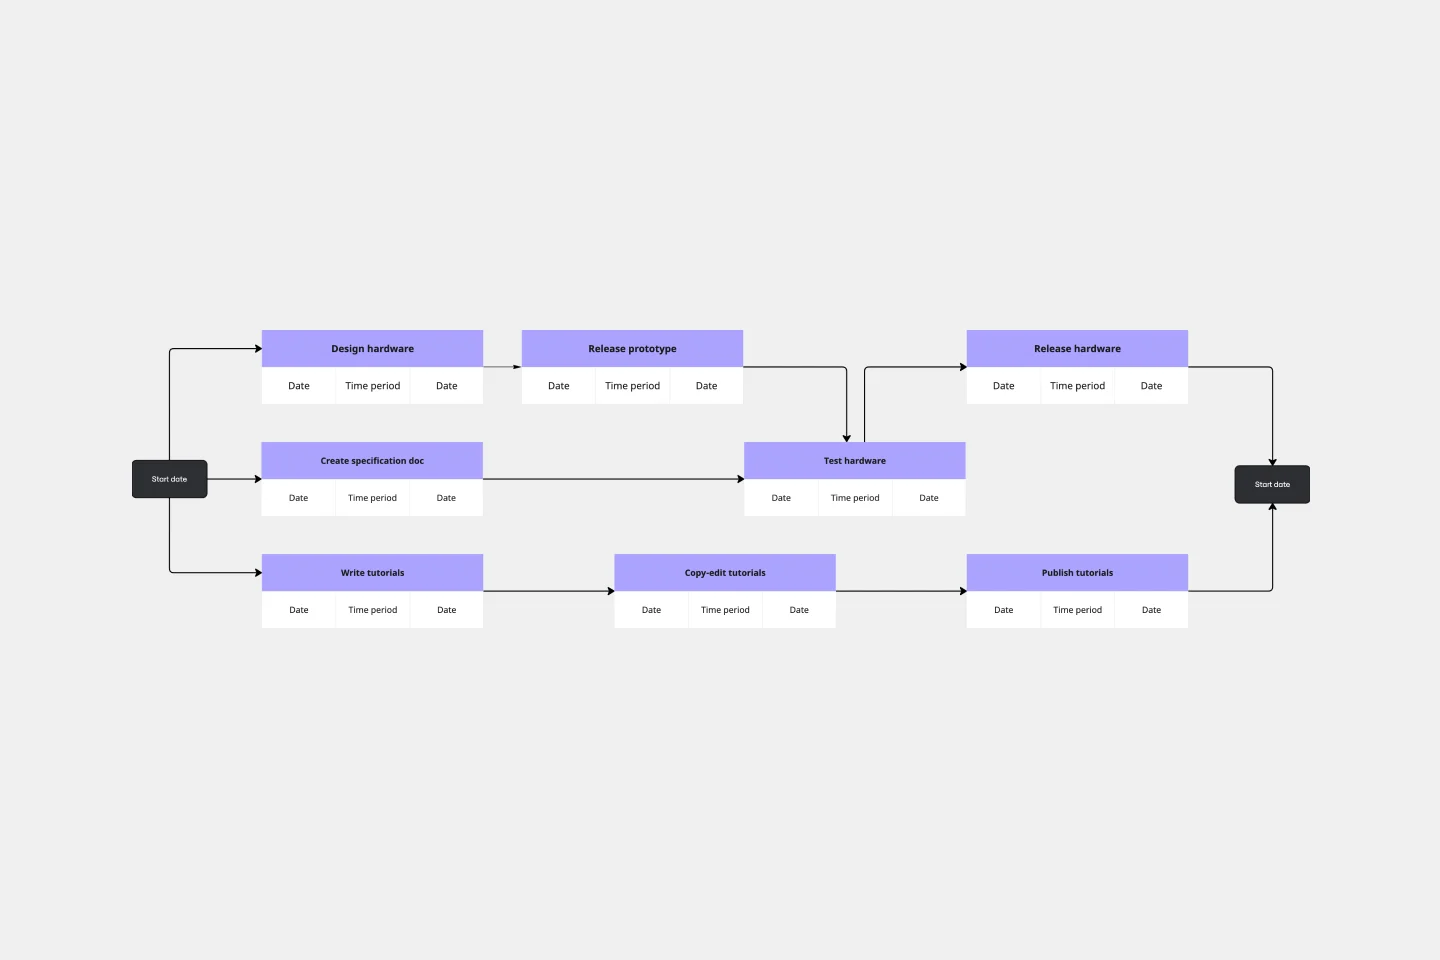
PERT Chart Template
Works best for:
Mapping, Project Planning
A Program Evaluation and Review Technique (PERT) diagram is used to plan projects efficiently. They help you set a clear timeline, plan out tasks and dependencies, and determine a critical path.
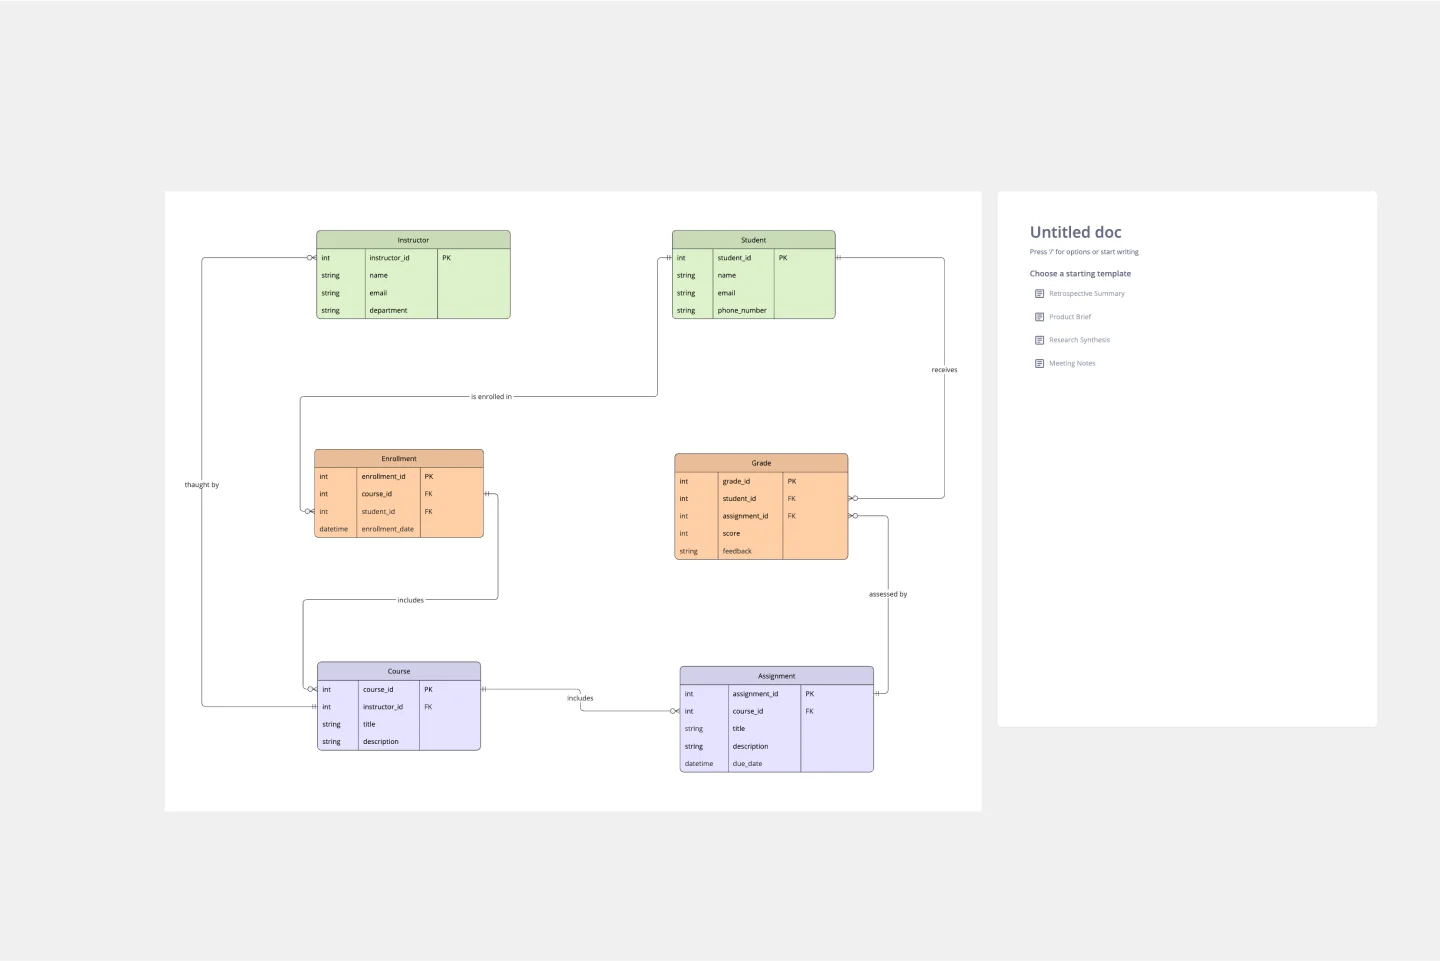
ERD Educational Learning Management System Template
Works best for:
ERD
The ERD Educational Learning Management System Template is designed to streamline the management and organization of educational systems, particularly useful for institutions adapting to online and hybrid learning environments. It helps in efficiently planning and implementing Learning Management System (LMS) features by identifying key entities such as Students, Courses, Instructors, Assignments, and Grades, and the relationships between them.
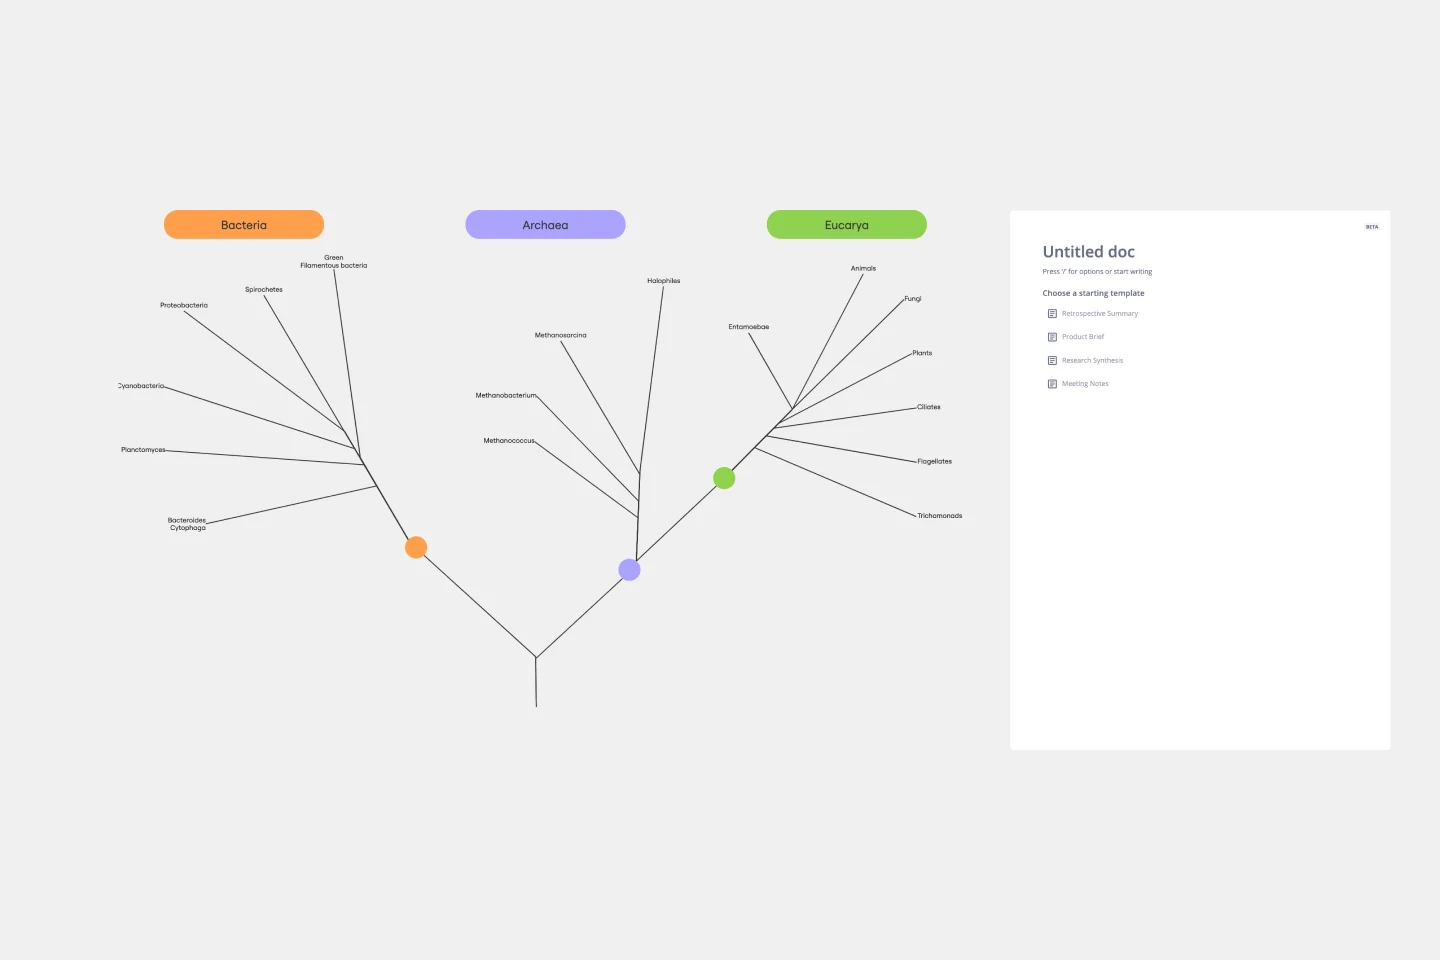
Phylogenetic Tree Template
Works best for:
Diagramming
The Phylogenetic Tree Template is a powerful tool that allows scientists and researchers to visualize evolutionary relationships between species. It is a visual representation of the history of the evolution of life on Earth and helps users identify the relationships between other organisms and their ancestors. The key benefit of this template is that it organizes complex data and makes it more understandable to everyone. Additionally, it offers an efficient way to collect and analyze data, saving time and effort and enabling users to identify significant patterns and relationships in the data.
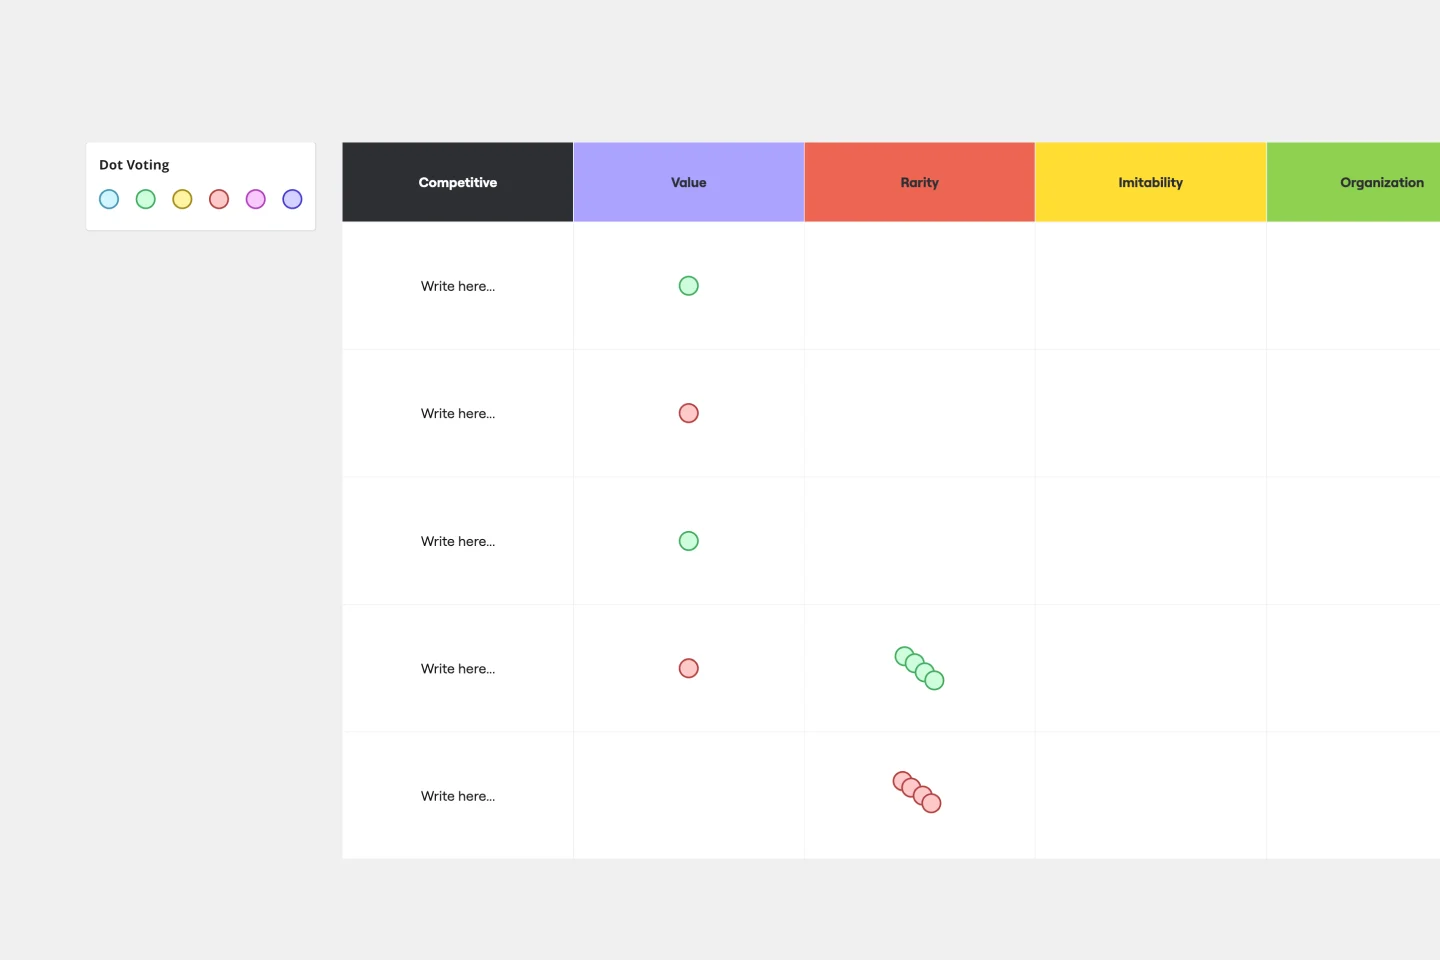
VRIO Analysis Template
Works best for:
Diagramming, Strategy
The VRIO Analysis Template is a framework that helps businesses evaluate their resources and capabilities for competitive advantage. It categorizes resources into four areas: Value, Rarity, Imitability, and Organization. This provides a comprehensive view of an organization's strengths and potential weaknesses. The template has the key benefit of offering quick visual insights. Decision-makers can immediately identify and focus on resources that are valuable, rare, hard to imitate, and well-organized. This ensures a sustainable competitive edge and saves time by avoiding lengthy textual analyses.