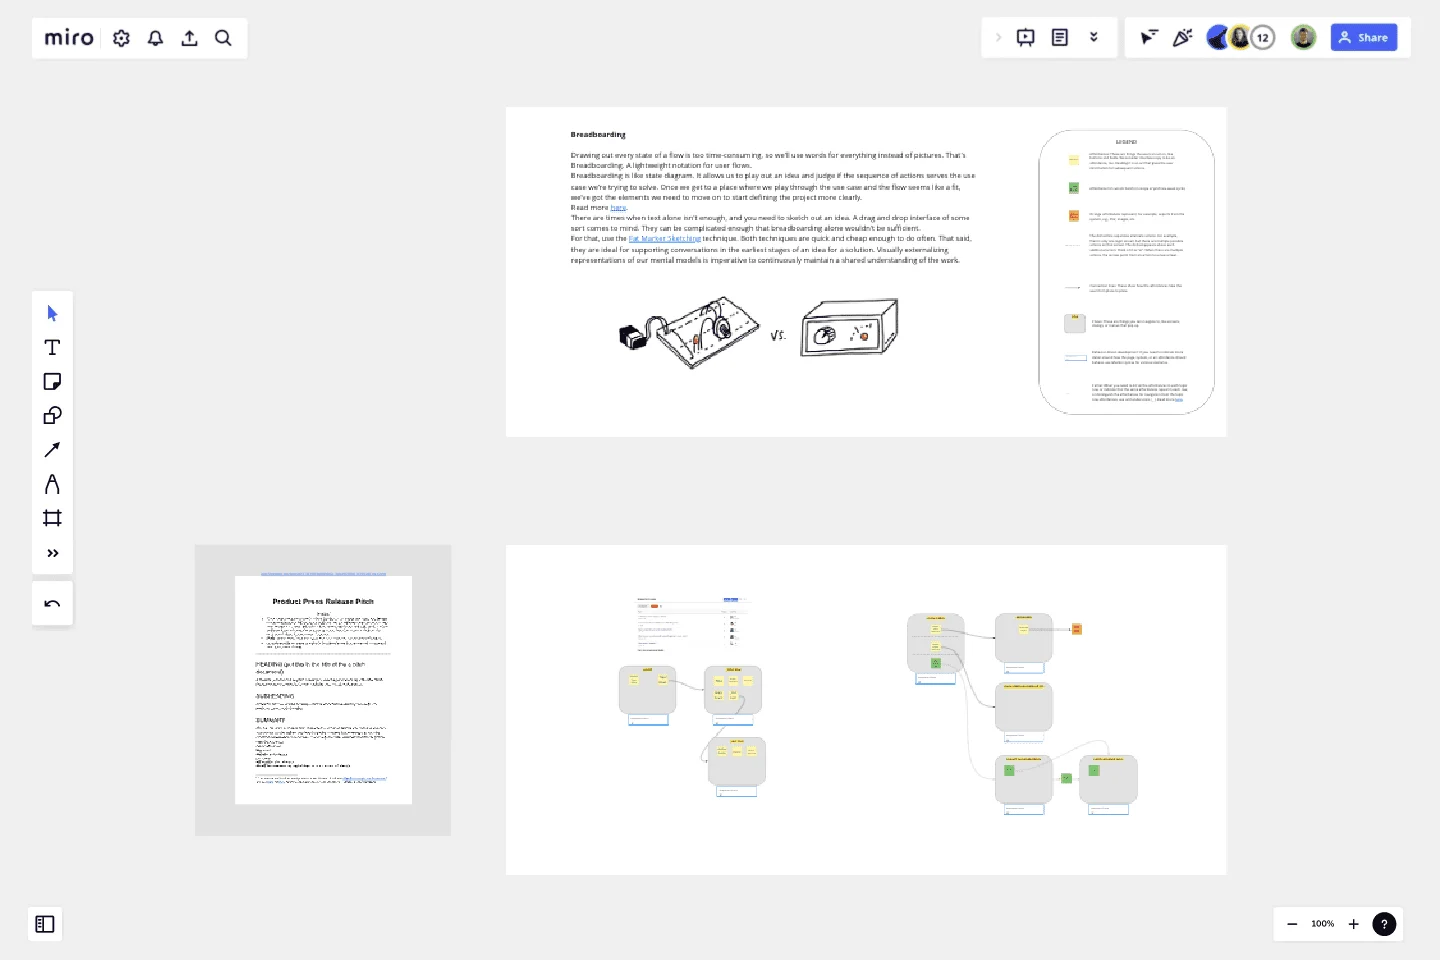
Breadboard (UI Flow Diagram)
Drawing out every state of a flow is too time-consuming, so we’ll use words for everything instead of pictures. That's Breadboarding. A lightweight notation for user flows.
Breadboarding is like state diagram. It allows us to play out an idea and judge if the sequence of actions serves the use case we’re trying to solve. Once we get to a place where we play through the use case and the flow seems like a fit, we’ve got the elements we need to move on to start defining the project more clearly.
There are times when text alone isn't enough, and you need to sketch out an idea. A drag and drop interface of some sort comes to mind. They can be complicated enough that breadboarding alone wouldn't be sufficient.
For that, use the Fat Marker Sketching technique. Both techniques are quick and cheap enough to do often. That said, they are ideal for supporting conversations in the earliest stages of an idea for a solution. Visually externalizing representations of our mental models is imperative to continuously maintain a shared understanding of the work.
This template was created by Matt Lane.
Get started with this template right now.

Miro x AWS: Accelerate your cloud journey
Works best for:
Diagramming
The Miro x AWS: Accelerate your cloud journey template offers a visual framework for planning and executing cloud migration and optimization projects using Amazon Web Services (AWS). It provides elements for mapping out cloud architectures, migration strategies, and cost optimization initiatives. This template enables teams to collaborate effectively, align on objectives, and accelerate their cloud journey with AWS services. By promoting collaboration and alignment, the Miro x AWS template empowers organizations to leverage AWS cloud technologies efficiently and achieve their business objectives effectively.
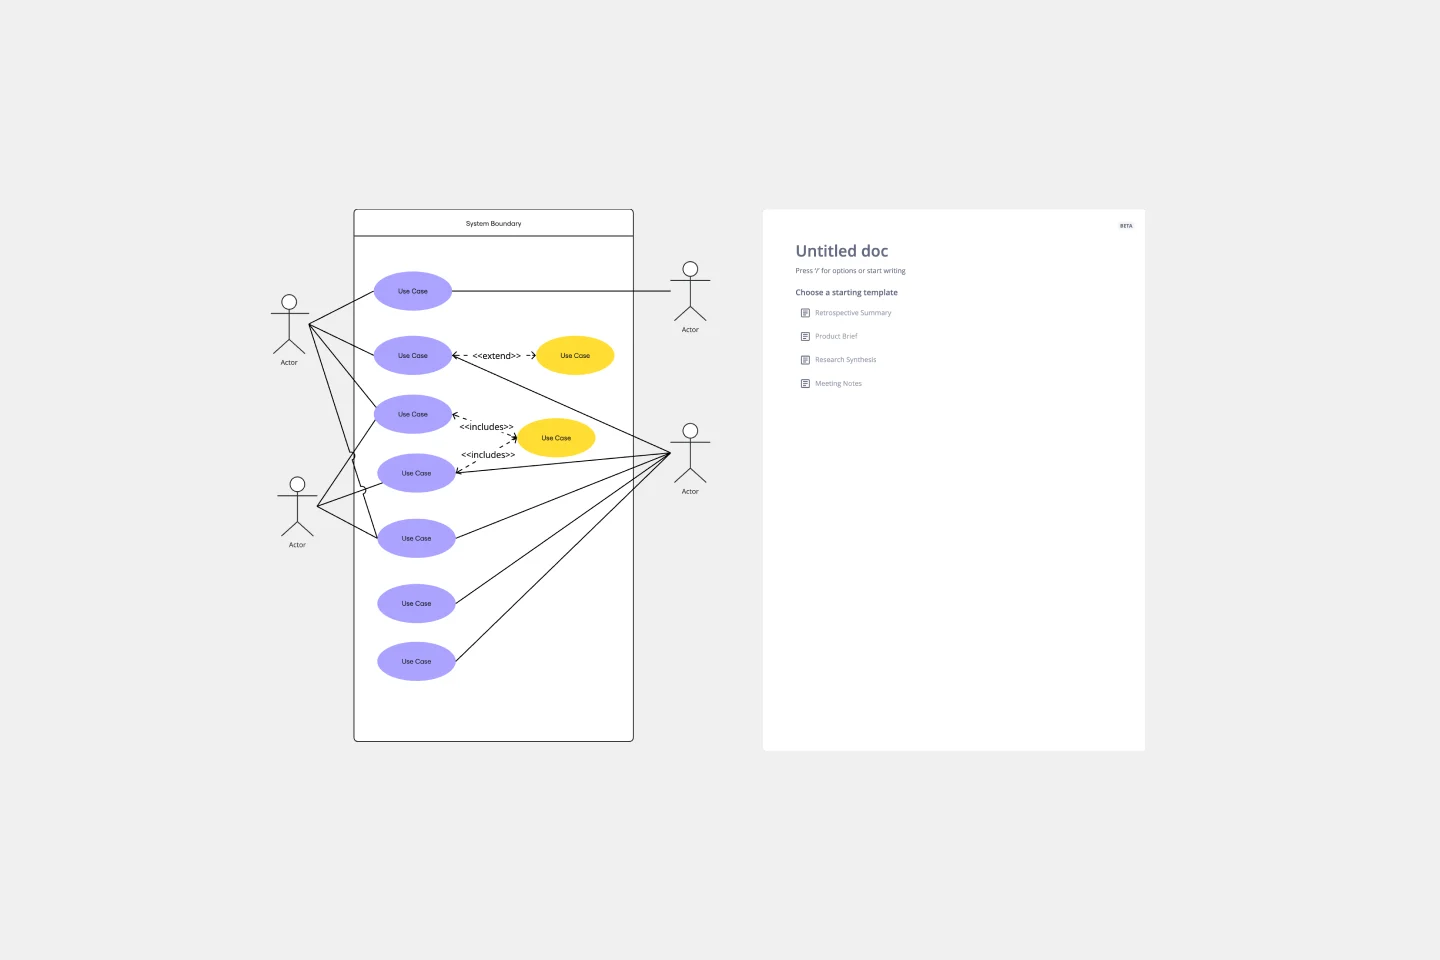
Use Case Diagram Template
Works best for:
Marketing, Market Research, Diagrams
A use case diagram is a visual tool that helps you analyze the relationships between personas and use cases. Use case diagrams typically depict the expected behavior of the system: what will happen and when. A use case diagram is helpful because it allows you to design a system from the perspective of the end user. It’s a valuable tool for communicating your desired system behavior in the language of the user, by specifying all externally visible system behavior.
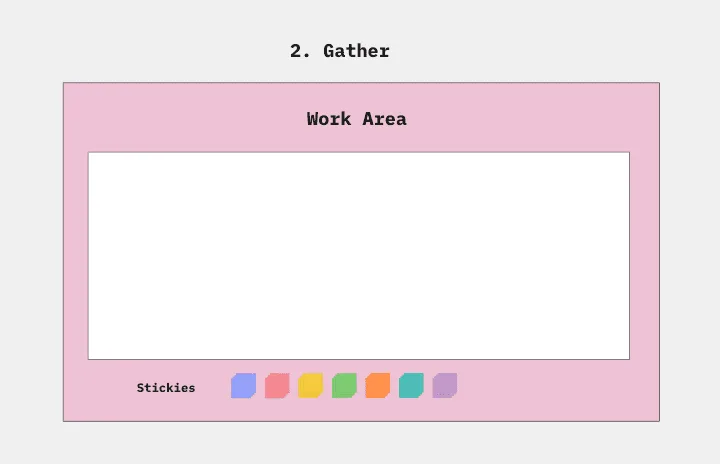
Affinity Diagram by UserPeek
Works best for:
Diagramming
The Affinity Diagram template is a visual tool for organizing and categorizing ideas, data, or issues into related groups. It provides a structured framework for conducting group brainstorming and affinity grouping activities. This template enables teams to synthesize information, identify patterns, and generate insights collaboratively. By promoting creativity and collaboration, the Affinity Diagram empowers teams to organize and prioritize information effectively, driving decision-making and problem-solving processes efficiently.
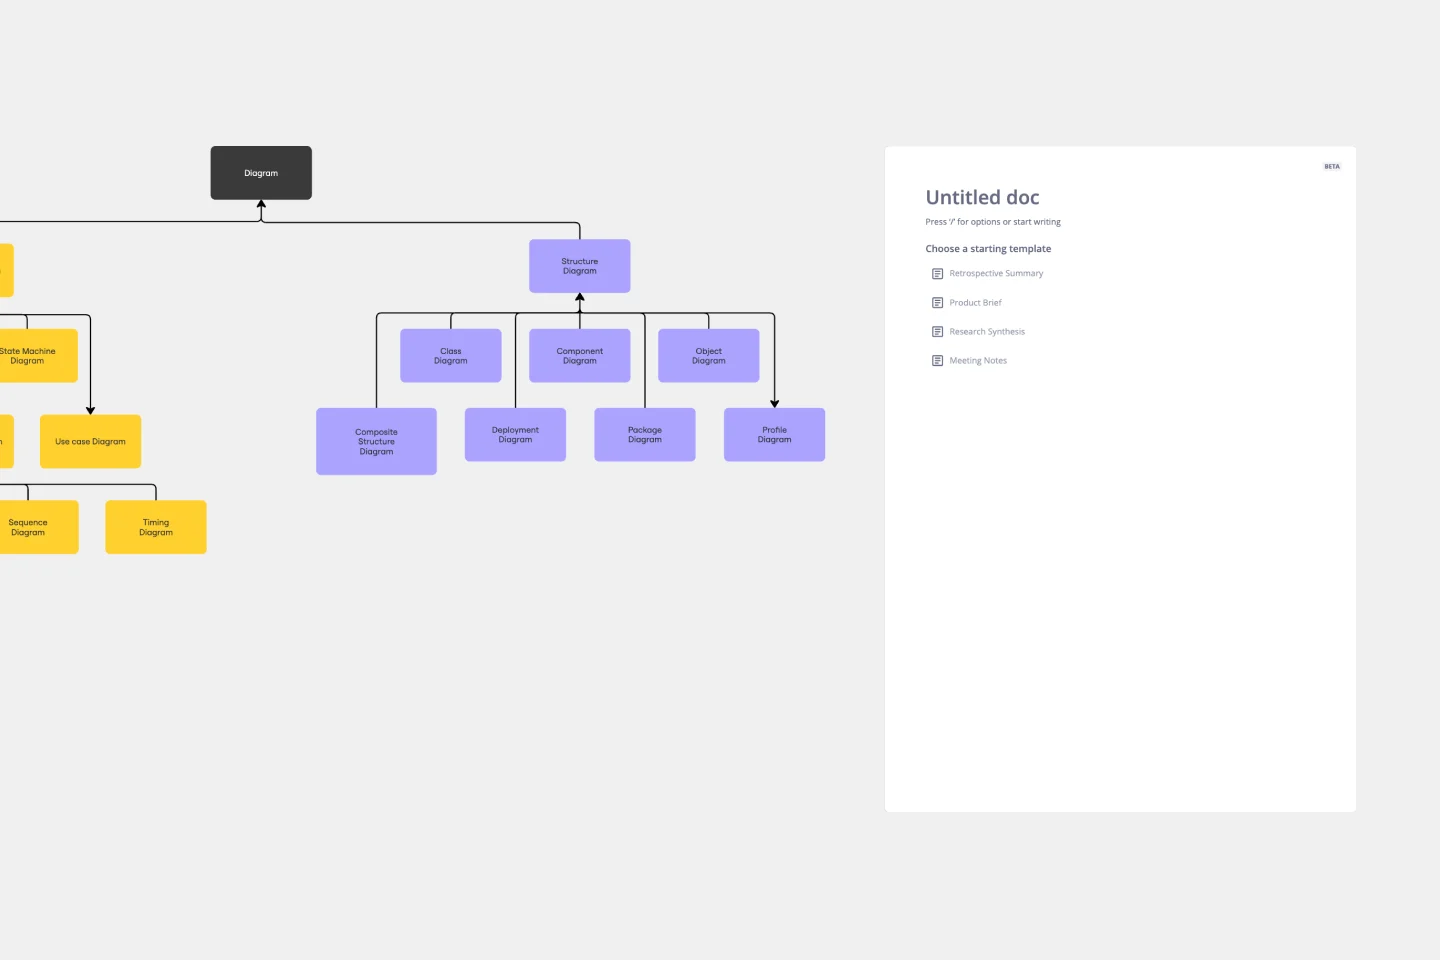
UML Diagram Template
Works best for:
Diagrams, Software Development
Originally used as a modeling language in software engineering, UML has become a popular approach to application structures and documenting software. UML stands for Unified Modeling Language, and you can use it to model business processes and workflows. Like flowcharts, UML diagrams can provide your organization with a standardized method of mapping out step-by-step processes. They allow your team to easily view the relationships between systems and tasks. UML diagrams are an effective tool that can help you bring new employees up to speed, create documentation, organize your workplace and team, and streamline your projects.
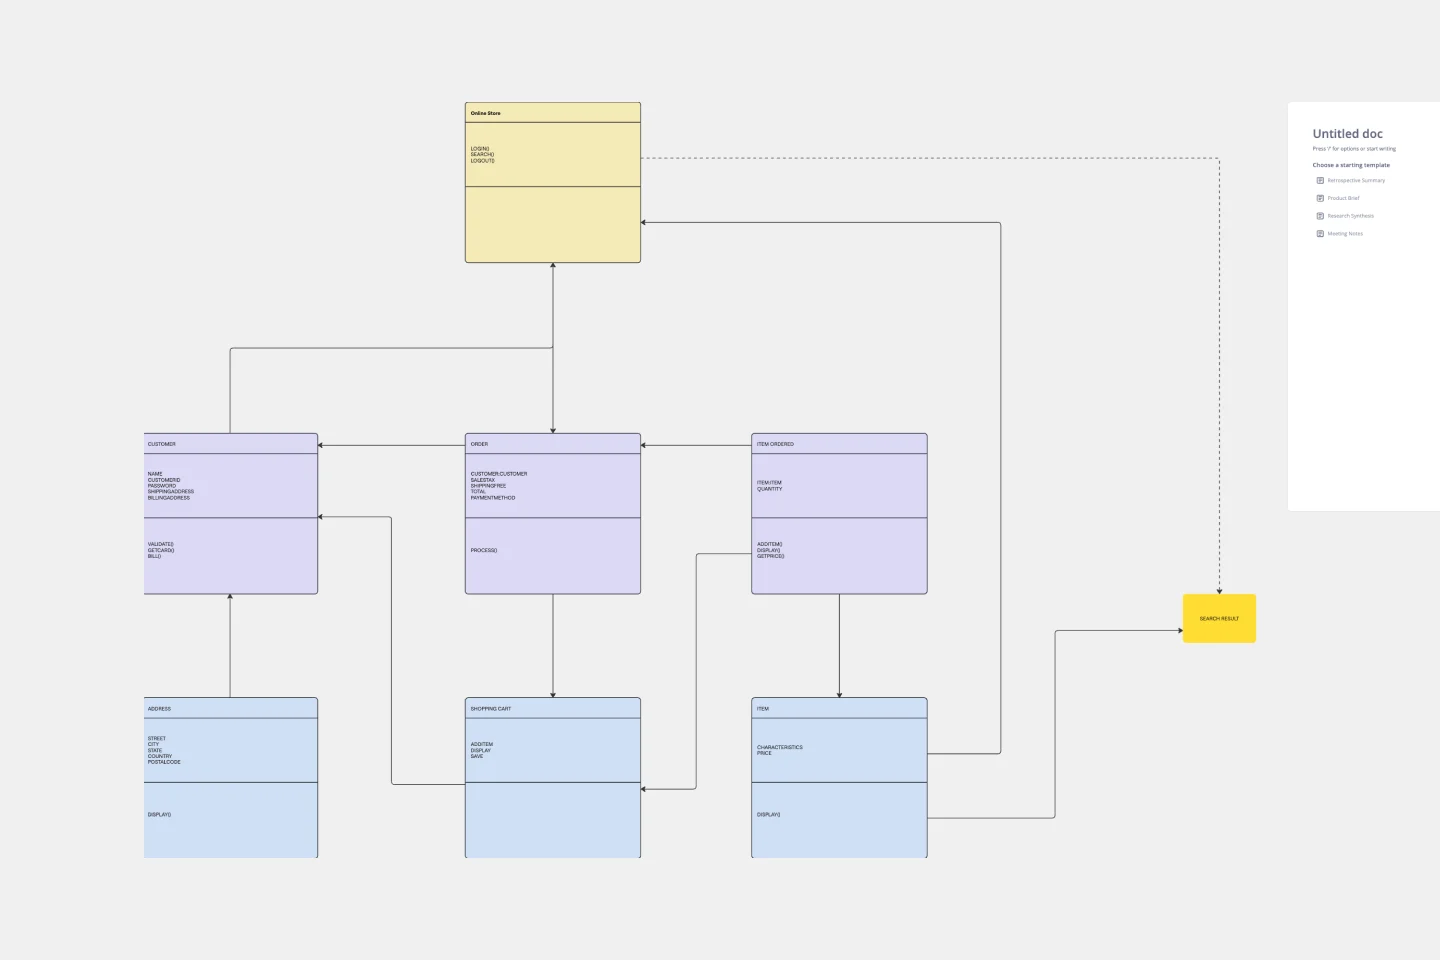
UML Class Diagram Template
Works best for:
UML Class Diagram Template, Mapping, Diagrams
Get a template for quickly building UML class diagrams in a collaborative environment. Use the UML class diagram template to design and refine conceptual systems, then let the same diagram guide your engineers as they write the code.
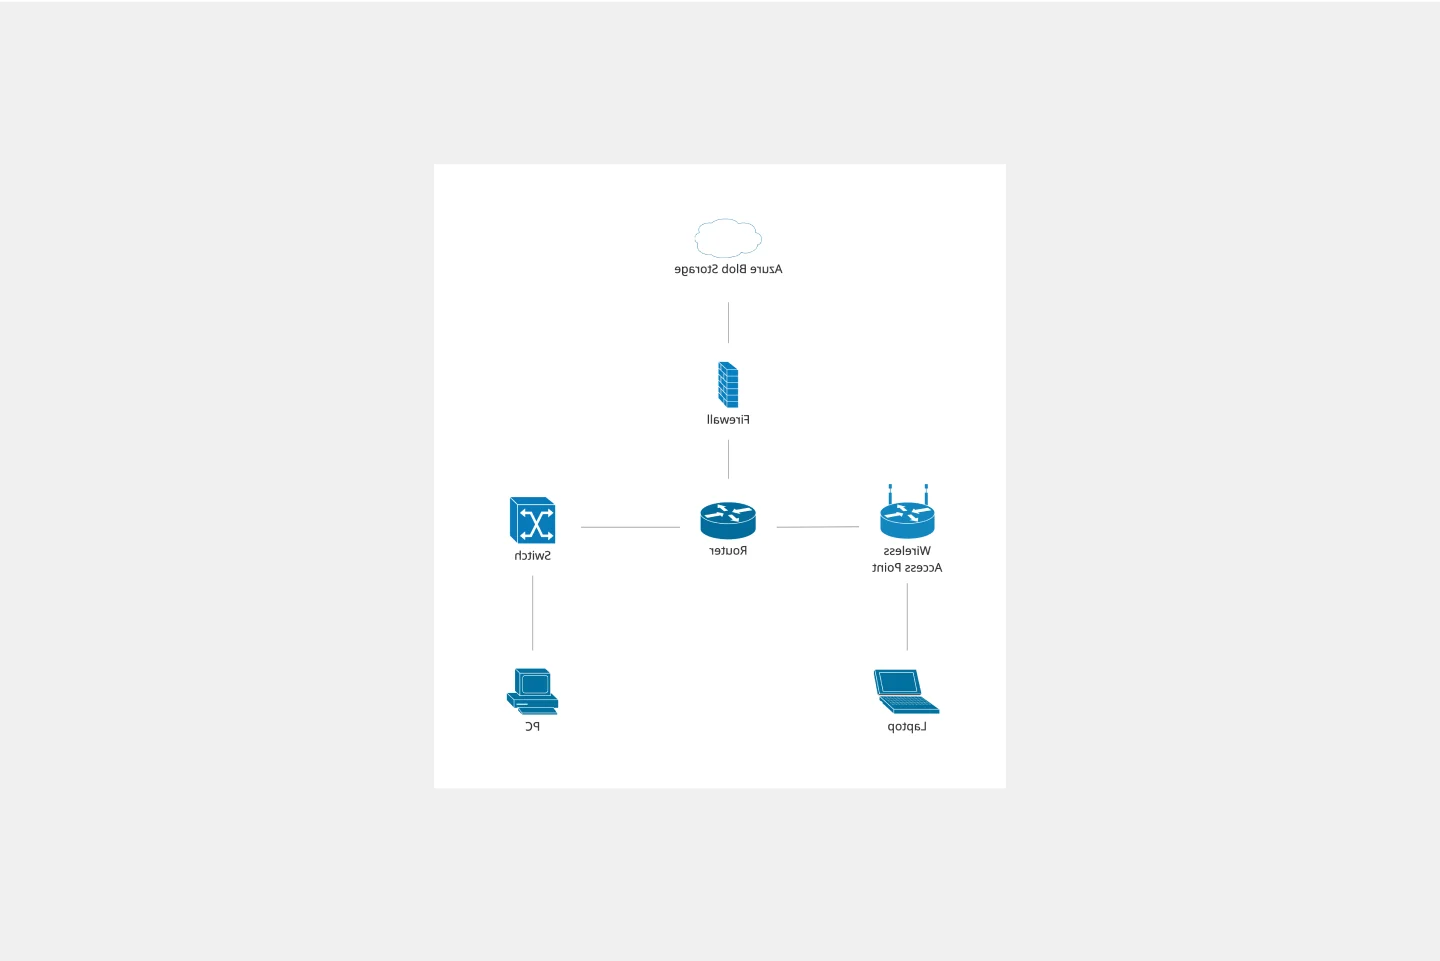
Cisco Network Diagram Template
Works best for:
Software Development, Diagrams
Cisco offers data center and access networking solutions built for scale with industry-leading automation, programmability, and real-time visibility. The Cisco Data Network Diagram uses Cisco elements to show the network design of Cisco Data Networks visually.