BCG Matrix Template
Analyze ways to spur business growth and capture market share with the BCG matrix template.
About the BCG Matrix Template
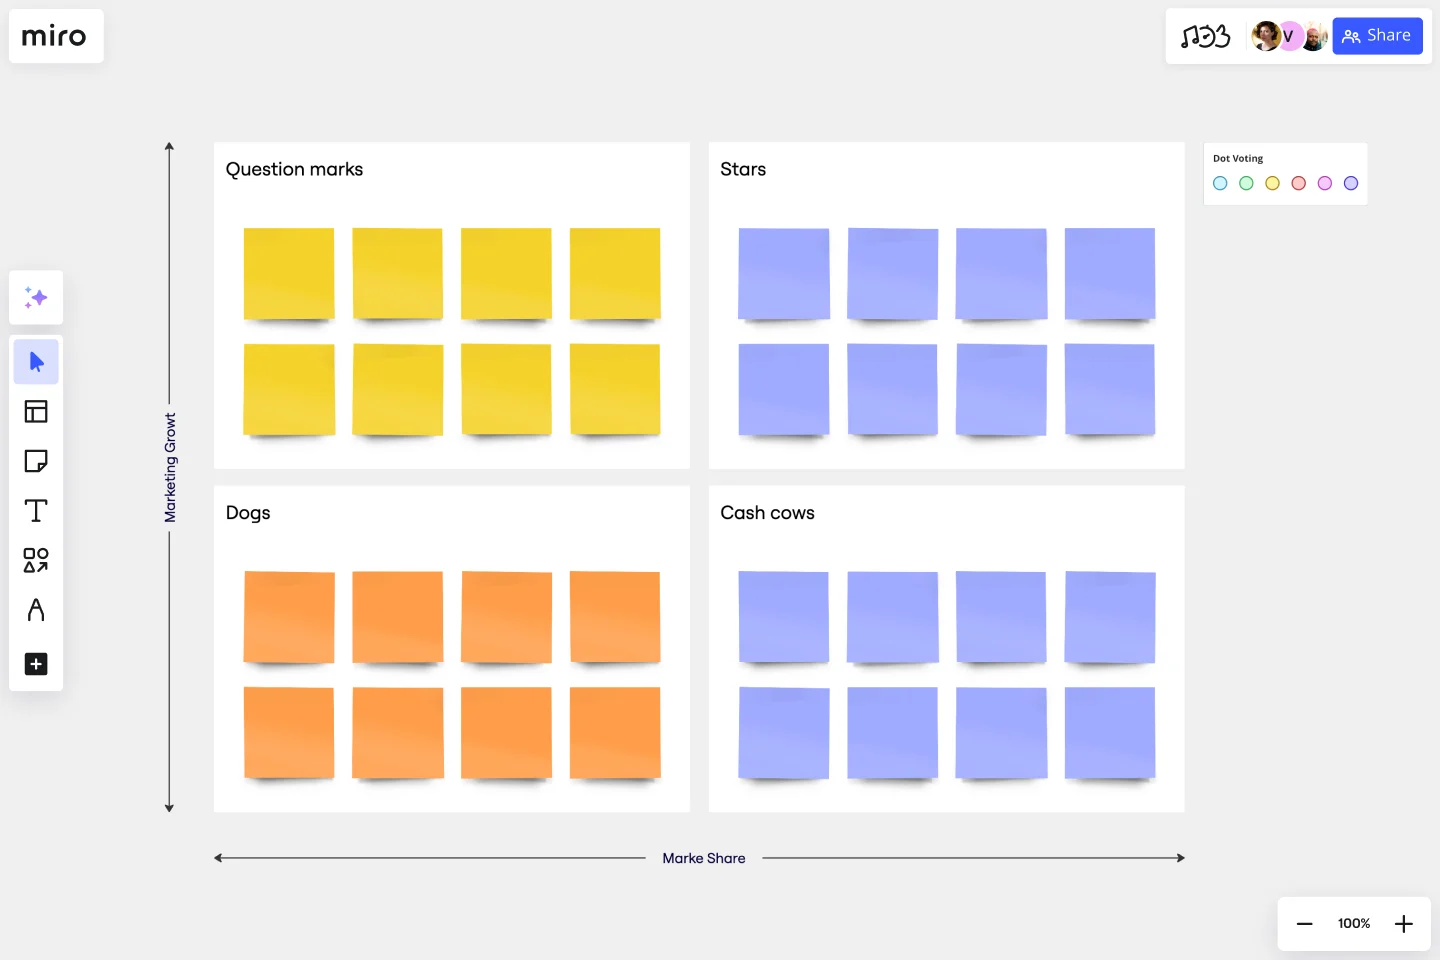
The BCG matrix template is a four-quadrant grid that allows businesses to visualize where and how they can grow their market share. Businesses can use this template to see where they currently stand in the marketplace. In doing this, they can also identify the best areas for growth.
What is a BCG matrix?
Created by the Boston Consulting Group, the BCG matrix (also known as the Boston matrix or growth-share matrix) is a strategic planning tool. The BCG matrix divides business units and products into one of four categories based on their market shares. With this information, businesses get an insight into which products can help them capitalize on market share growth opportunities.
What are the two measurements used in the BCG matrix?
There are two key measurements used in the BCG matrix: analyzing the market growth rate and reviewing relative market share.
Market growth rate: This measurement looks at the level of revenue growth within the marketplace. It usually compares growth with the previous year to predict future growth.
Relative market share: This measurement analyzes your current position in the marketplace in relation to your largest competitor.
Reviewing these measurements allows you to identify likely opportunities for growth. It also helps you find any problem areas or areas of improvement in your existing products.
4 elements of a BCG matrix template
If you’re working with a product portfolio, a BCG growth-share matrix can give you a quick overview of how products are performing and help you build a basis for further analysis. To use the chart, analysts plot a scatter graph to rank business units (or products) according to their relative market shares and growth rates.
1. Cash cows
These are products or business units with a high market share in a slow-growing industry. These units typically generate cash above the amount needed to maintain the business.
2. Dogs
Dogs are units with a low market share in a mature, low-growth industry. These units typically "break even," generating barely enough cash to maintain the business's market share. Many investors choose to sell off dogs.
3. Question marks
Also called “problem children,” question marks operate in a high-growth market yet maintain a low market share. They could potentially gain market share, become stars, and then become cash cows. Question marks should be analyzed carefully to determine whether they are worth the investment required to grow market share.
4. Stars
Stars are units with a high market share in a fast-growing industry. They have graduated from question marks with a market- or niche-leading trajectory.
How do you use a BCG matrix template?
Miro is the perfect tool to create and share your BCG matrix. Get started by selecting this BCG matrix template. The simple template allows you to collaborate on portfolio analysis in real-time and takes only a minute to set up. A completed matrix can be used to assess the strength of your organization and its product portfolio.
To give you an idea of how to create your own BCG matrix using our template, we’ve outlined a simple step-by-step guide.
Step 1: Choose the product. Start by identifying the product or services you want to analyze with the matrix.
Step 2: Define the market. To use the BCG matrix template effectively, you must define your market correctly. If you don’t, the results from the matrix won’t be accurate. To ensure you’ve got a good handle on the market you need to review, we suggest doing a market analysis.
The process involves performing a quantitative and qualitative assessment of the market. It looks at the size of the market, the target audience, the competition, and the economic environment.
Step 3: Calculate the relative market share. Find out how you currently stand by calculating your relative market share. Here’s the formula you need:
Relative market share = your market share / your largest competitor’s market share.
Step 4: Find out the market growth rate. Figure out how much the marketplace has grown over the last year using this formula:
Market growth rate = total sales in current year / total sales from previous year.
Step 5: Add all the information to the matrix. You’ve done the legwork — now it’s time to put all the information in the matrix template. Then, you can use Miro’s easy collaboration features to share it with your team, stakeholders, and anyone else who would benefit from seeing it.
Examples of when to use a BCG matrix
Your organization can find a BCG matrix useful in several areas: marketing, project management, and strategic management. Typically, the matrix is used during the strategic planning phase of a marketing plan or project. It can also be used for business portfolio analysis.
Let’s take a look at some examples:
1. To increase investment in a product to capture additional market share. If one of your products sits in the question mark category, you know that investing in this product is likely to get an increase in market share.
2. To determine whether you should pause investment in a certain product. If a product sits in the dog category, you know that you’re not likely to see a lot of growth. If you’re looking to pause investment, products in this section would be your best bet.
3. To maximize cash flow from a product. Using the matrix, you can see which products are your top performers, otherwise known as star products. These are the big sellers with the most market share, so you can use the matrix to identify which products yield the highest revenue.
4. To best allocate resources. The matrix shows you which products are worth investing time, money, and resources in so that you have the best chances of turning a profit. For businesses operating in a competitive landscape, this is incredibly helpful.
Typically speaking, the matrix is better suited for large businesses. In smaller businesses, relative market share can be too small to quantify. It’s also based on the idea that market share can be achieved by spending more on the marketing budget. If you have a limited budget, you might be restricted in how you can use the BCG matrix.
If you’re a small business, we’d suggest using a SWOT analysis instead.
What are the four quadrants of the BCG matrix?
The four quadrants of a BCG matrix are cash cows (high market share, slow growth), dogs (low market share, low growth), question marks (high market share, low growth), and stars (high market share, high growth).
How do you use the BCG matrix model?
The BCG matrix model is used to assess the quality of investments in a business portfolio and their potential for future profitability. A BCG matrix is useful because it assesses the external environment and is best paired with other forms of internal analysis that assess the quality and state of the investments themselves.
Get started with this template right now.
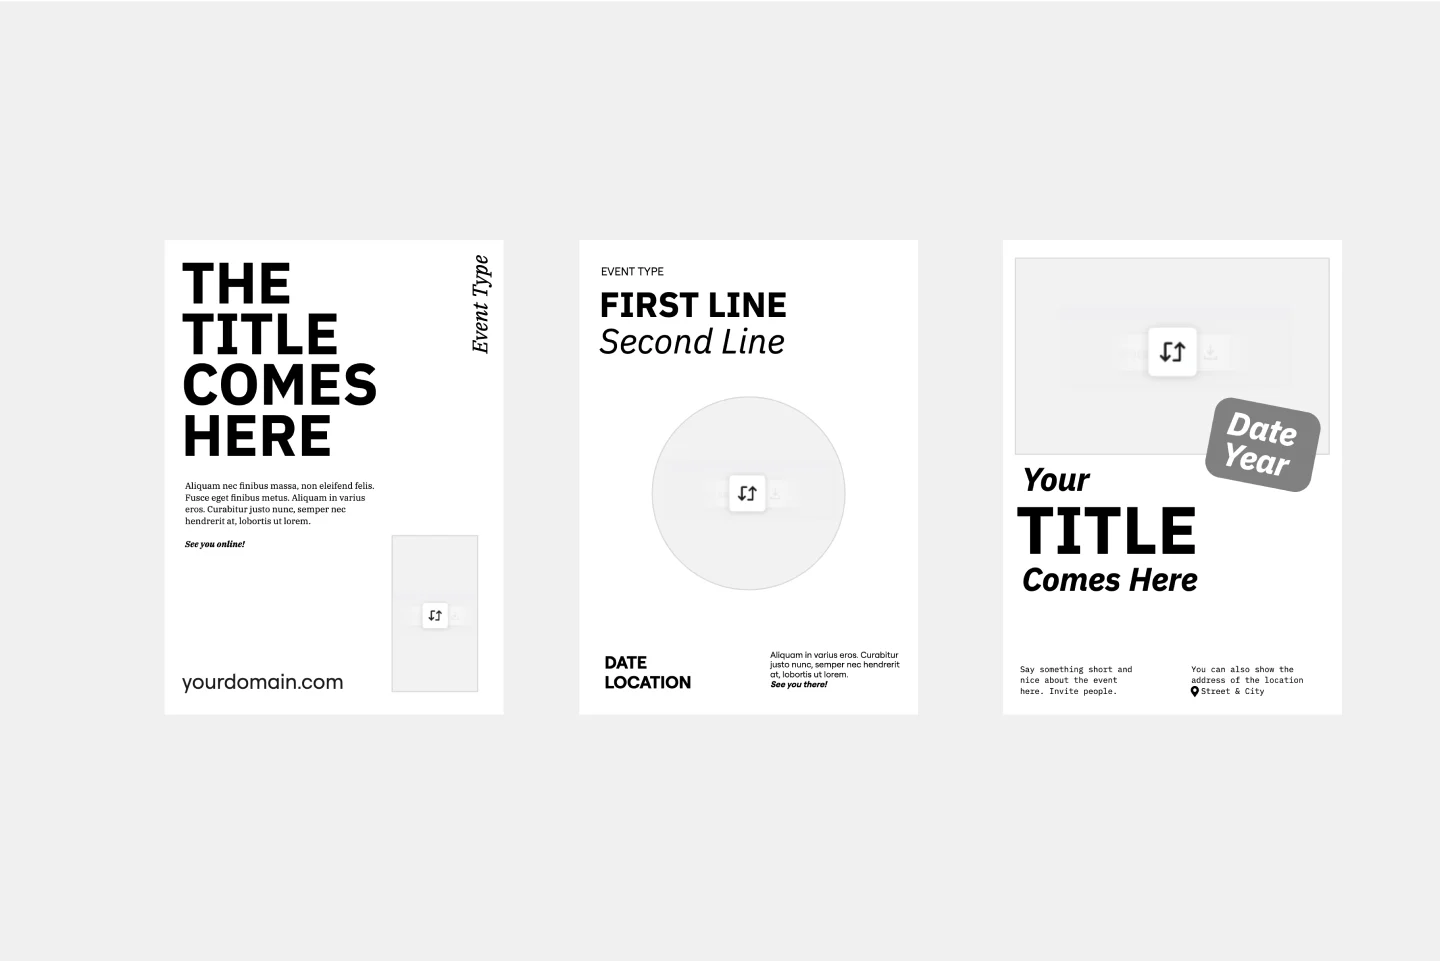
Flyer Maker Template
Works best for:
Design, Marketing
Whether it’s a client party or a nonprofit fundraiser, your event needs one key thing to be a smashing success: people to show up. That’s why promoting it is such an important part of the planning—and creating and sending a flyer is the first step. These single-page files will grab your guests’ attention and give them the key details, such as the time, date, and location (and if it’s a fundraiser, who/what the funds will benefit). This template will let you lay out text and customize a flyer design.
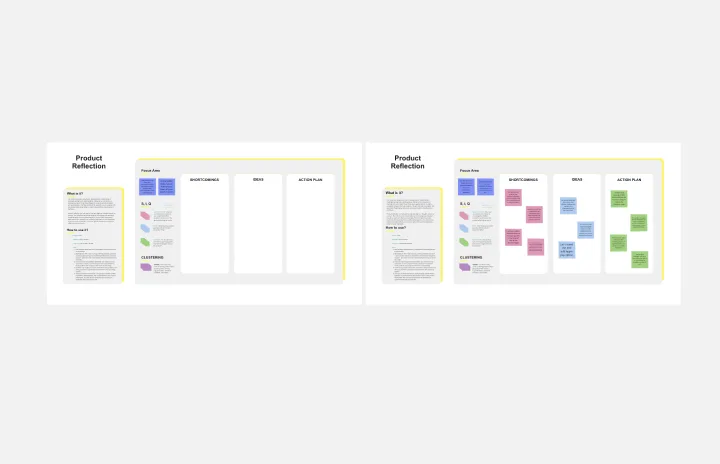
Product Reflection
Works best for:
Product Management, Planning
The Product Reflection template encourages teams to reflect on past experiences and lessons learned in product development journeys. By facilitating retrospective sessions, capturing insights, and identifying improvement opportunities, this template fosters a culture of continuous learning and improvement. With sections for evaluating successes, challenges, and areas for growth, it enables teams to iterate on their processes and enhance future product development efforts. This template serves as a tool for fostering team collaboration and driving iterative product innovation.
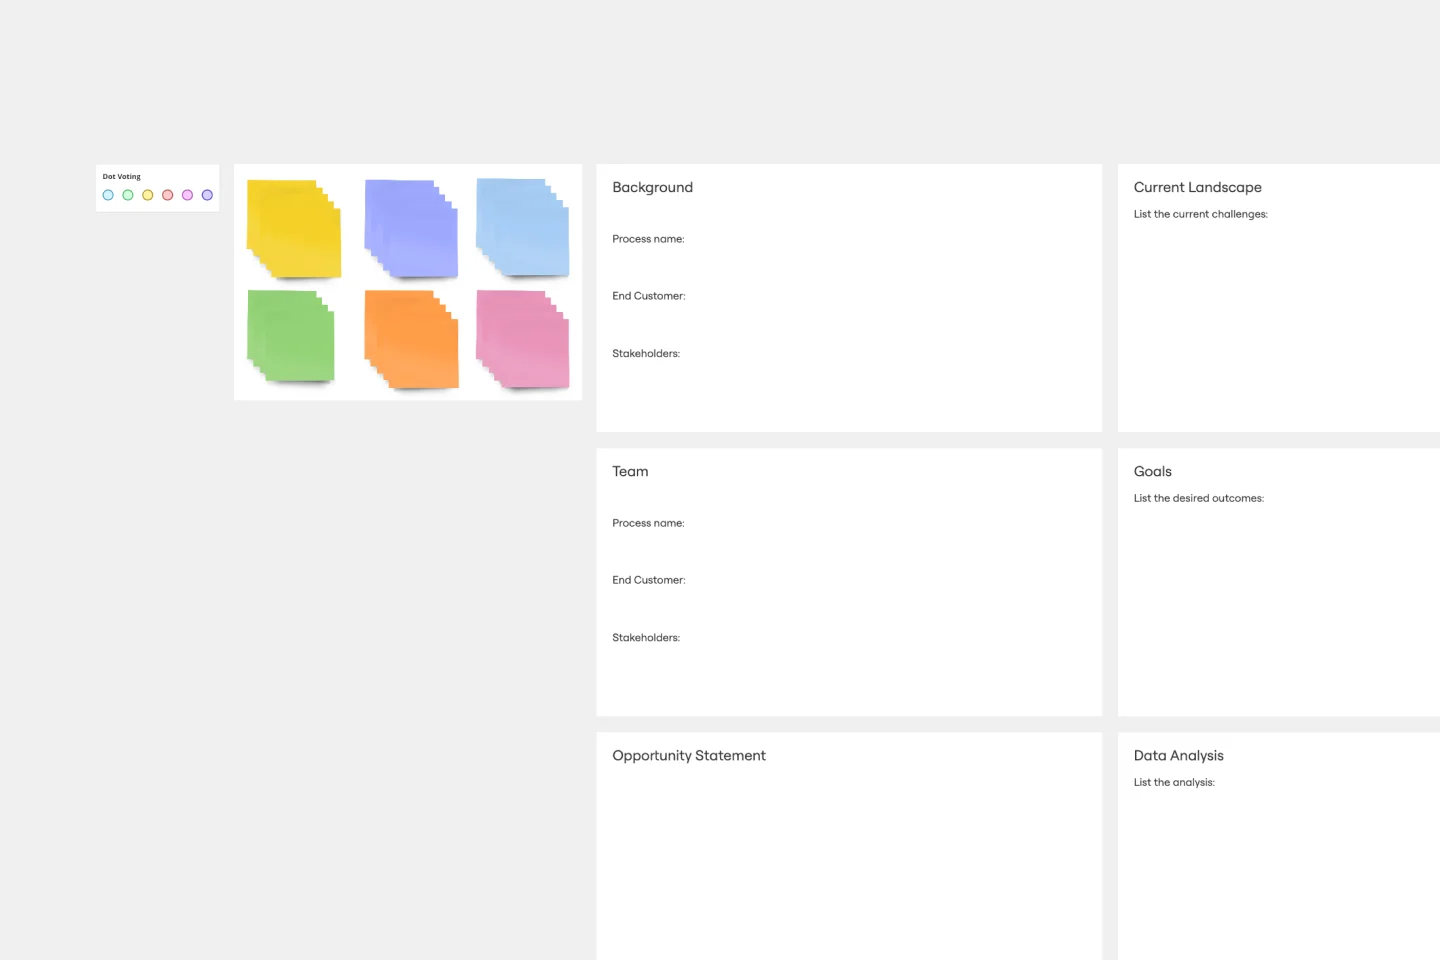
A3 Report Template
Works best for:
Product, Strategy and Planning
The A3 report template is a carefully designed tool that provides teams with a structured and visual methodology to tackle challenges. It divides the problem-solving process into background, current context, data analysis, and implementation plans, ensuring a comprehensive approach to each issue. One of the major advantages of this template is its "Data Analysis" section, which enables teams to delve deeply into concrete insights and trends. This data-driven approach ensures that all recommendations and actions are based on real, tangible evidence rather than just intuition, leading to more effective and strategic decision-making.
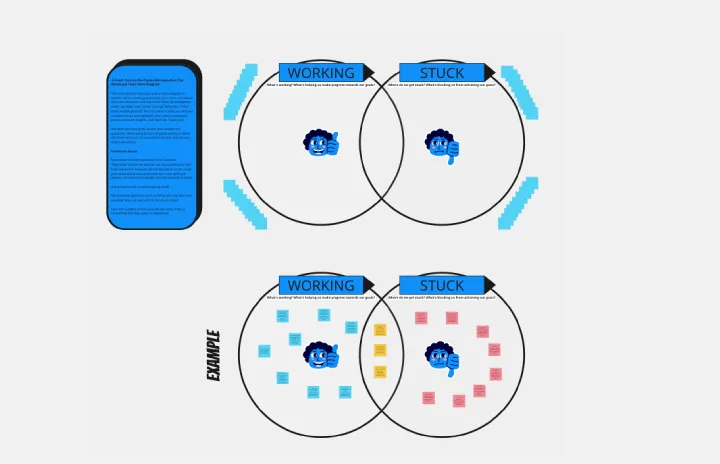
The Working & Stuck Venn Diagram
Works best for:
Venn Diagrams
The Working Stuck Venn Diagram template helps you identify and resolve project blockages. Use it to compare tasks, resources, and challenges, pinpointing where work is getting stuck. This template facilitates problem-solving and strategic planning, helping teams overcome obstacles and improve workflow efficiency. Ideal for project managers, team leaders, and anyone looking to enhance productivity and ensure smooth project execution.
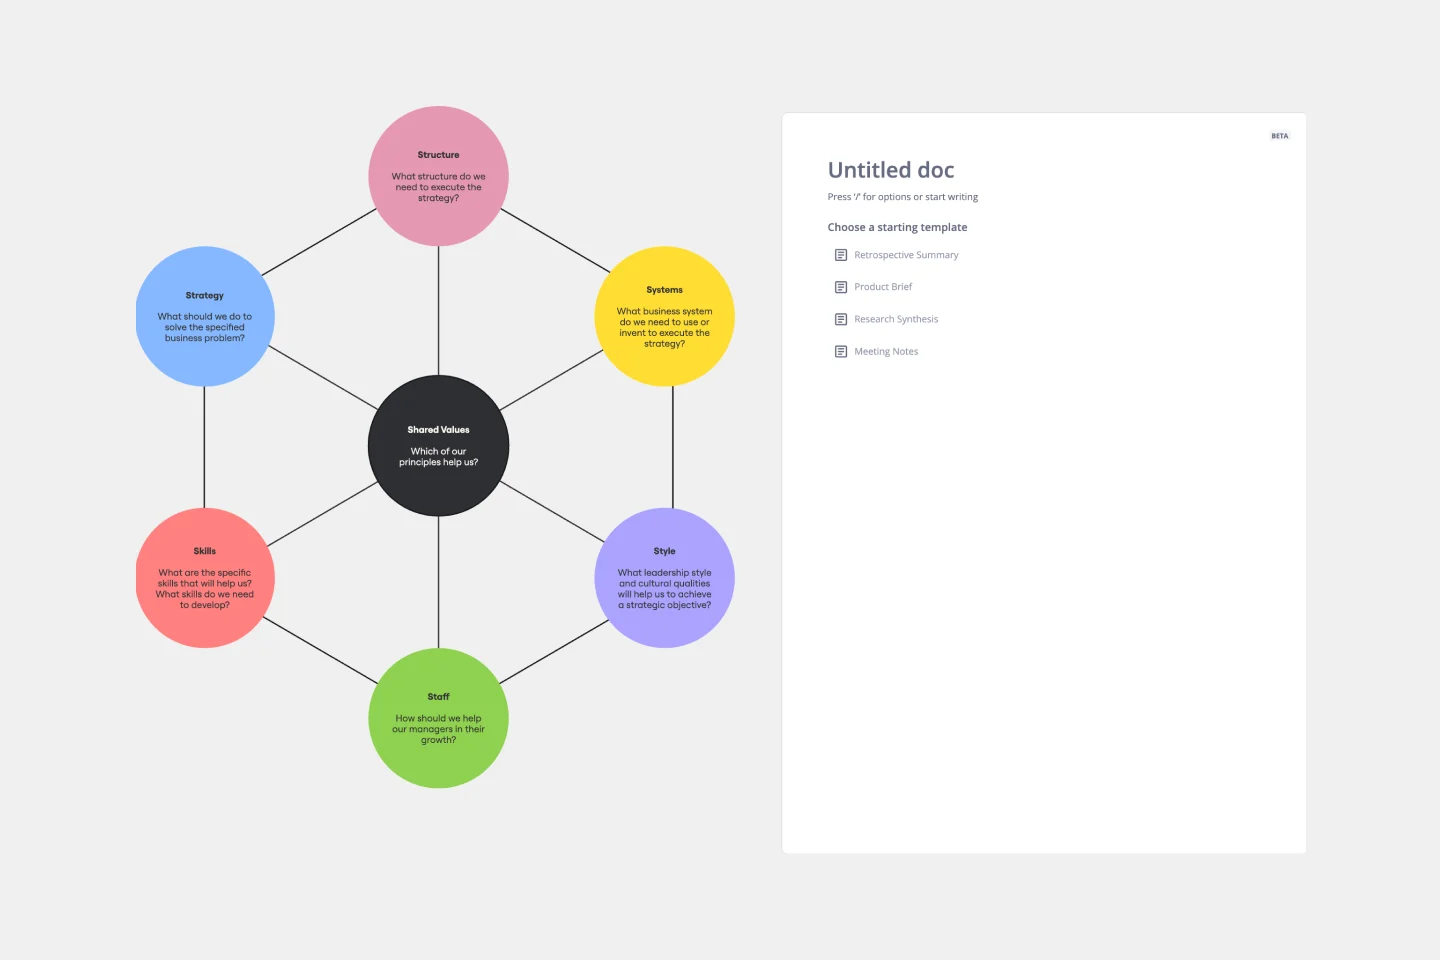
7S Template
Works best for:
Strategy
The 7S Framework Template stands out as an essential tool for organizations aiming to comprehensively understand their internal dynamics. One of its key benefits is its ability to foster strategic alignment. By visually breaking down the interconnectedness of seven core elements - from strategy to staff - the template enables teams to ensure that their business strategies harmoniously align with their internal capabilities and culture. This alignment not only underscores potential areas of strength but also pinpoints avenues for growth and development, ensuring that an organization moves forward with clarity and cohesion.
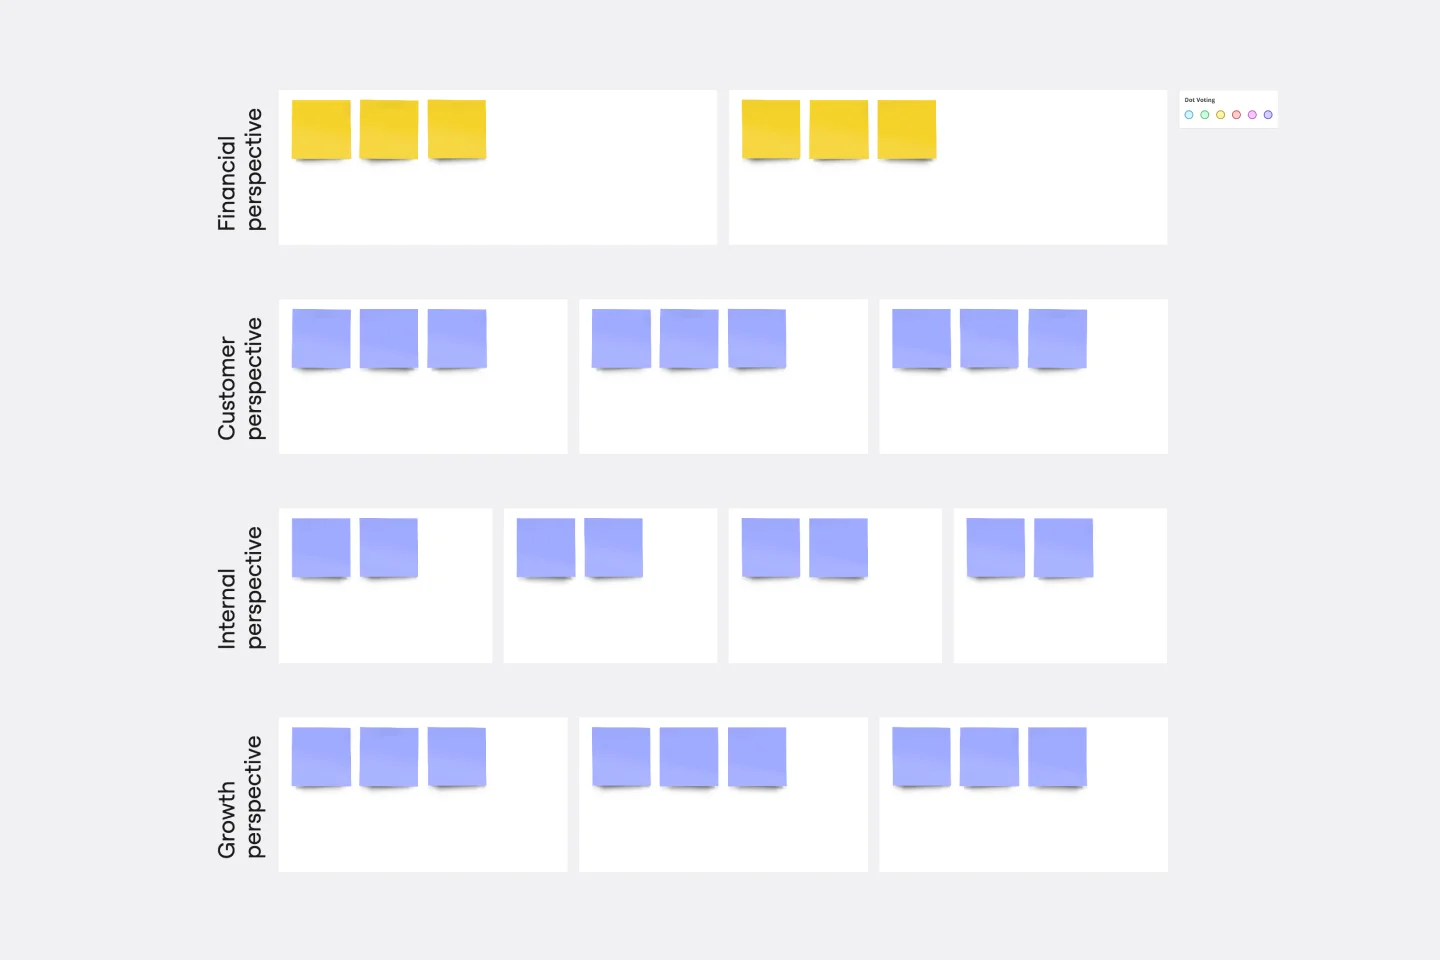
Strategy Map Template
Works best for:
Leadership, Strategic Planning, Mapping
How do your individual or team goals relate to an organization’s overall strategy? A Strategy Map is a stylized picture of your organization’s strategy and objectives. It’s powerful because it provides a clear visual guide to how these various elements work together. Strategy Maps can help align various different team goals with the overall strategy and mission. With the Strategy Map in place, teams can create set actionable, relevant KPIs. Strategy mapping is often considered part of the balanced scorecard (BSC) methodology, which is a strategic planning tool for setting overall team goals.