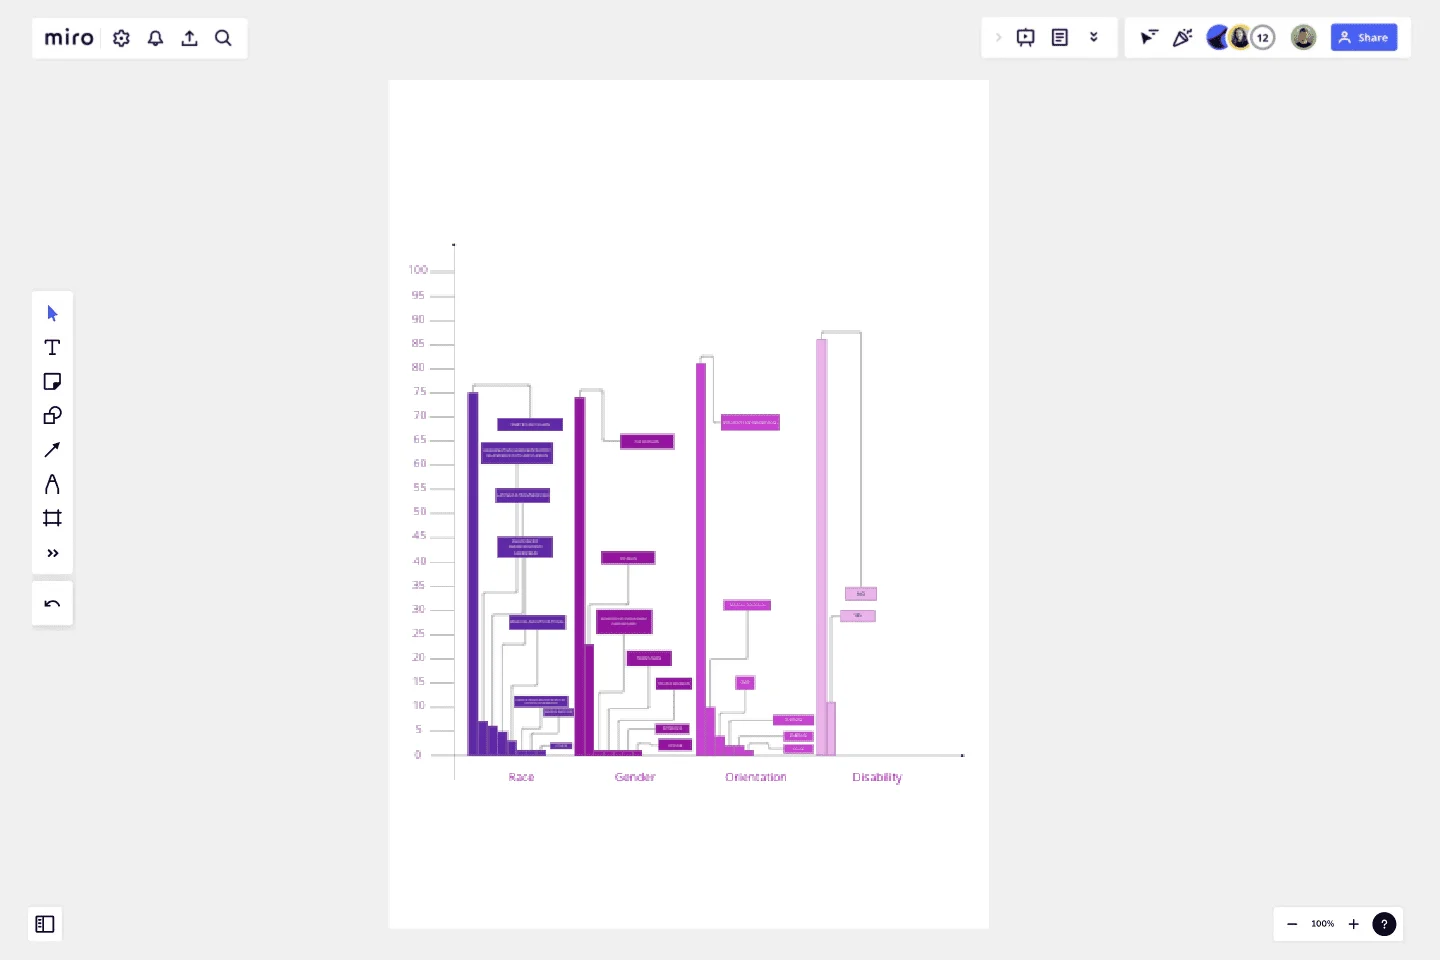
Bar Chart / Diagram Combined
The template is about a bar chart that helps blend multiple/diverse datas.
This template is for everyone especially to students and companies that prefer to wrap up more information at once.
Anyone can click on the bars, numbers and lines to change colour, number, text and add more of these items listed above.
This template was created by Milca Gennuso.
Get started with this template right now.
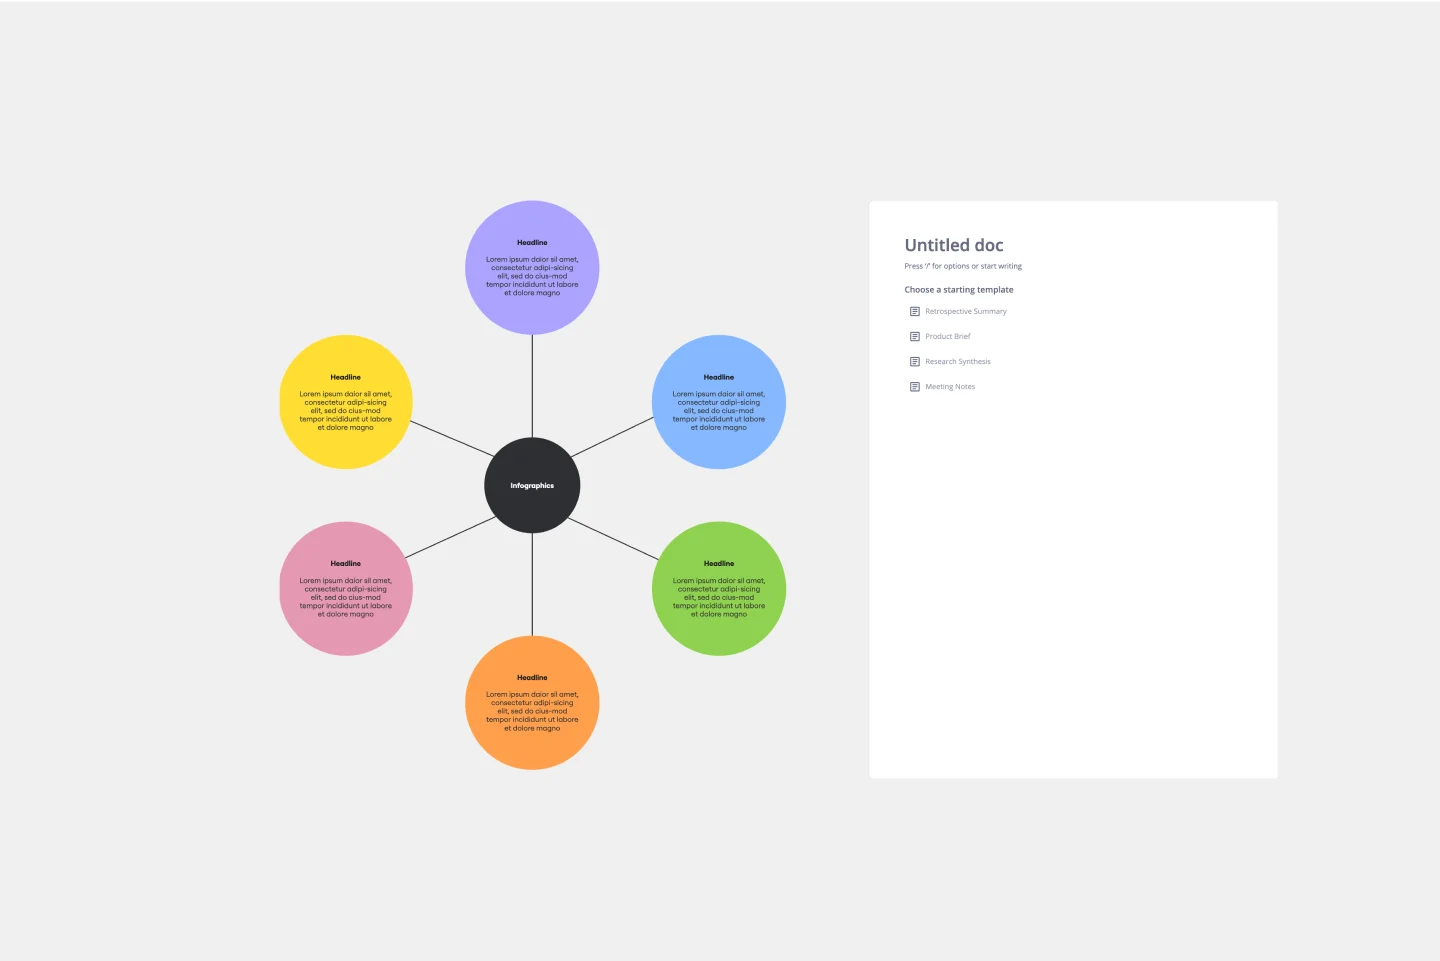
Web Diagram Template
Miro's Web Diagram Template simplifies complex project organization and promotes effective communication. It allows users to easily connect elements and gain a comprehensive understanding of complex relationships, making it a versatile and invaluable asset for diverse projects.
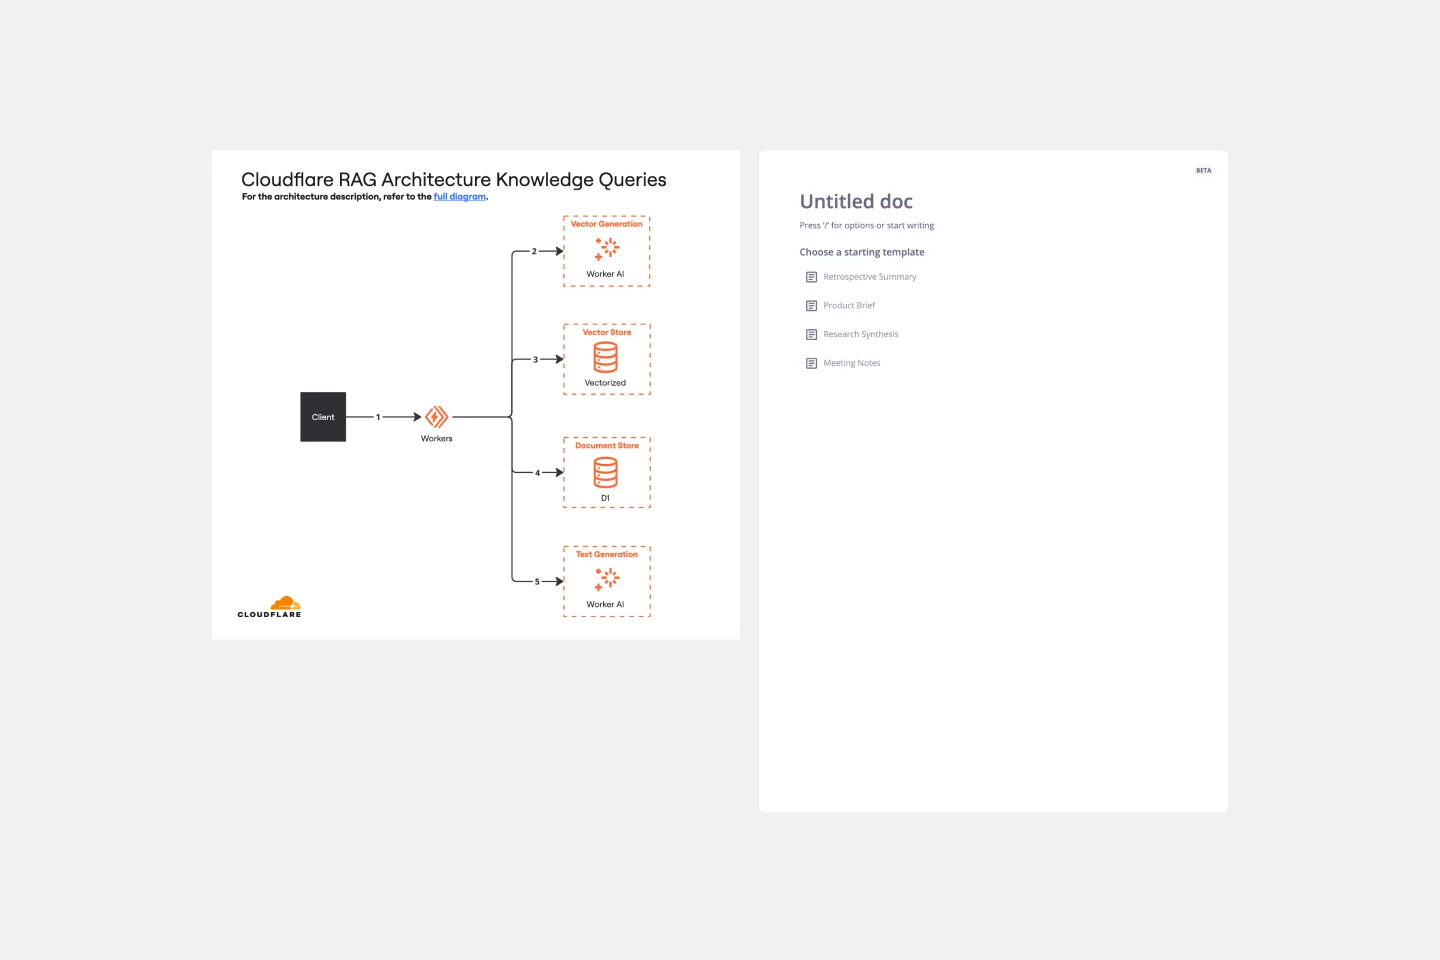
Cloudflare RAG Architecture Knowledge Queries Template
The Cloudflare RAG Architecture Knowledge Queries template is a cutting-edge tool designed to streamline the process of diagramming and understanding the intricate architecture of Cloudflare's Retrieval Augmented Generation (RAG) system. This template is a boon for teams aiming to visualize, query, and optimize Cloudflare's infrastructure collaboratively.
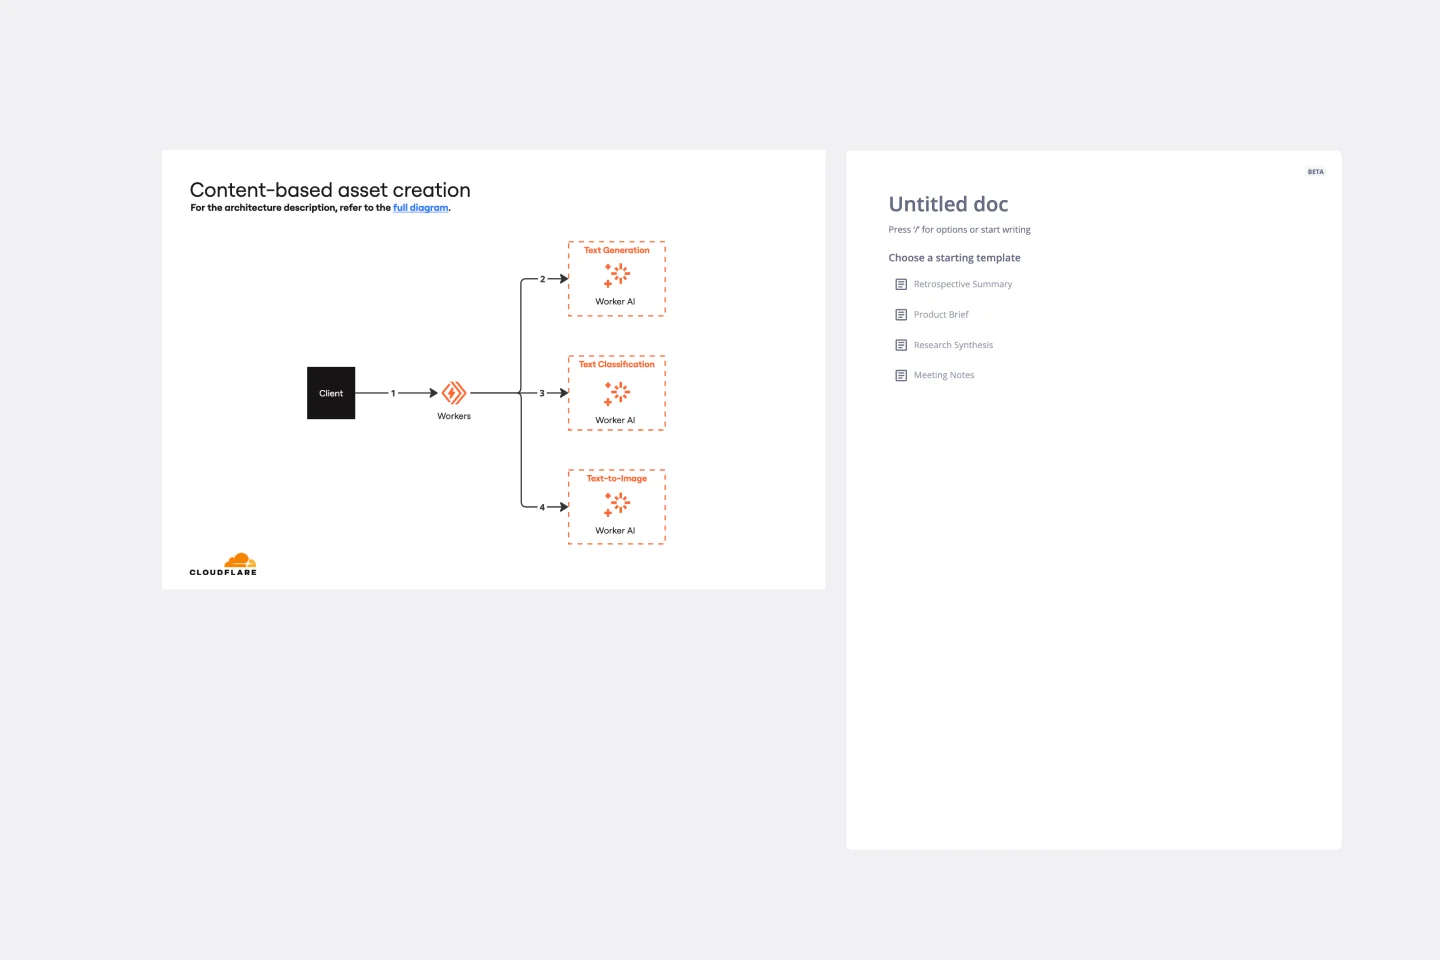
Cloudflare Content-based Asset Creation Template
The Cloudflare Content-based Asset Creation Template enhances efficiency and collaboration within teams working on cloud infrastructure projects. This template provides a structured and intuitive framework for creating and managing digital assets, which streamlines the asset creation process.
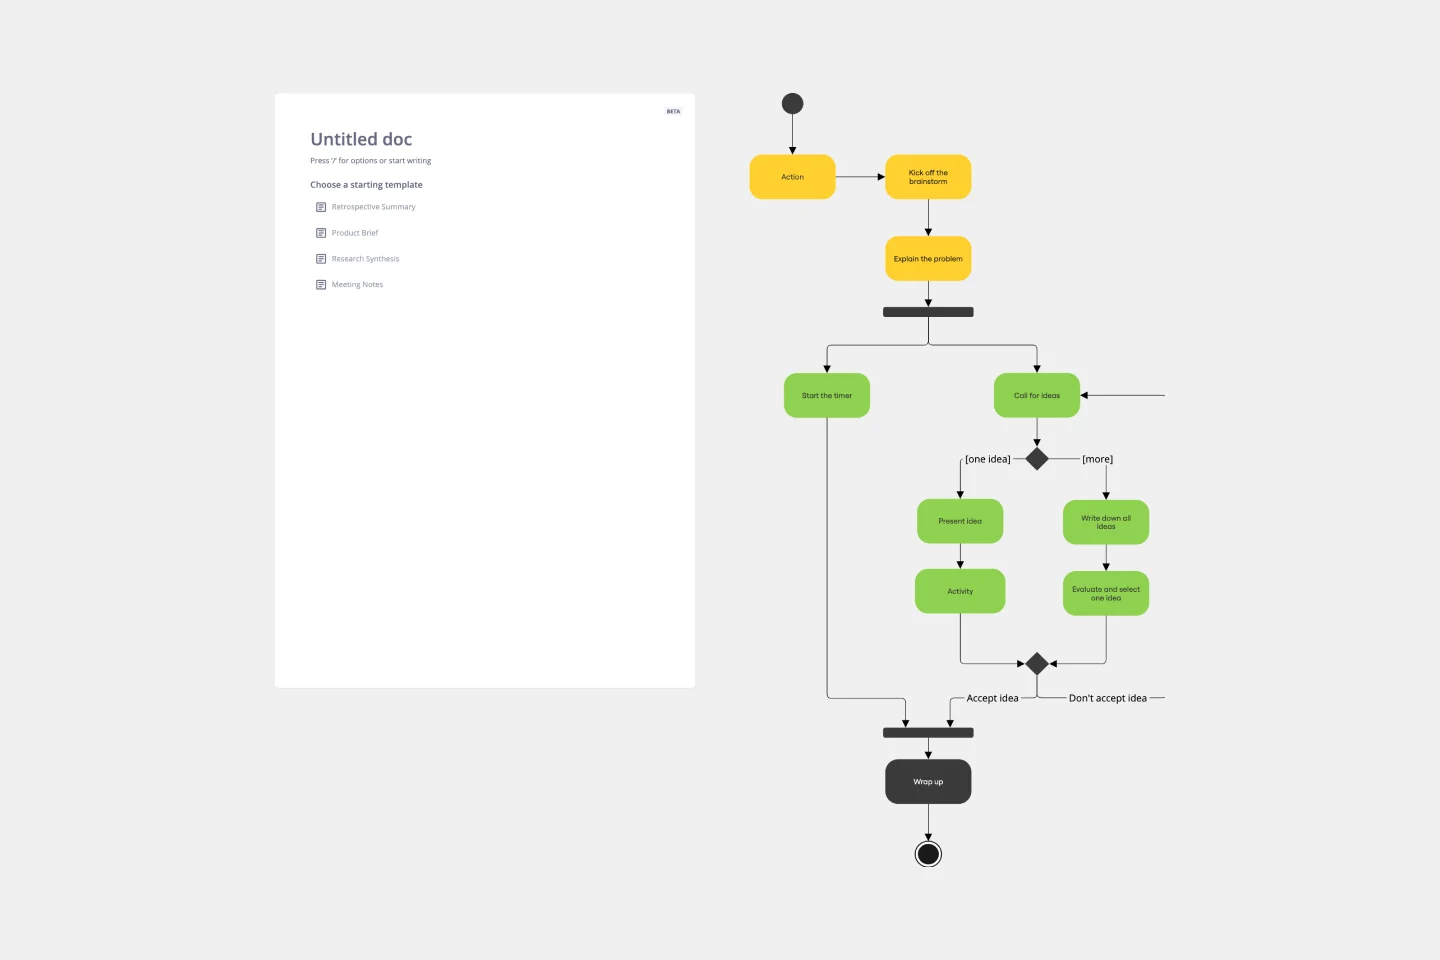
UML Activity Diagram Template
Works best for:
Diagrams
Use our Activity Diagram template to break down activities into smaller decisions and subprocesses. Improve and optimize systems and processes in I.T., business management, and more.
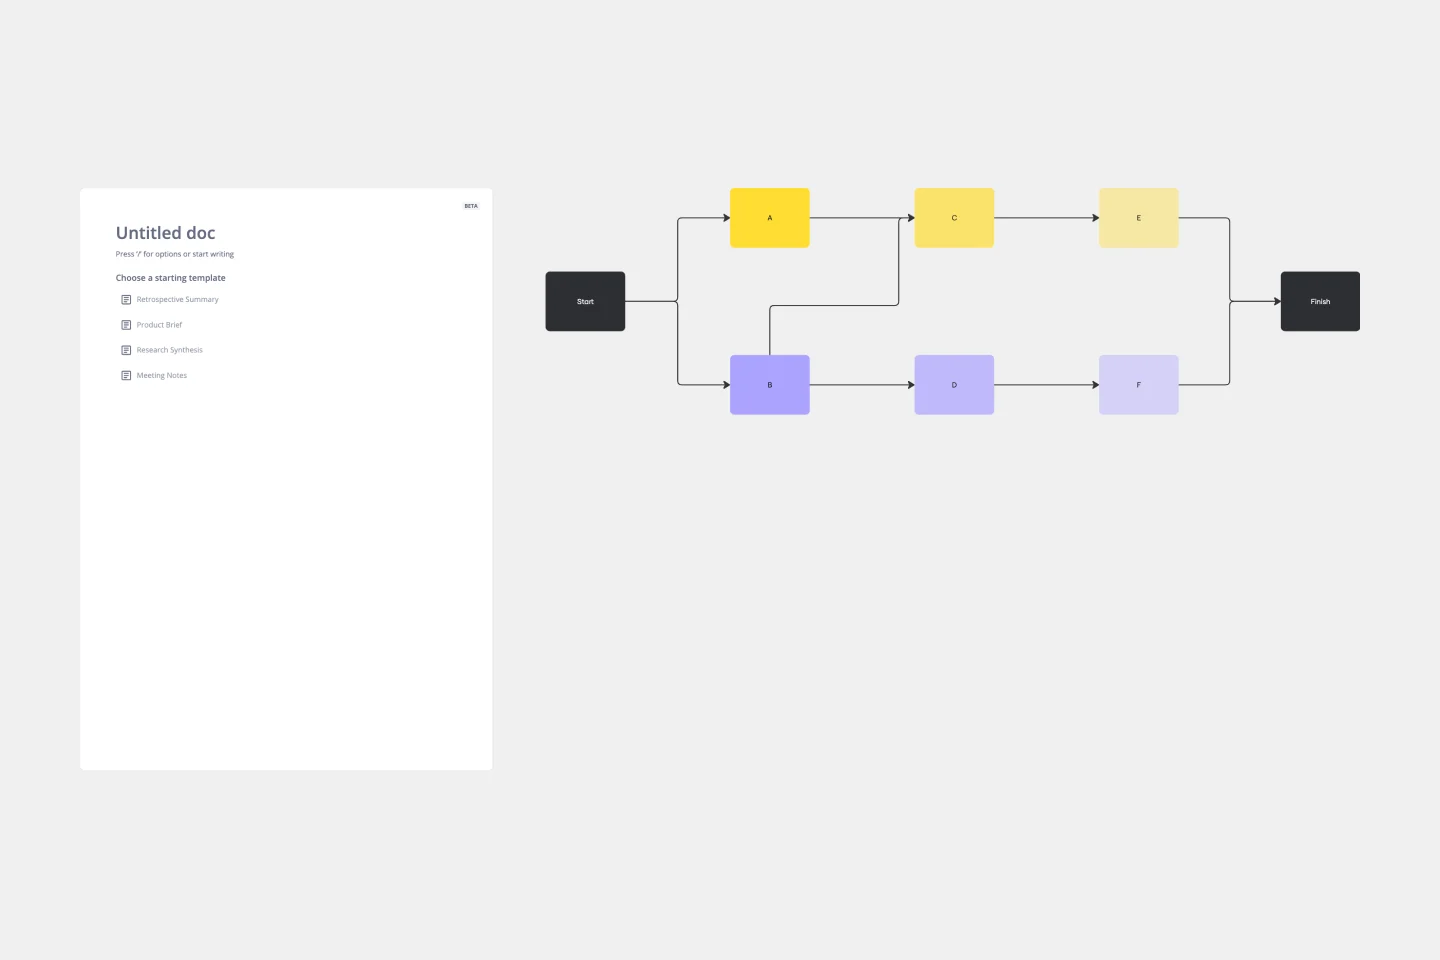
Precedence Diagram
Works best for:
Diagramming, Mapping
The Precedence Diagram Template offers a visual tool that maps out project activities and their interrelated sequences. This diagram empowers teams to recognize and anticipate workflow structures by illustrating the connections and dependencies among tasks.

Opportunity Solution Tree Template
Works best for:
Flowcharts, Product Management, Diagrams
Solving problems — successful companies and productive teams just know how to do it. They’re able to identify many possible solutions, then settle on the one that leads to the desired outcome. That’s the power an Opportunity Solution Tree gives you. Designed by Teresa Torres, a product discovery coach, this mind map breaks down your desired outcome into opportunities for the product to meet user needs, then gives your team an effective way to brainstorm potential solutions.