Bank Mobile App User Journey
This template serves as a comprehensive visualization tool for mapping out the user journey and user flow of a product, offering a structured approach to understanding and improving the user experience.
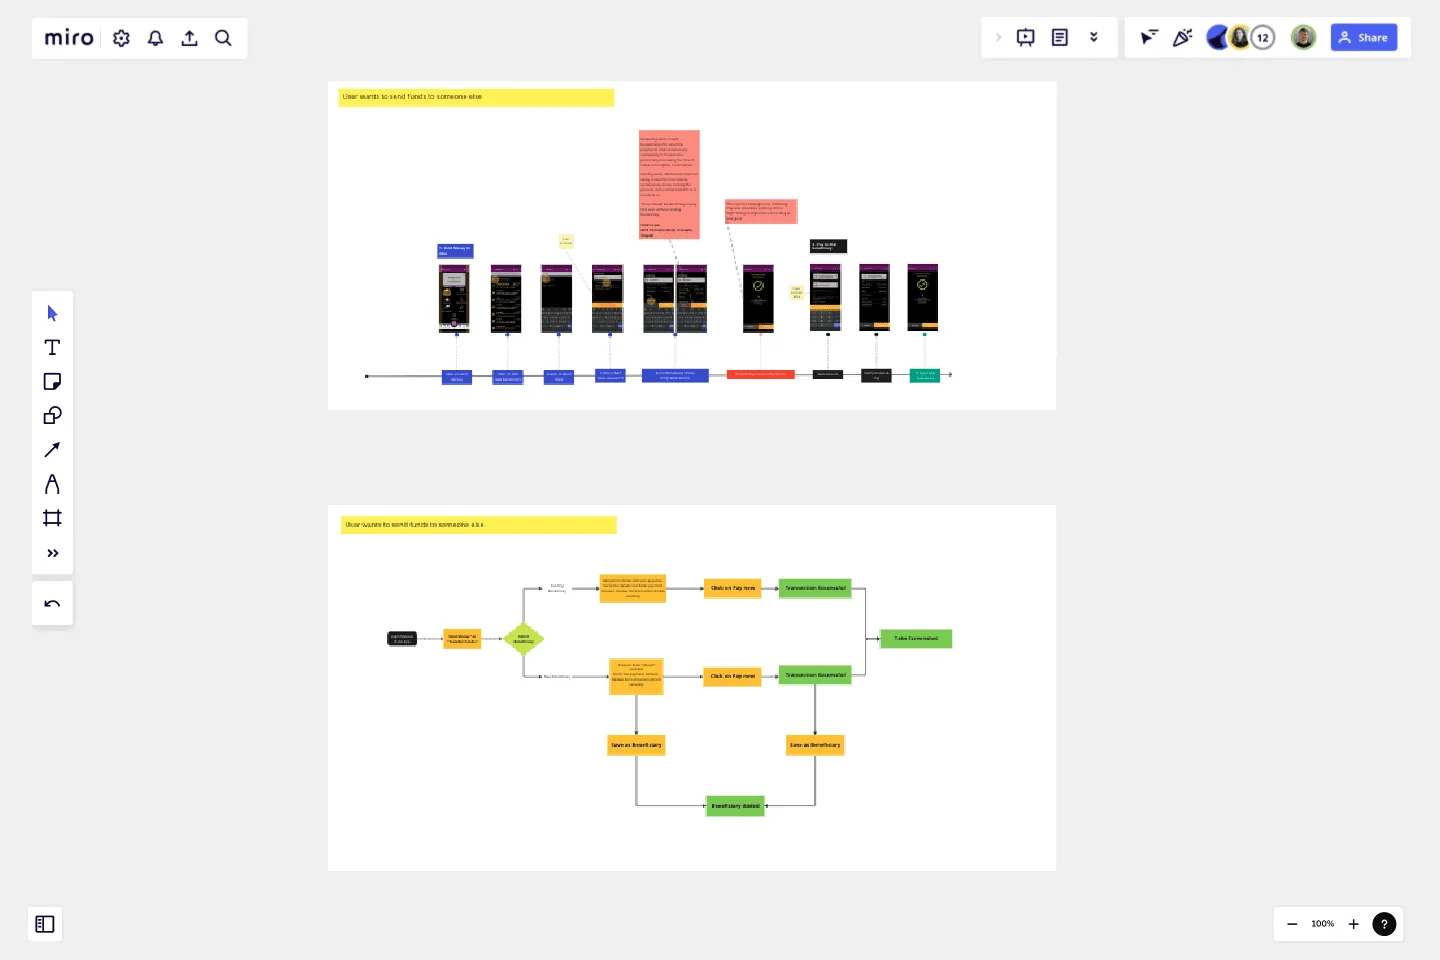
This template follows a two-step process, beginning with the depiction of the current user journey followed by the creation of the proposed user flow.
Understanding the current user journey is an essential first step. It involves meticulously mapping out the various touchpoints, interactions, and experiences a user goes through when engaging with a product or service. By visually representing this existing journey, it becomes easier to identify pain points, bottlenecks, and areas where user satisfaction can be enhanced. This process allows stakeholders to gain a holistic perspective of the user's experience, pinpointing areas that require optimization.
Once the existing user journey is thoroughly documented, the template moves on to the proposed user flow. This step entails envisioning an improved user experience by redesigning the sequence of actions and interactions within the product. It allows for the incorporation of user-centered design principles, best practices, and innovative ideas. By creating a user flow that aligns more closely with the desired user experience, the template empowers teams to conceptualize and communicate how the product should ideally function.
The template's visual format is a valuable asset in presenting findings and recommendations to stakeholders and team members. It enhances clarity and fosters collaboration by providing a common visual language for discussing user experience improvements. It serves as a tangible reference point for ongoing discussions and decisions related to the product's development.
Moreover, the template is adaptable to various stages of product development. Whether you are starting from scratch, redesigning an existing product, or implementing incremental improvements, it can accommodate your needs. It promotes an iterative approach to design, allowing teams to revisit and refine the proposed user flow as the project progresses or user feedback is gathered.
In conclusion, this user journey and user flow template is a versatile tool that promotes a user-centric design approach. It facilitates the exploration of the current user experience landscape and guides the envisioning of an improved user flow. By utilizing this template, product teams can foster better communication, enhance collaboration, and ultimately create products that resonate with users and exceed their expectations.
This template was created by Muhammad Mohsin.
Get started with this template right now.
Yes No Flowchart Template
Works best for:
Diagramming
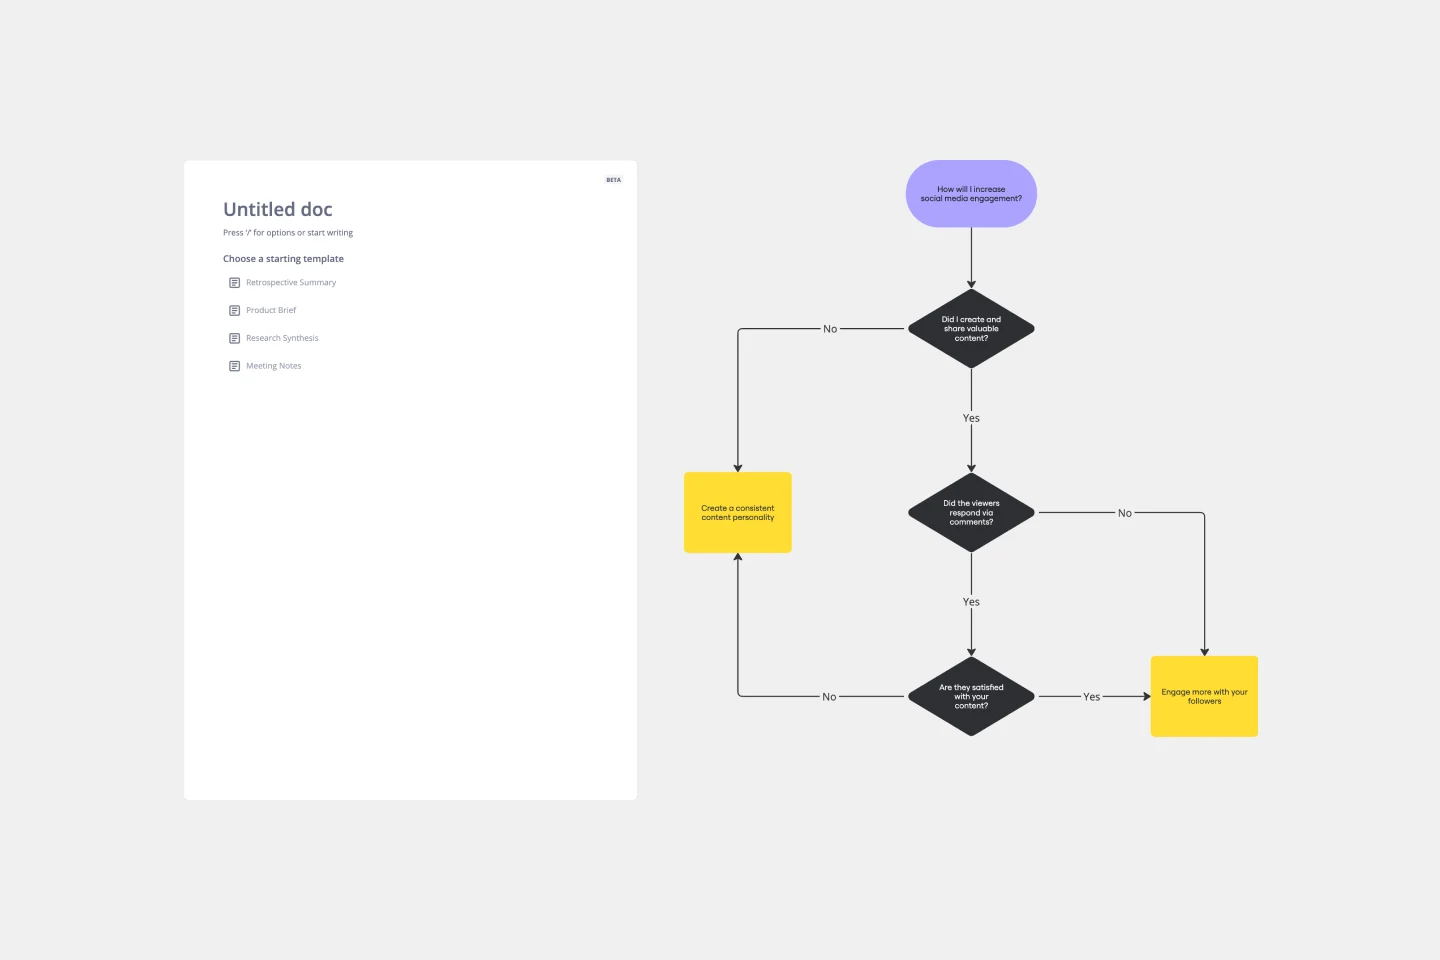
The Yes-No Flowchart Template is a simple and efficient tool that helps to simplify complex decision-making processes into clear and easy-to-follow steps. This template uses standard shapes to illustrate processes, decisions, and outcomes, with arrows that guide users from one action point to the next based on binary 'yes' or 'no' decisions. Its most prominent benefit is its ability to bring clarity to decision-making. By presenting processes visually, teams can effortlessly understand and navigate complex scenarios, ensuring that each step is transparent and reducing the potential for misunderstandings or missteps.
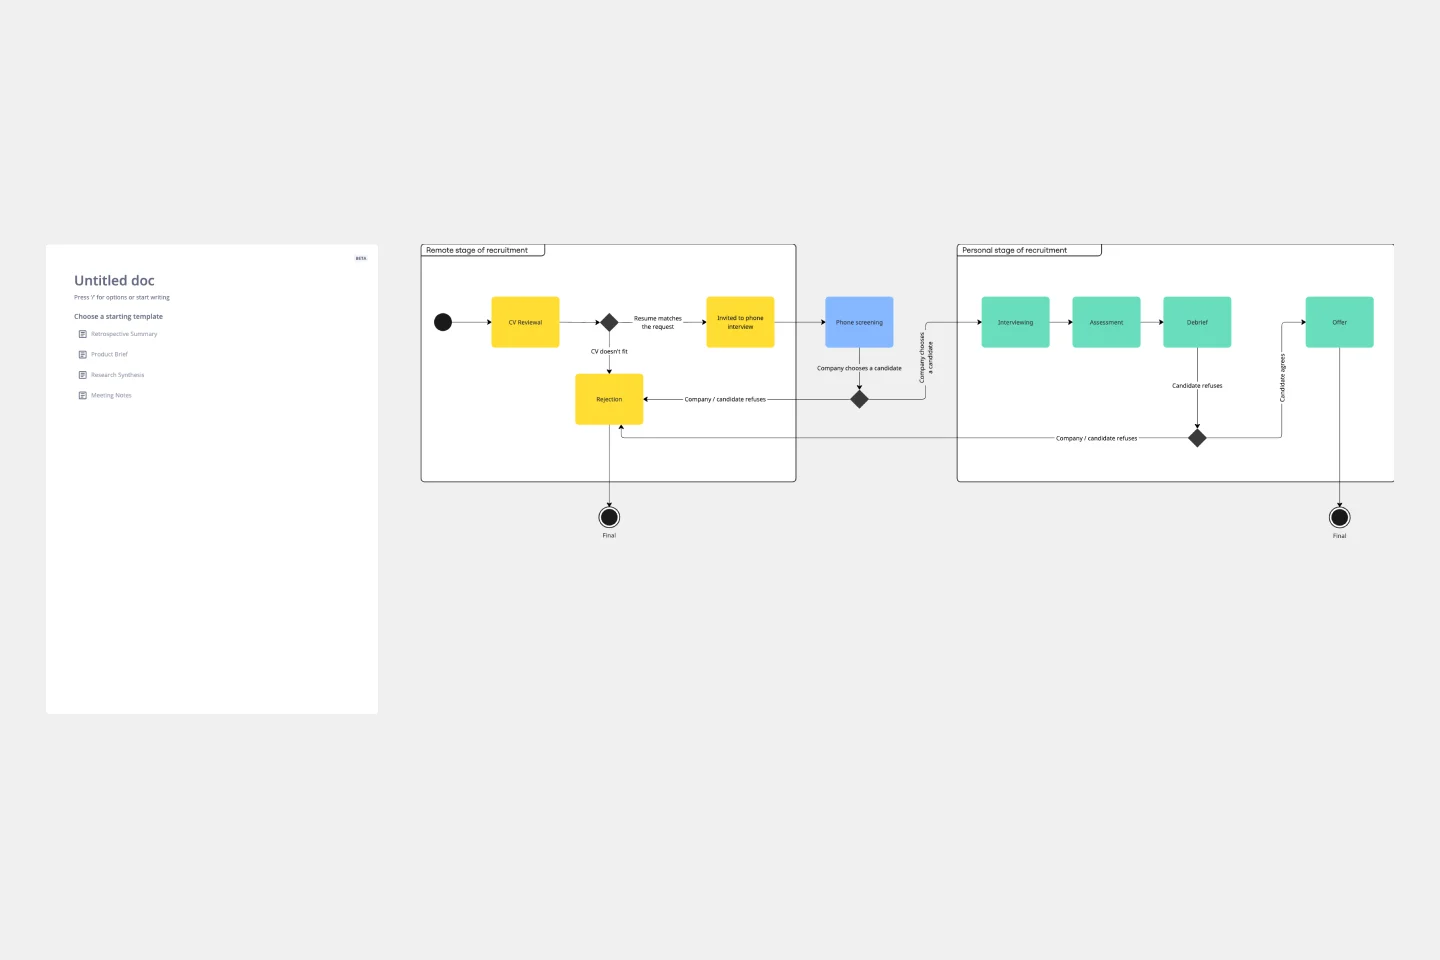
Job Search Process Diagram
Works best for:
Diagramming
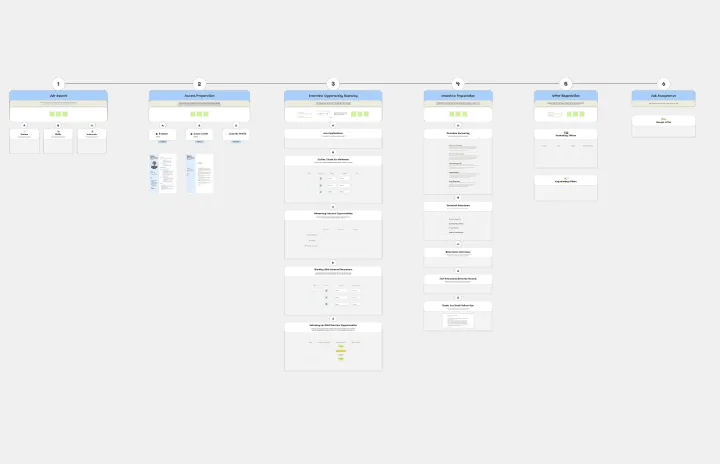
The Job Search Process Diagram template offers a visual tool for mapping out the steps and stages involved in the job search process. It provides a structured framework for organizing tasks, tracking progress, and managing resources. This template enables job seekers to streamline their job search efforts, stay organized, and increase their chances of success. By promoting clarity and efficiency, the Job Search Process Diagram empowers individuals to navigate the job market effectively and achieve their career goals.
UML Activity Diagram Template
Works best for:
Diagrams
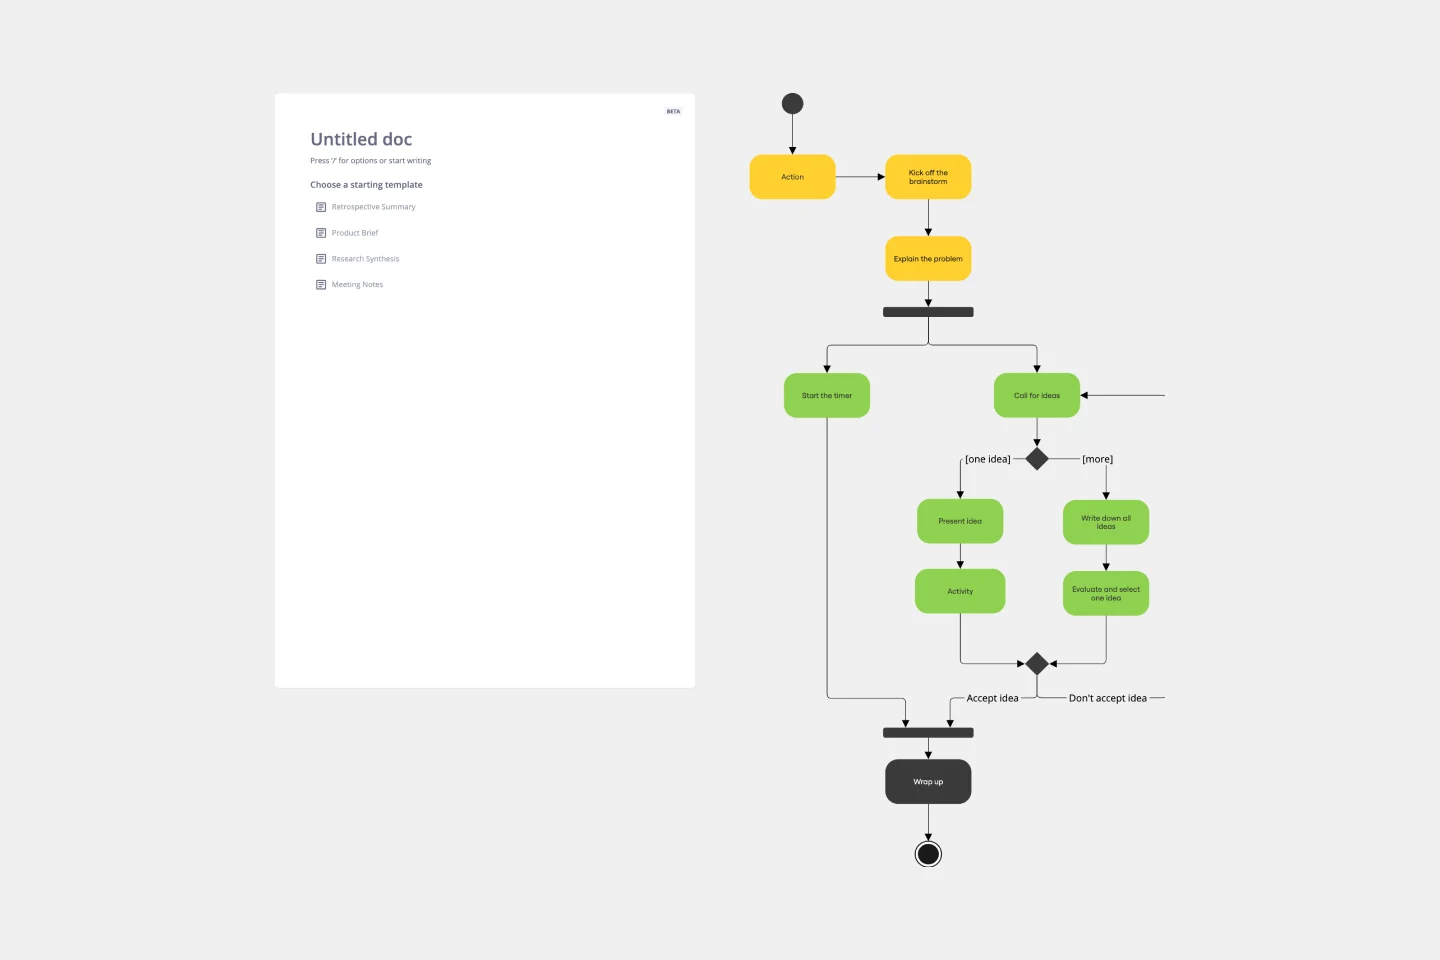
Use our Activity Diagram template to break down activities into smaller decisions and subprocesses. Improve and optimize systems and processes in I.T., business management, and more.
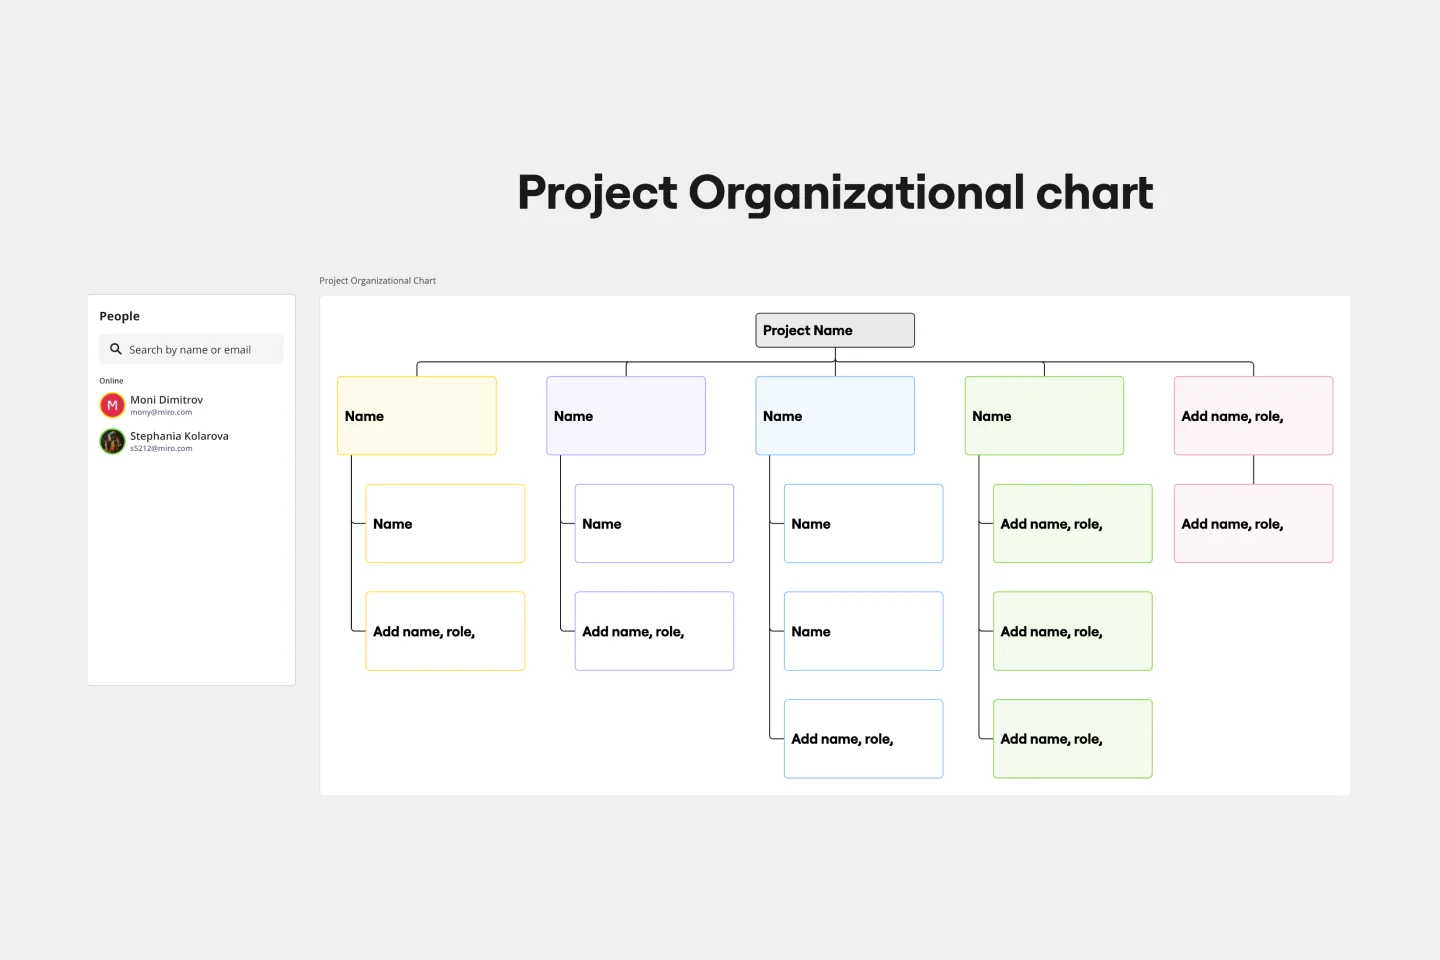
Project Organizational Chart Template
Works best for:
Project Management, Documentation, Org Charts
When you’re embarking on a long, complex project, you will inevitably hit roadblocks and obstacles. It’s important to have your project organizational chart on hand to overcome those challenges. A project organizational chart is a visual diagram that illustrates who is on your team and the role they play in a given project. It documents the structure of the project organization, the hierarchy between team members, and the relationships between employees. Project organizational charts are useful tools for clarifying who does what, securing buy-in, and setting expectations for the group.
UML State Machine Diagram Template
Works best for:
Software Development, Mapping, Diagrams
Visualize the workflow of a process and how objects perform actions based on different stimuli. State machine diagrams are valuable for understanding how an object responds to events at the different stages of its life cycle. They are also helpful for visualizing event sequences in a system.
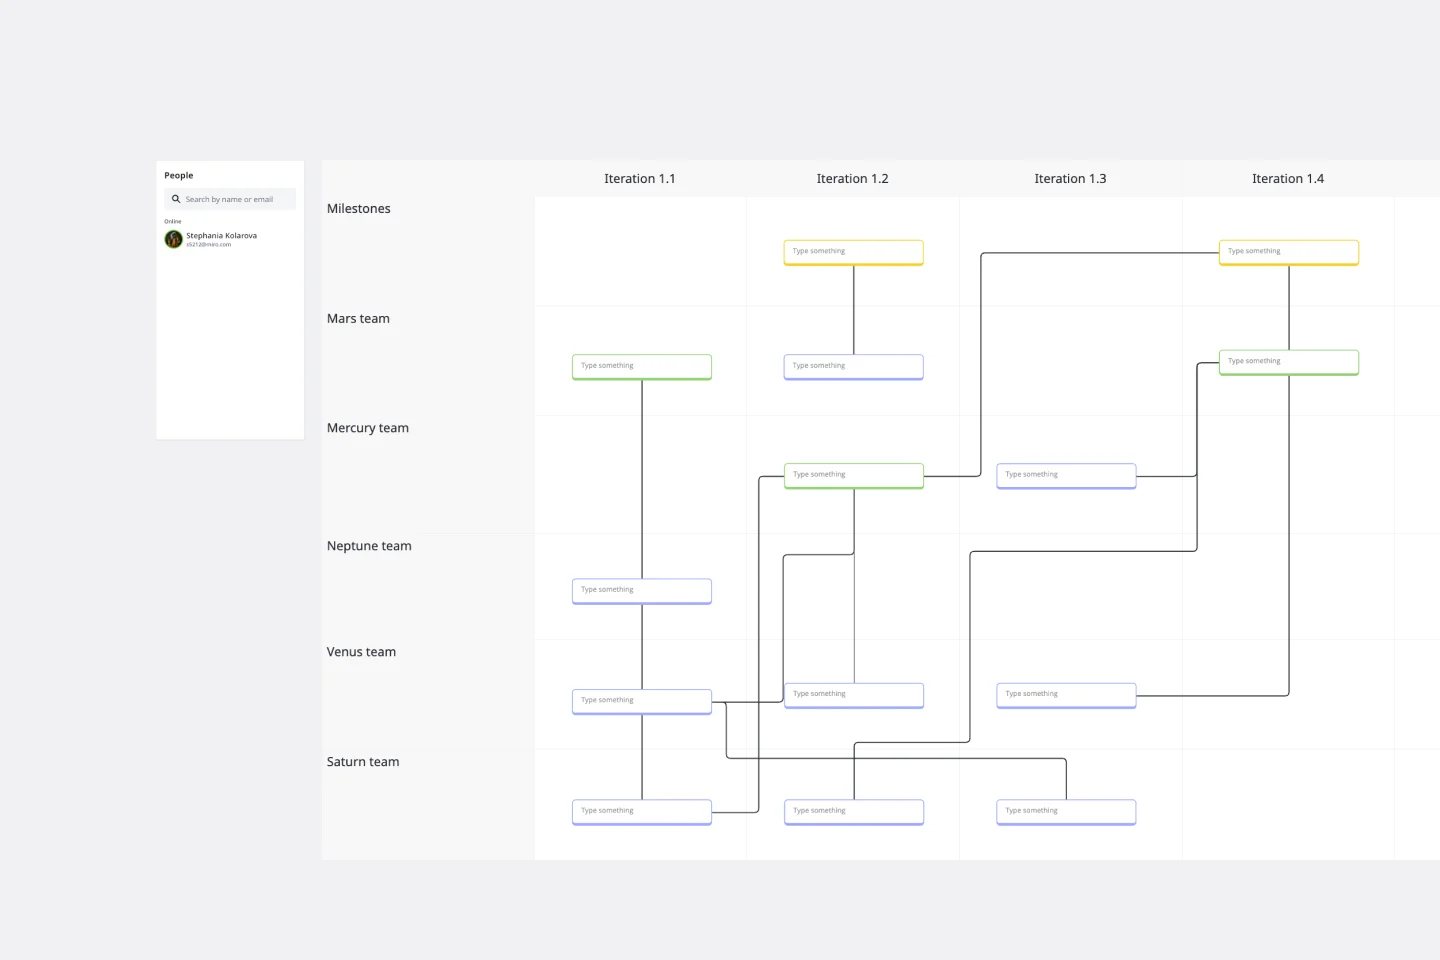
SAFe Program Board
Works best for:
Agile Methodology, Diagrams, Agile Workflows
Many organizations use the Agile model, but even companies that don’t rigorously adhere to all Agile standards have adopted Agile tools and methods like Program Increment (PI) Planning. Even if you’re not participating in a formal PI session, a program board can be a great way to establish communication across teams and stakeholders, align development objectives with business goals, clarify dependencies, and foster cross-functional collaboration. The board provides much-needed structure to planning sessions, yet is adaptable enough to accommodate brainstorming and alignment meetings.