Azure Demand Forecasting Template
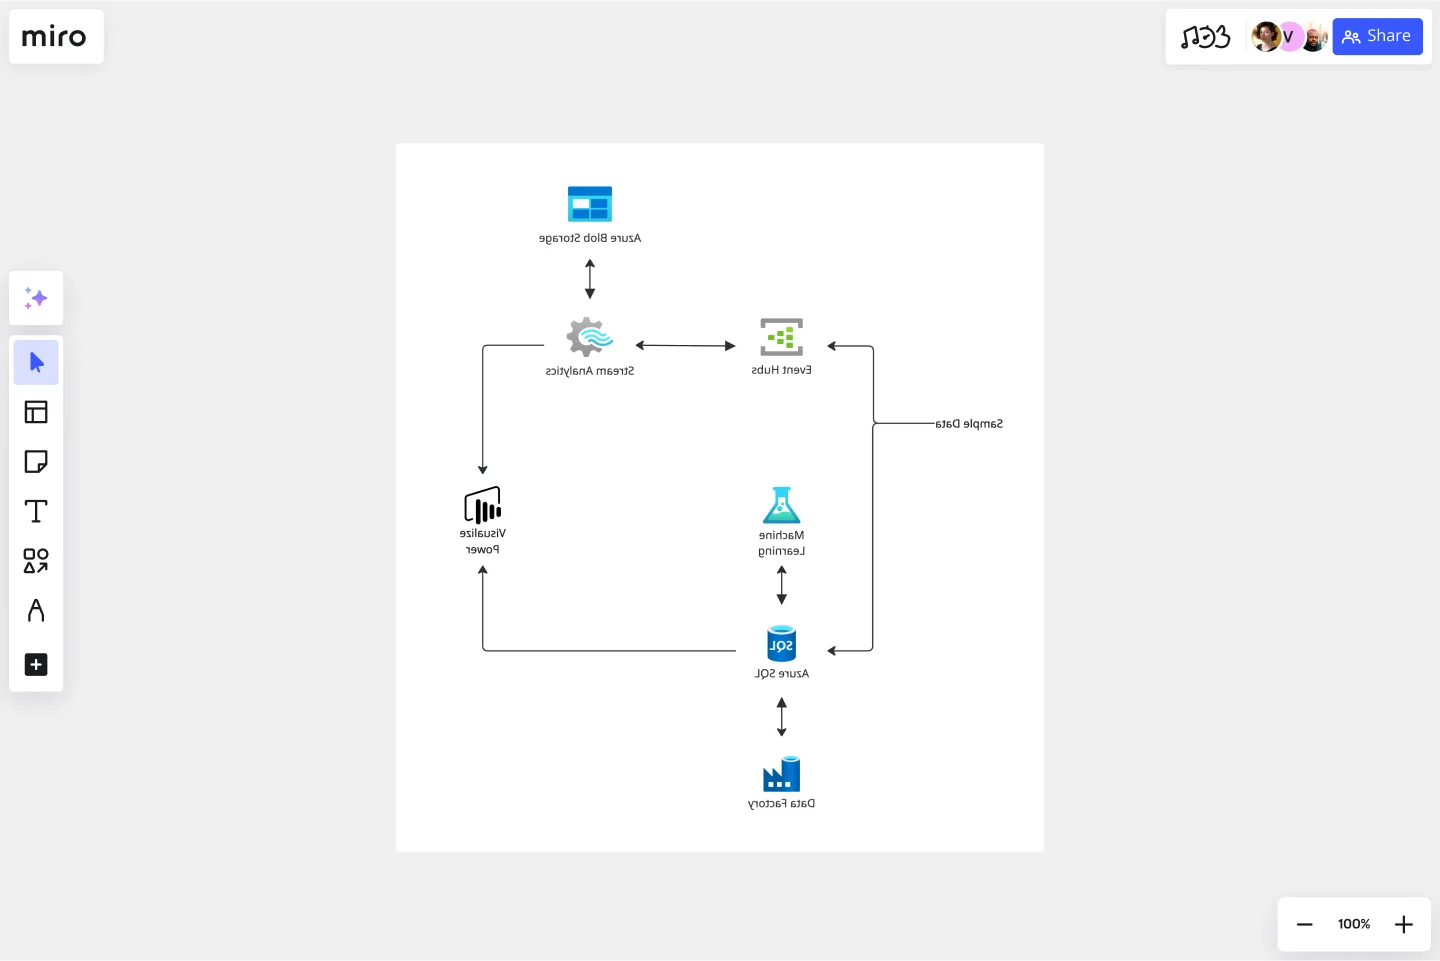
The Azure Demand Forecasting diagram will show the architecture of a demand forecast, making it easier for you to predict data consumption, costs, and forecast results.
Available on Enterprise, Business, Education plans.
About the Azure Demand Forecasting
The Azure Demand Forecasting diagram will show the architecture of a demand forecast, making it easier for you to predict data consumption, costs, and forecast results. Azure is Microsoft’s cloud computing platform, designed to provide cloud-based services such as remote storage, database hosting, and centralized account management.
Keep reading to learn more about the Azure Demand Forecasting Template.
What is an Azure Demand Forecasting Template
The Azure Demand Forecasting Template, like any other diagram, visually shows the necessary steps for demand forecasting. The Azure Demand Forecasting Template has unique icons categorized into Stencils. Each Stencil focuses on a specific task to make it easier for users to access the right set of icons.
When to use Azure Demand Forecasting Template
You can use the Azure Demand Forecasting Template to predict demand for a product in a retail/online store, forecast hospital visits, and anticipate power consumption.
The Azure Demand Forecasting Template combines several Azure services to provide actionable predictions:
Event Hubs collects real-time consumption data.
Stream Analytics aggregates the streaming data and makes it available for visualization.
Azure SQL Database stores and transforms the consumption data.
Machine Learning implements and executes the forecasting model.
Power BI visualizes the real-time energy consumption and the forecast results.
Finally, Data Factory orchestrates and schedules the entire data flow.
How-To Section:
Here are some of the Stencils and their meaning when implementing the Azure Demand Forecasting Template:
How do I make an Azure Demand Forecasting Template?
To make an Azure Demand Forecasting in Miro is easy. You can use our Azure Demand Forecasting Template and customize it as you see fit. Once you have the diagram structure, you can start adding the icons. You can find the icons under our Azure Icon Set integration.
Get started with this template right now. Available on Enterprise, Business, Education plans.
Cause and Effect Diagram Template
Works best for:
Diagramming
The Cause and Effect Diagram Template is a useful tool for analyzing complex relationships, identifying root causes of problems, and improving organizational processes. It can be customized to fit user's unique needs and provides a structured framework for analysis. Teams can use real-time collaborative analysis on the Miro platform to drive continuous improvement initiatives.
Design Research Template
Works best for:
UX Design, Design Thinking, Desk Research
A design research map is a grid framework showing the relationship between two key intersections in research methodologies: mindset and approach. Design research maps encourage your team or clients to develop new business strategies using generative design thinking. Originally designed by academic Liz Sanders, the framework is meant to resolve confusion or overlap between research and design methods. Whether your team is in problem-solving or problem space definition mode, using a research design template can help you consider the collective value of many unrelated practices.
PI Planning Template
Works best for:
PI Planning, Product Management
The Miro PI Planning Template streamlines the Program Increment planning process for Agile teams. It facilitates a collaborative environment, enabling teams to efficiently align on strategies, identify dependencies, and convert decisions into actionable tasks. With features like real-time collaboration, Jira integration, and a centralized workspace, the template supports teams in enhancing efficiency, engagement, and decision-making.
User Persona Template
Works best for:
Marketing, Desk Research, User Experience
A user persona is a tool for representing and summarizing a target audience for your product or service that you have researched or observed. Whether you’re in content marketing, product marketing, design, or sales, you operate with a target in mind. Maybe it’s your customer or prospect. Maybe it’s someone who will benefit from your product or service. Usually, it’s a whole collection of personalities and needs that intersect in interesting ways. By distilling your knowledge about a user, you create a model for the person you hope to target: this is a persona.
5 Whys Template
Works best for:
Design Thinking, Operations, Mapping
Ready to get to the root of the problem? There’s no simpler way to do it than the 5 Whys technique. You’ll start with a simple question: Why did the problem happen? Then you’ll keep asking, up to four more times, until the answer becomes clear and you can work toward a solution. And Miro’s features enhance the approach: You can ask team members questions in chat or @mention them in comments, and use color-coded sticky notes to call out issues that are central to the problem at hand.
Cloudflare RAG Architecture Knowledge Seeding Template
The Cloudflare RAG Architecture Knowledge Seeding template in Miro streamlines the sharing and visualization of cloud architecture knowledge, making it ideal for tasks like cloud infrastructure optimization and diagram creation. This template enables straightforward documentation and collaboration, ensuring complex information is accessible to all team members.
