Azure Data Flow Template
Combine data and build and deploy custom machine learning models at scale.
Available on Enterprise, Business, Education plans.
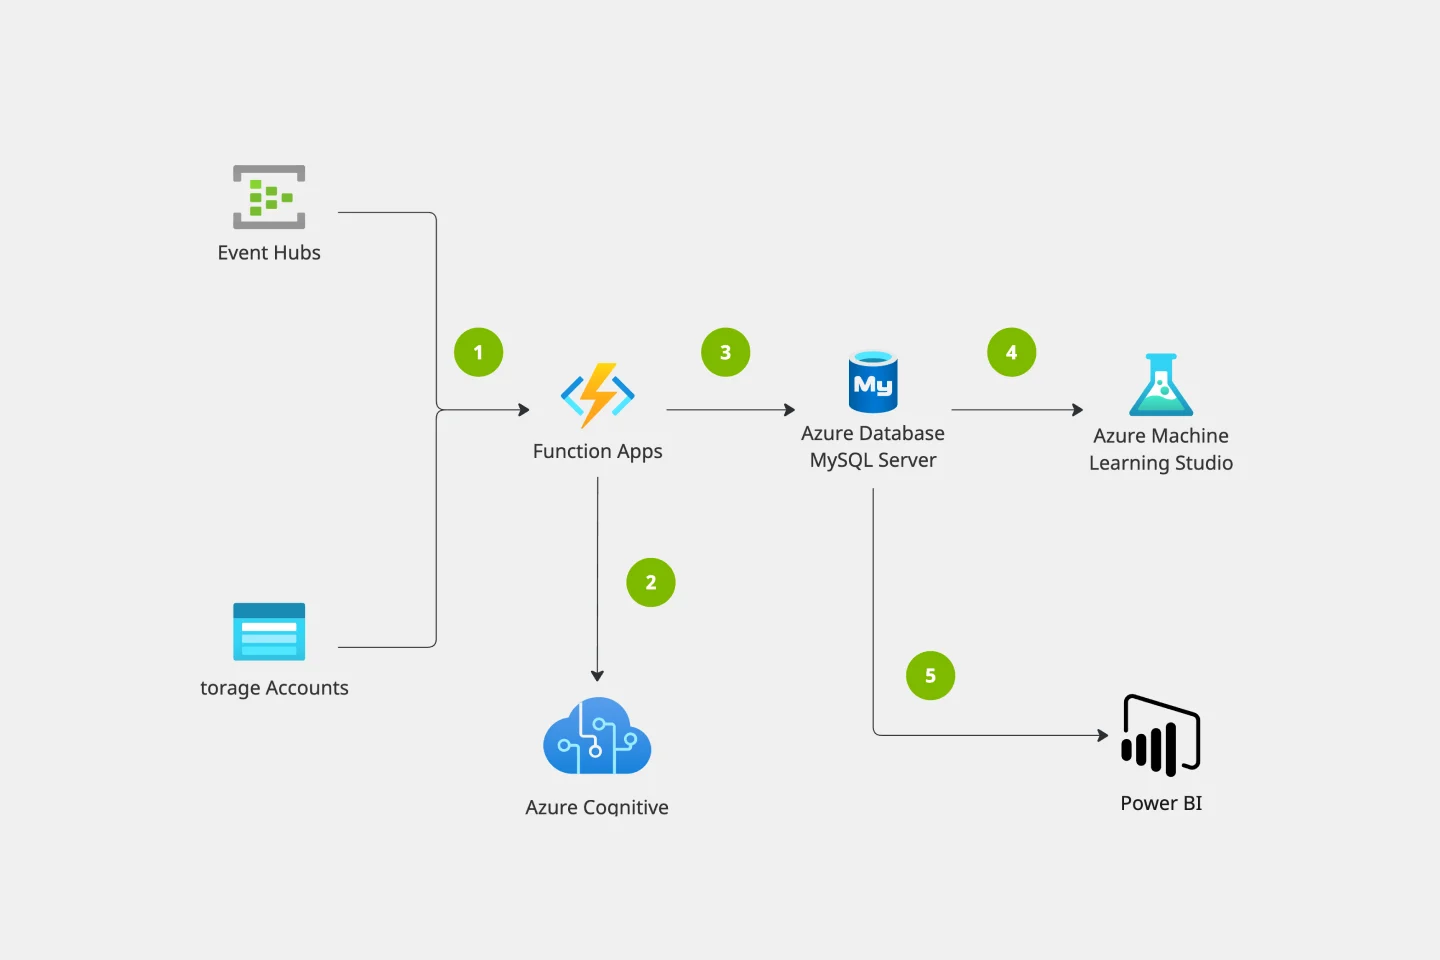
About the Azure Data Flow Template
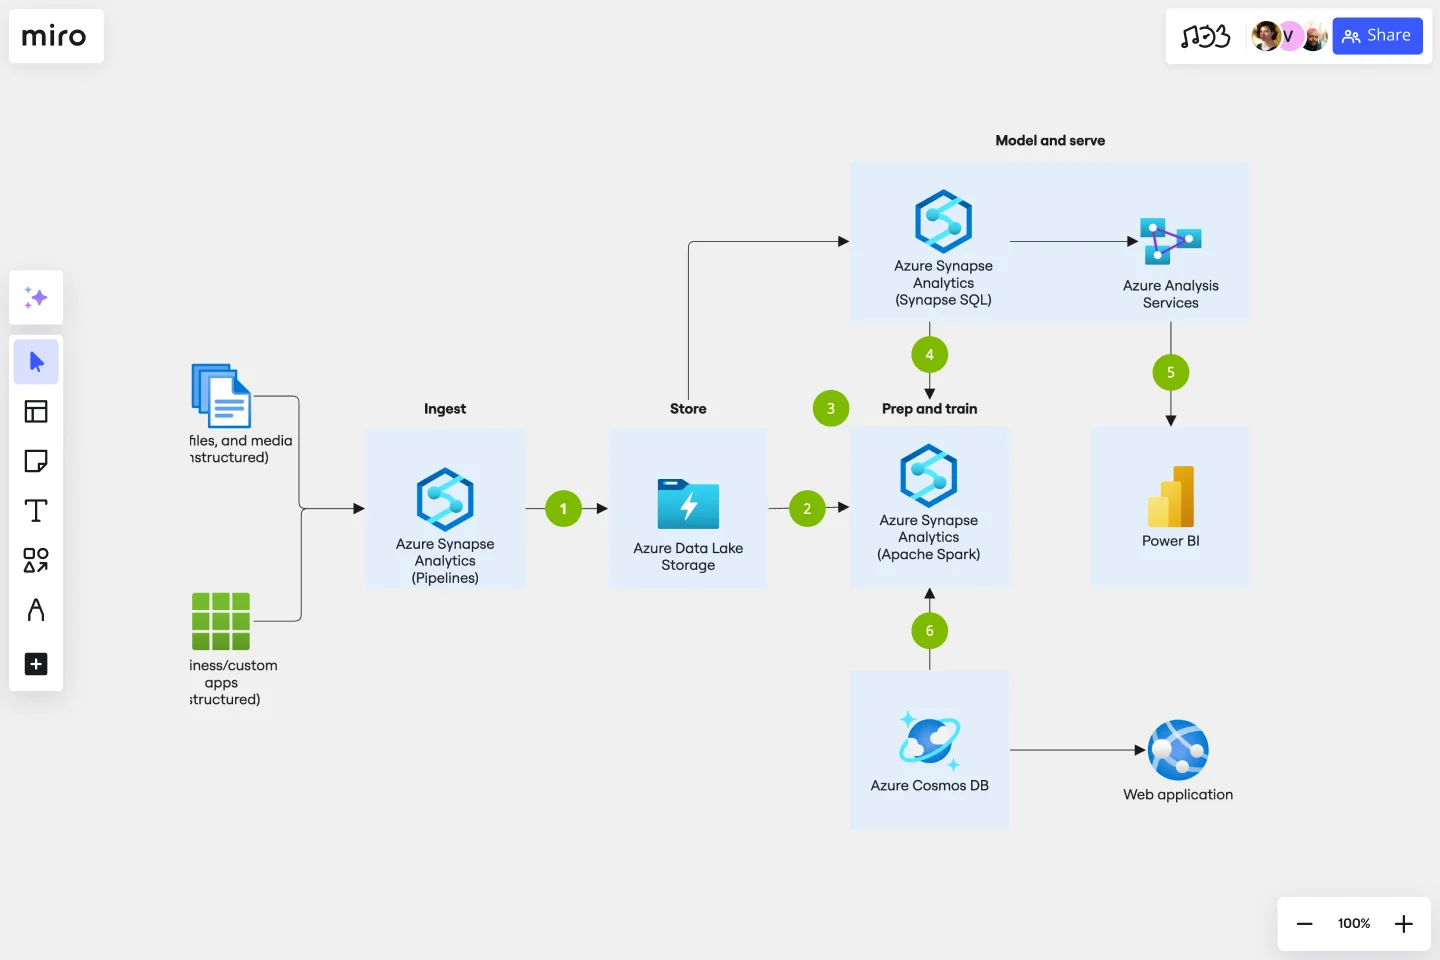
The Azure Data Flow Template will show you how to transform your data into actionable insights using the best-in-class machine learning tools. This architecture allows you to combine data and build and deploy custom machine learning models at scale.
Keep reading to learn more about the Azure Data Flow Template.
What is an Azure Data Flow Template
The Azure Data Flow Template visually shows the data flow to deploy and build custom machine learning models. The Azure Data Flow Template has unique icons categorized into Stencils. Each Stencil focuses on a specific task to make it easier for users to access the right set of icons.
When to use Azure Data Flow Template
You can use the Azure Data Flow Template to transform your data into actionable insights and better inform decision making. Collect data, analyze it, and use it to make decisions surrounding your architecture, from cost data, to performance, to user load, using data will guide you to make the right choices in your environment.
To build your Azure Data Flow Template, check out these best practices:
Do’s
Use the icon to illustrate how products can work together
In diagrams, we recommend to include the product name somewhere close to the icon
Use the icons as they would appear within Azure
Don’ts
Don’t crop, flip or rotate icons
Don’t distort or change icon shape in any way
Don’t use Microsoft product icons to represent your product or service.
How do I make an Azure Data Flow Template?
To make an Azure Data Flow in Miro is easy. You can use our Azure Data Flow Template and customize it as you see fit. Once you have the diagram structure, you can start adding the icons. You can find the icons under our Azure Icon Set integration.
Get started with this template right now. Available on Enterprise, Business, Education plans.
Likert Scale Template
Works best for:
Desk Research, Decision Making, Product Management
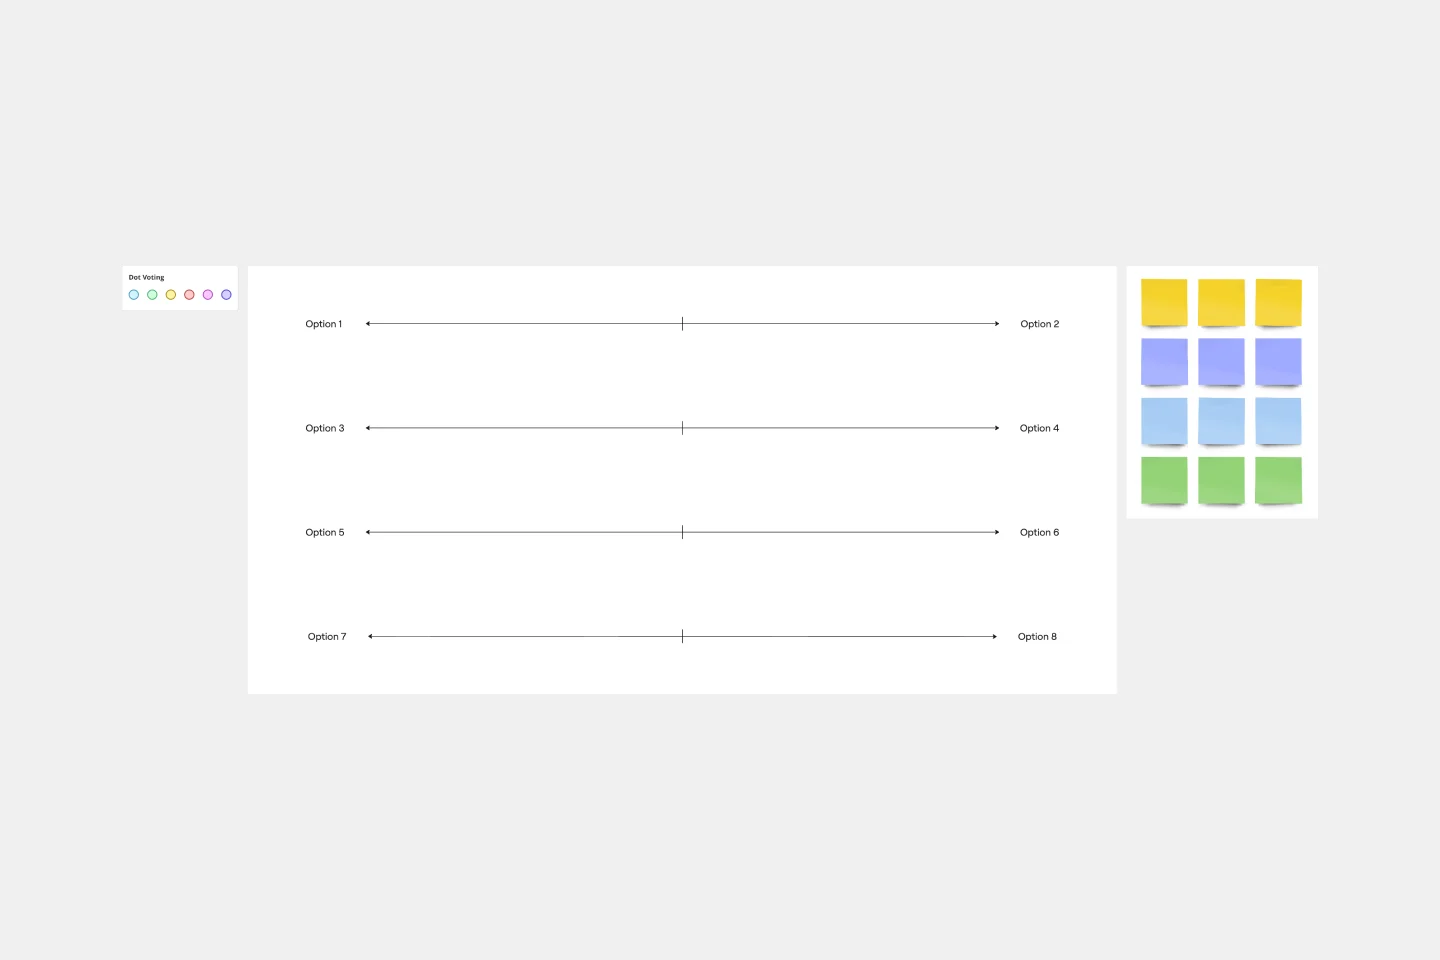
It’s not always easy to measure complex, highly subjective data — like how people feel about your product, service, or experience. But the Likert scale is designed to help you do it. This scale allows your existing or potential customers to respond to a statement or question with a range of phrases or numbers (e.g., from “strongly agree” to “neutral,” to “strongly disagree,” or from 1 to 5). The goal is to ask your customer some specific questions to turn into easy-to-interpret actionable user insights.
Kubernetes Architecture Diagram Template
Works best for:
Software Development, Diagrams
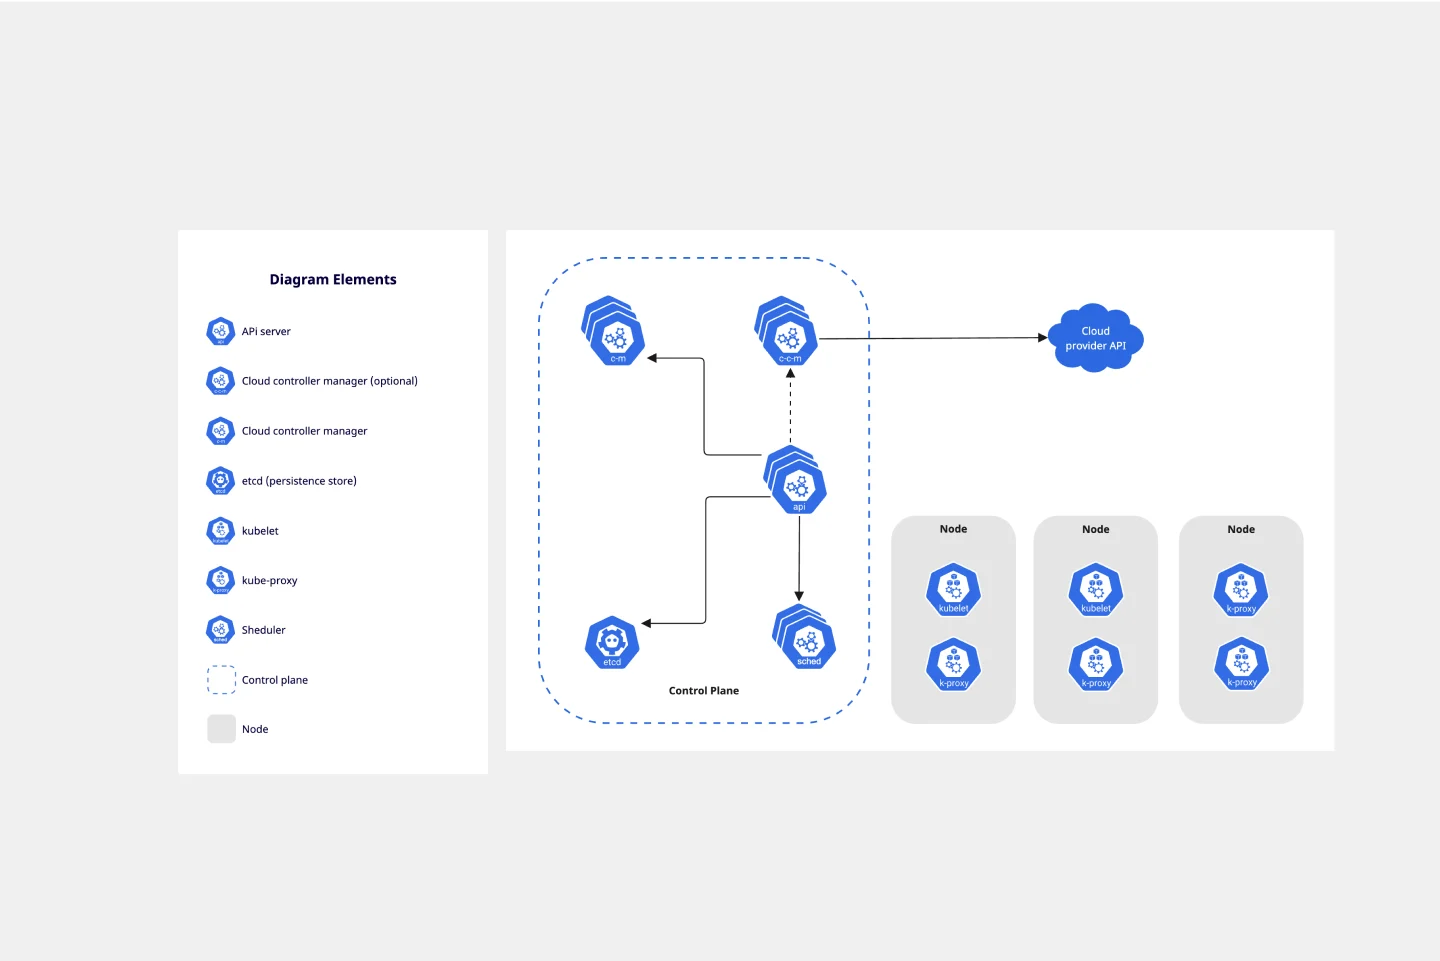
Use the Kubernetes Architecture Diagram template to manage your containerized applications better and bring your apps’ deployment, management, and scalability to the next level. This template helps you lower the downtime in production and allows you to have a more agile app production. Improve the deployment of your apps by visualizing every step of the process with the Kubernetes Architecture template. Try it out, and see if it works for you and your team.
User Flow Template
Works best for:
Desk Research, Flowcharts, Mapping
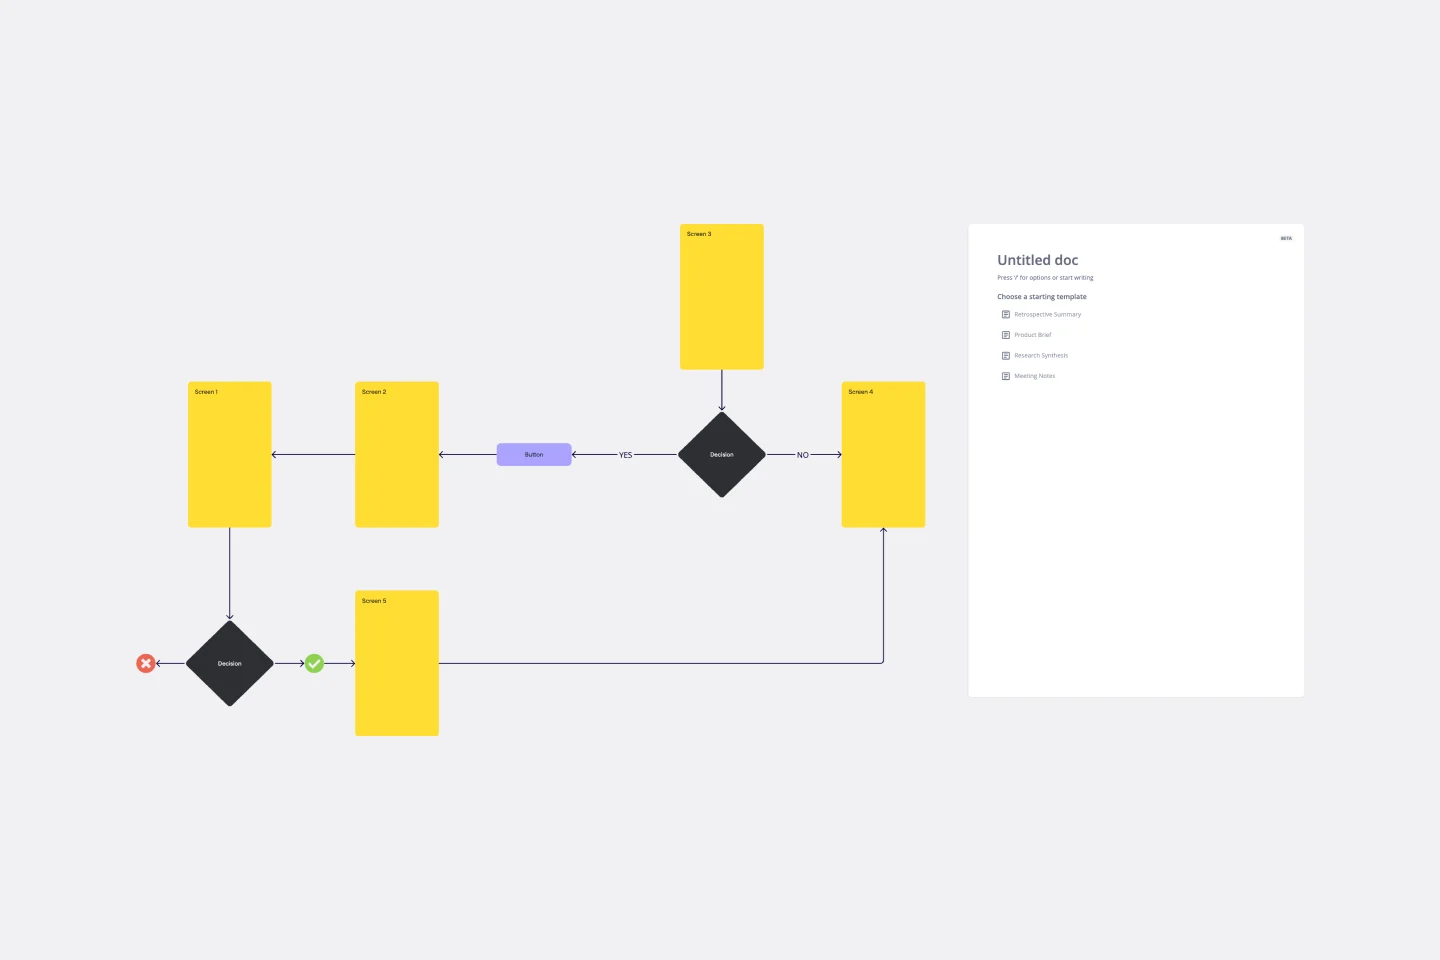
User flows are diagrams that help UX and product teams map out the logical path a user should take when interacting with a system. As a visual tool, the user flow shows the relationship between a website or app’s functionality, potential actions a user could take, and the outcome of what the user decides to do. User flows help you understand what a user does to finish a task or complete a goal through your product or experience.
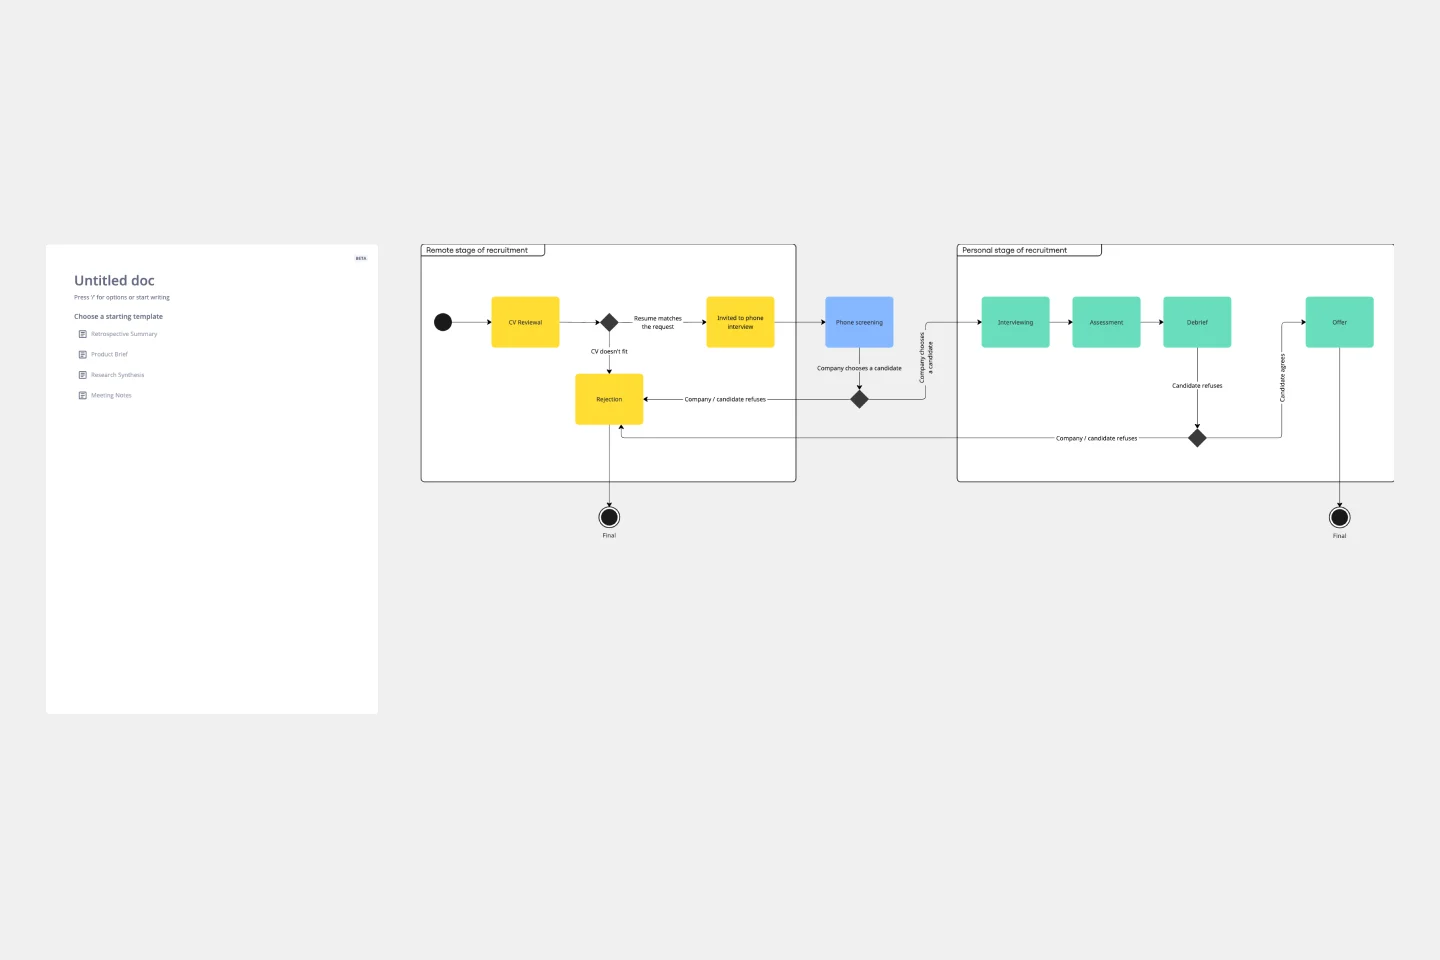
UML State Machine Diagram Template
Works best for:
Software Development, Mapping, Diagrams
Visualize the workflow of a process and how objects perform actions based on different stimuli. State machine diagrams are valuable for understanding how an object responds to events at the different stages of its life cycle. They are also helpful for visualizing event sequences in a system.
Azure Architecture Diagram Template
Works best for:
Software Development, Diagrams
The Azure Architecture Diagram Template is a diagram that will help you visualize the combination of any data and build and deploy custom machine learning models at scale. Azure is Microsoft’s cloud computing platform, designed to provide cloud-based services such as remote storage, database hosting, and centralized account management. Use Azure Architecture Diagram template to build sophisticated, transformational apps.
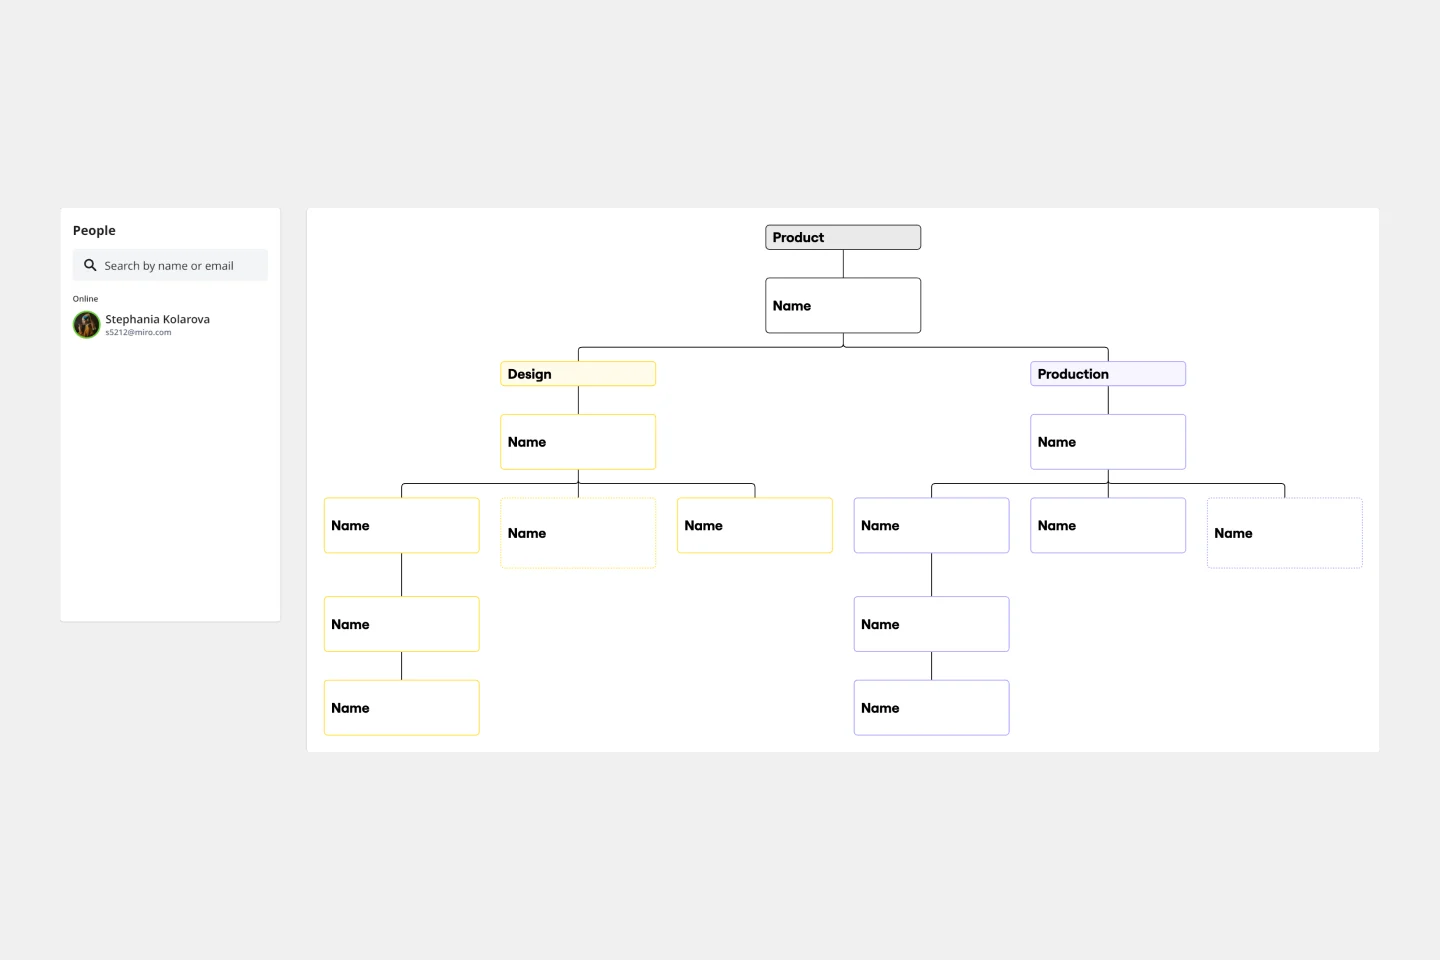
Business Organizational Chart Template
Works best for:
Leadership, Org Charts, Operations
Establishing hierarchy in a business can empower employees—to know their roles and responsibilities, team members, potential cross-functional collaborators, and who to turn to with a specific need. That’s just what a Business Organizational Chart does. And this template makes it simple to build a BOC for your company. The first step is to determine the high-level organizational structure of your company. Then it's easy to create a visual representation of how different employees are interconnected.