Ansoff Matrix Template
Explore opportunities for growing your business with the Ansoff Matrix Template.
About the Ansoff Matrix template
When your business is doing well, it can be easy to slip into complacency. But if your organization is to keep growing and scaling, you’ll have to look for new ways to boost your bottom line and reach new customers. The Ansoff Matrix, also known as the product or market expansion grid, can help you do just that.
An Ansoff Matrix is a strategic tool that allows you to evaluate numerous options for growing your business. It helps you evaluate the potential risks of each option and to devise a plan that fits your specific organization. Igor Ansoff developed the matrix in 1957, and since then, numerous business leaders have used it to jumpstart their business’s growth.
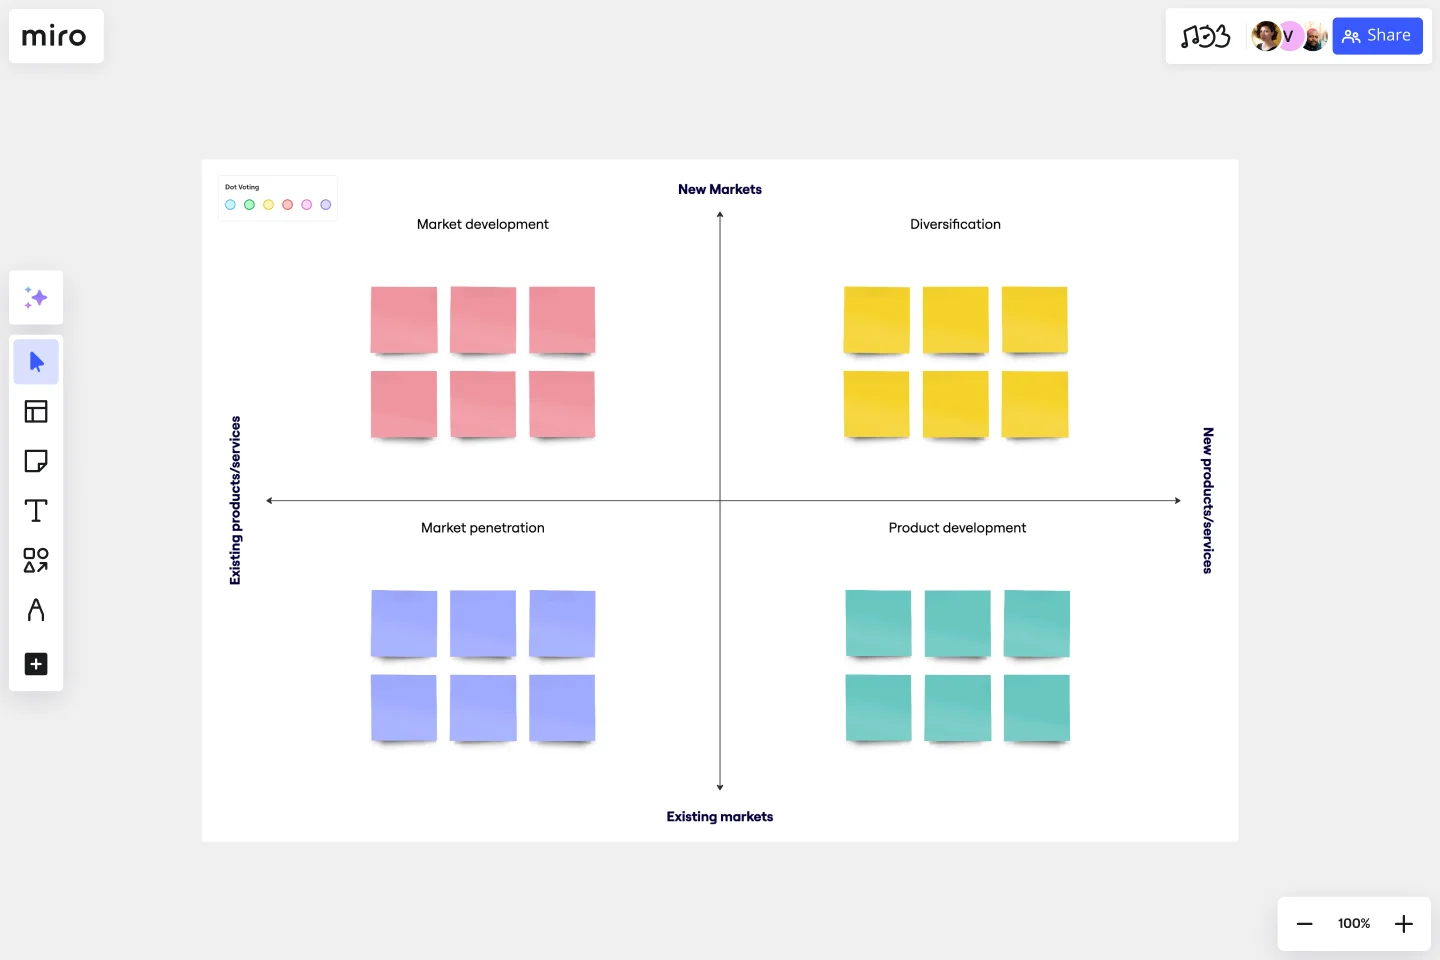
While there are some variations, the typical Ansoff Grid contains four quadrants. Each quadrant contains a potential growth strategy. Whenever you move into a new quadrant, either horizontally or vertically, your risk increases.
How do you use the Ansoff Matrix?
The Ansoff Matrix is divided into four sections that place markets and products/services depending on whether they already exist or represent a future opportunity. The four sections are market penetration, market development, product development, and diversification. Market penetration refers to selling more of your products and services to existing customers, market development refers to entering new markets, product development refers to developing your existing products or services, and diversification refers to moving into new markets with new products and services, increasing sales with your existing customer base, and acquisition. Go through each section with your team and determine where there are areas for making changes or improvements.
When should you use the Ansoff Matrix?
You should use the Ansoff Matrix whenever you do strategic planning for your marketing organization. You may find it beneficial to fill out the matrix at least once a year, though potentially more frequently if conditions are changing rapidly in your industry.
What factors go into an Ansoff Matrix?
Factor 1 - Market penetration. The lower left quadrant contains the safest of the four options. Market penetration focuses on boosting sales of your product in your existing market. This is a low-risk option because you already know the market and you’re aware of your product’s strengths and weaknesses relative to your competitors.
Factor 2 - Product development. The lower right quadrant is slightly more risky. In this approach, you’re introducing a new product into your existing market.
Factor 3 - Market development. The upper left quadrant is even riskier. In this case, you’re launching an existing product in a new market. This strategy involves either finding a new use case for your product or adding features so that it meets a different customer need.
Factor 4 - Diversification. The upper right quadrant contains the riskiest option. You’re introducing a new product into a new market.
Get started with this template right now.
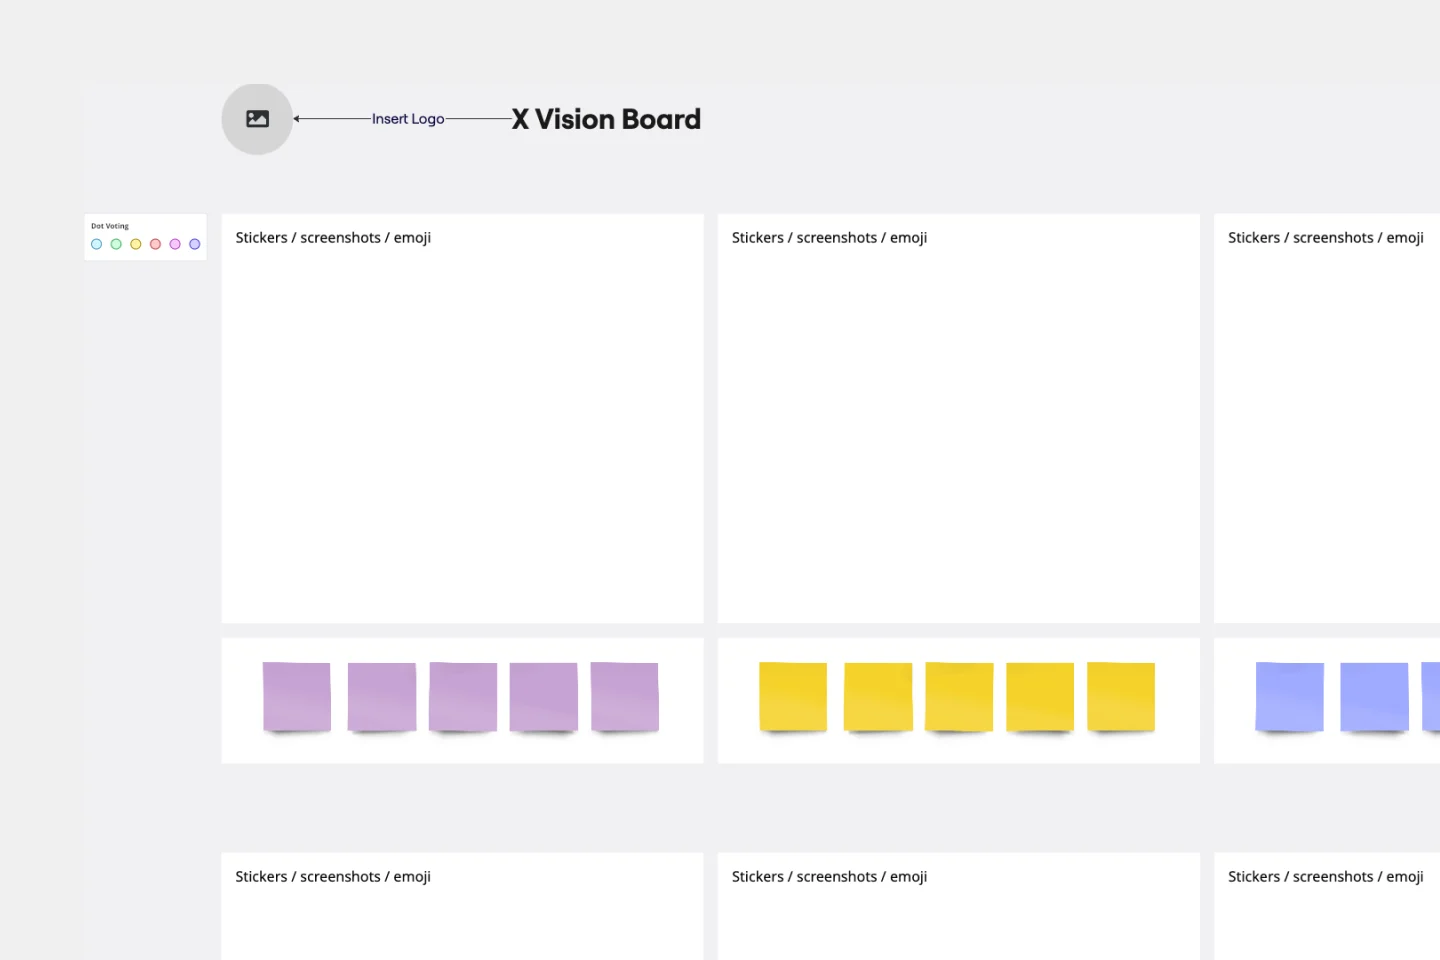
Vision Board Template
Works best for:
Strategy & Planning, Product Development
Miro's Vision Board Template helps teams to bring their vision to life. From visual representation to real time collaboration, this template facilitates planning, execution, and achievement of any project's goals.
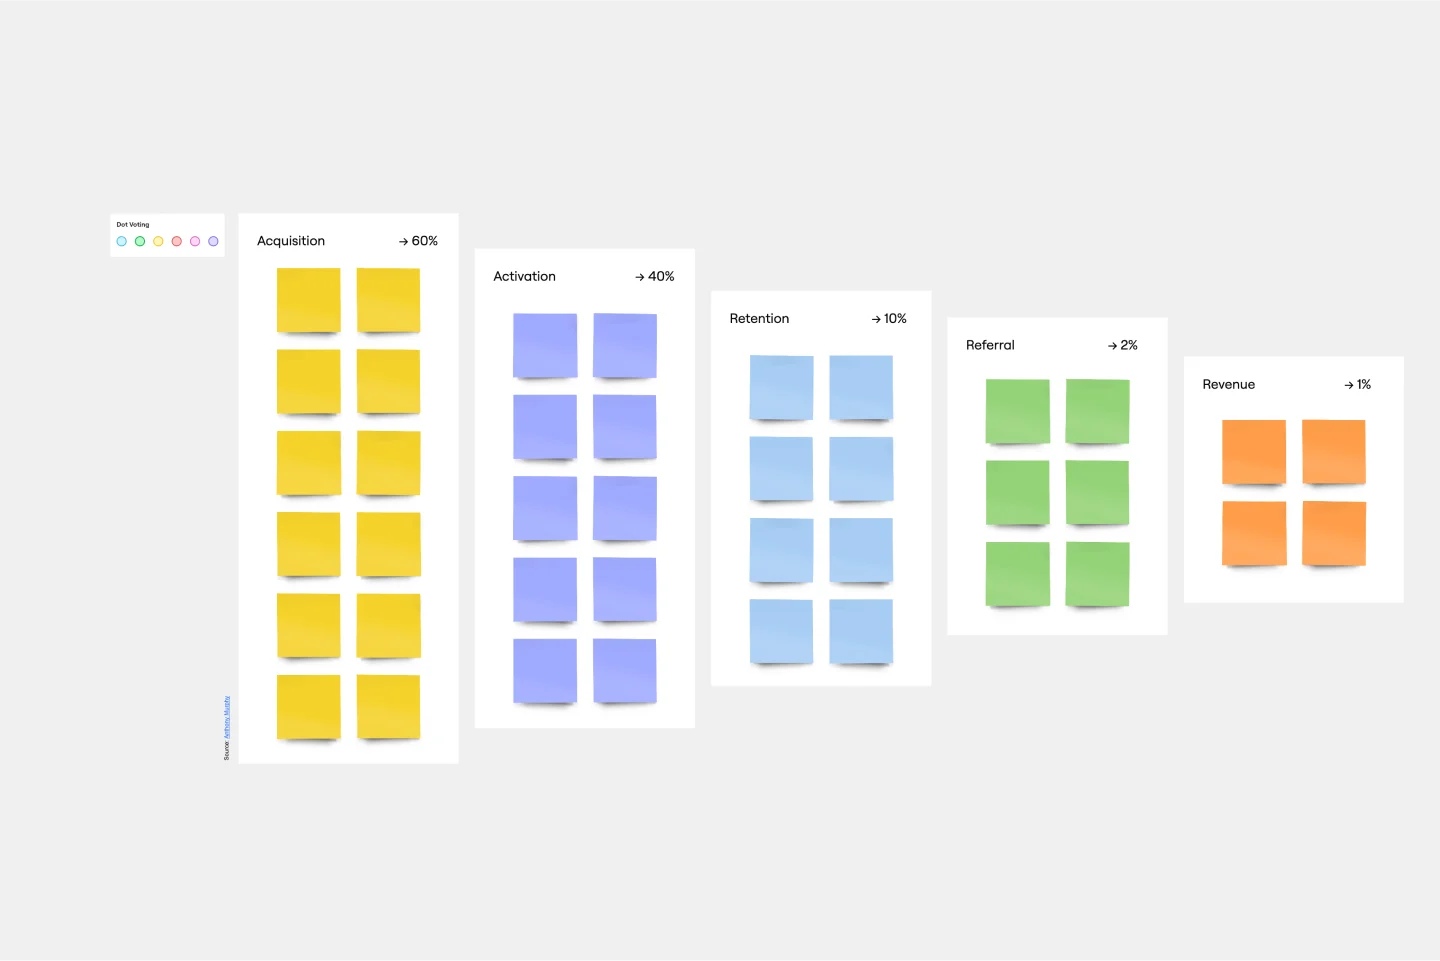
Conversion Funnel Backlog Template
Works best for:
Decision Making, Product Management, Prioritization
If you’re working on a product that has clear conversions, then it can help to structure your backlog around the conversion funnel to make sure you’re reaching your audience. Creating a conversion funnel backlog brings together information around potential pain-points in your funnel and opportunities for growth. Once you’ve identified that information, it becomes easier to prioritize. You and your team can use the conversion funnel backlog to focus on conversion, retention, and referral, or to tweak your workflow in more mature products.
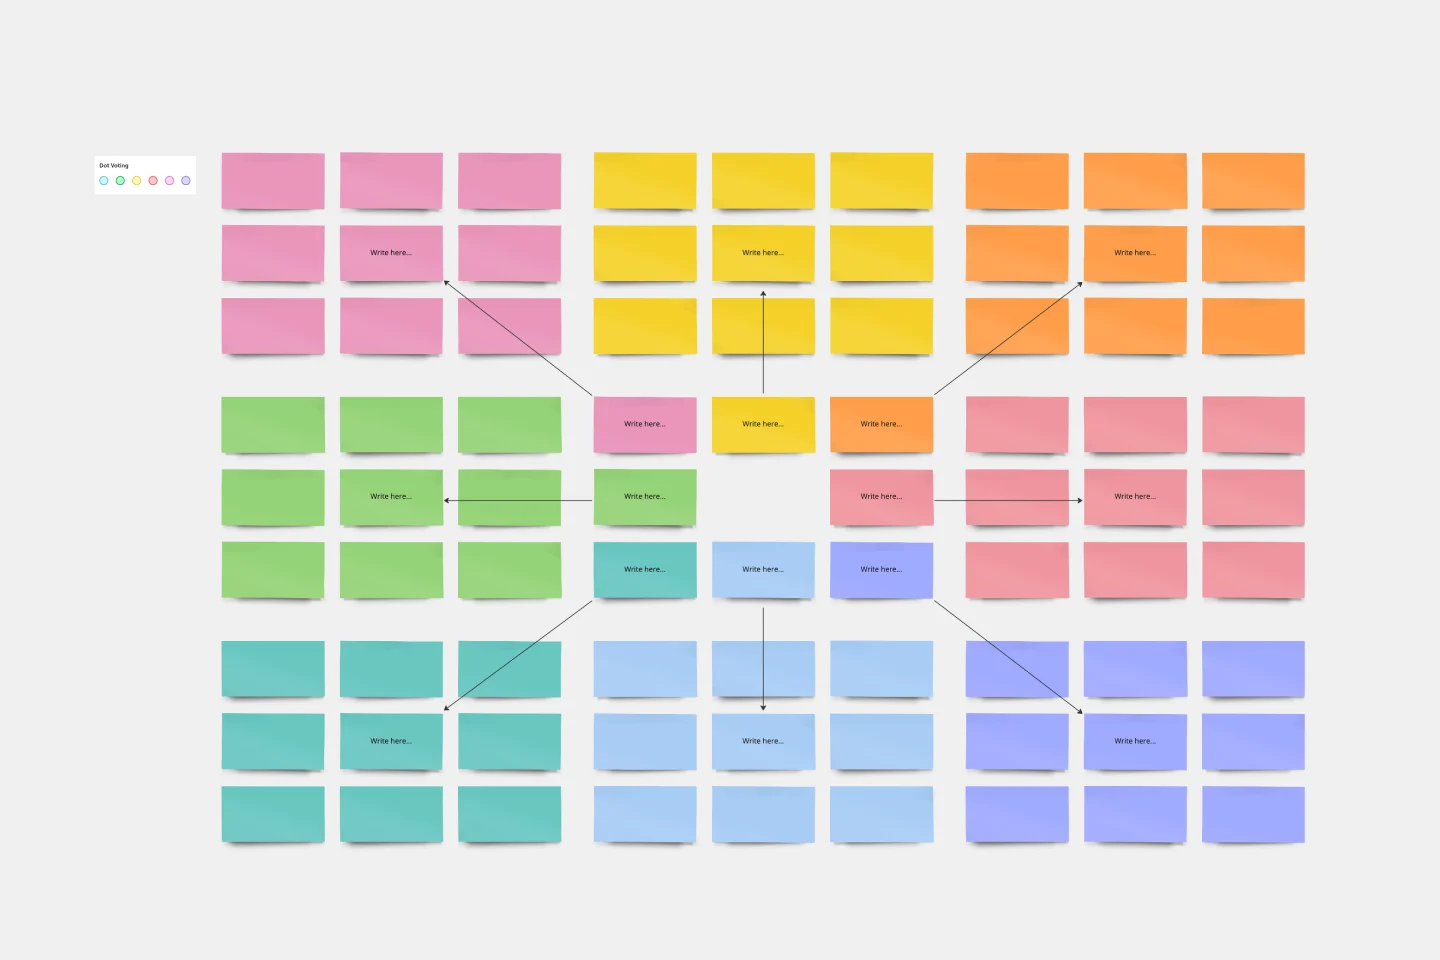
Mandala Chart Template
Works best for:
Planning, Brainstorming, Goal setting
The Mandala Chart Template helps you visualize the relationships between a central theme and its sub-themes. One of the key benefits is how it fosters a holistic understanding of any topic. This perspective ensures every detail is noticed, making it an invaluable asset for those aiming for comprehensive insight and thorough planning or a better understanding of their goals.
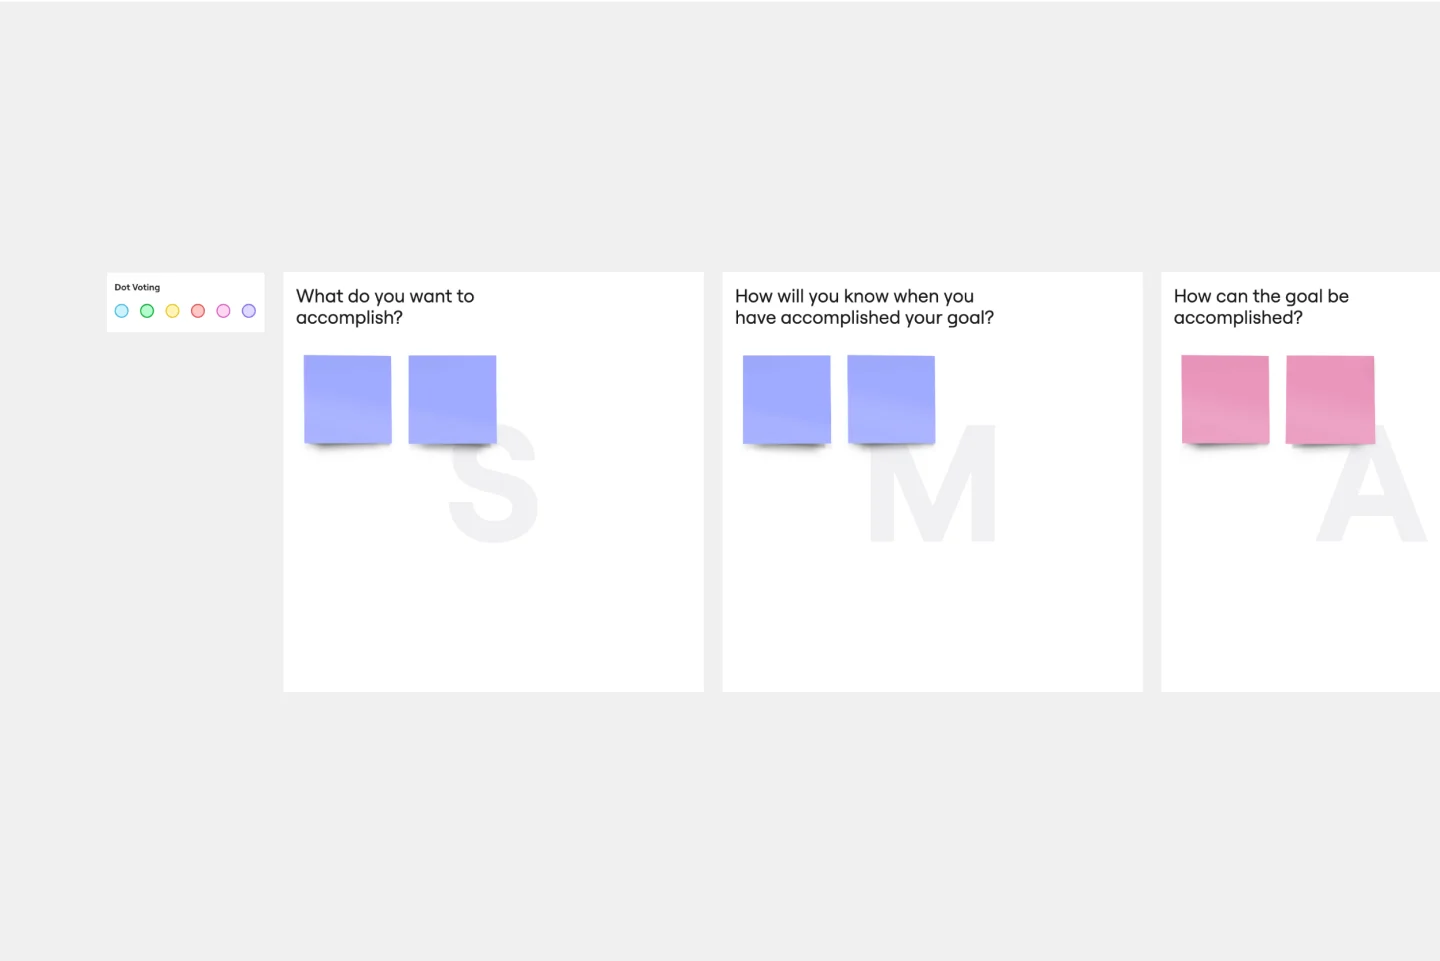
SMART Goals Template
Works best for:
Prioritization, Strategic Planning, Project Management
Setting goals can be encouraging, but can also be overwhelming. It can be hard to conceptualize every step you need to take to achieve a goal, which makes it easy to set goals that are too broad or too much of a stretch. SMART is a framework that allows you to establish goals in a way that sets you up for success. SMART stands for Specific, Measurable, Attainable, Relevant, and Timely. If you keep these attributes in mind whenever you set goals, then you’ll ensure your objectives are clear and reachable. Your team can use the SMART model anytime you want to set goals. You can also use SMART whenever you want to reevaluate and refine those goals.
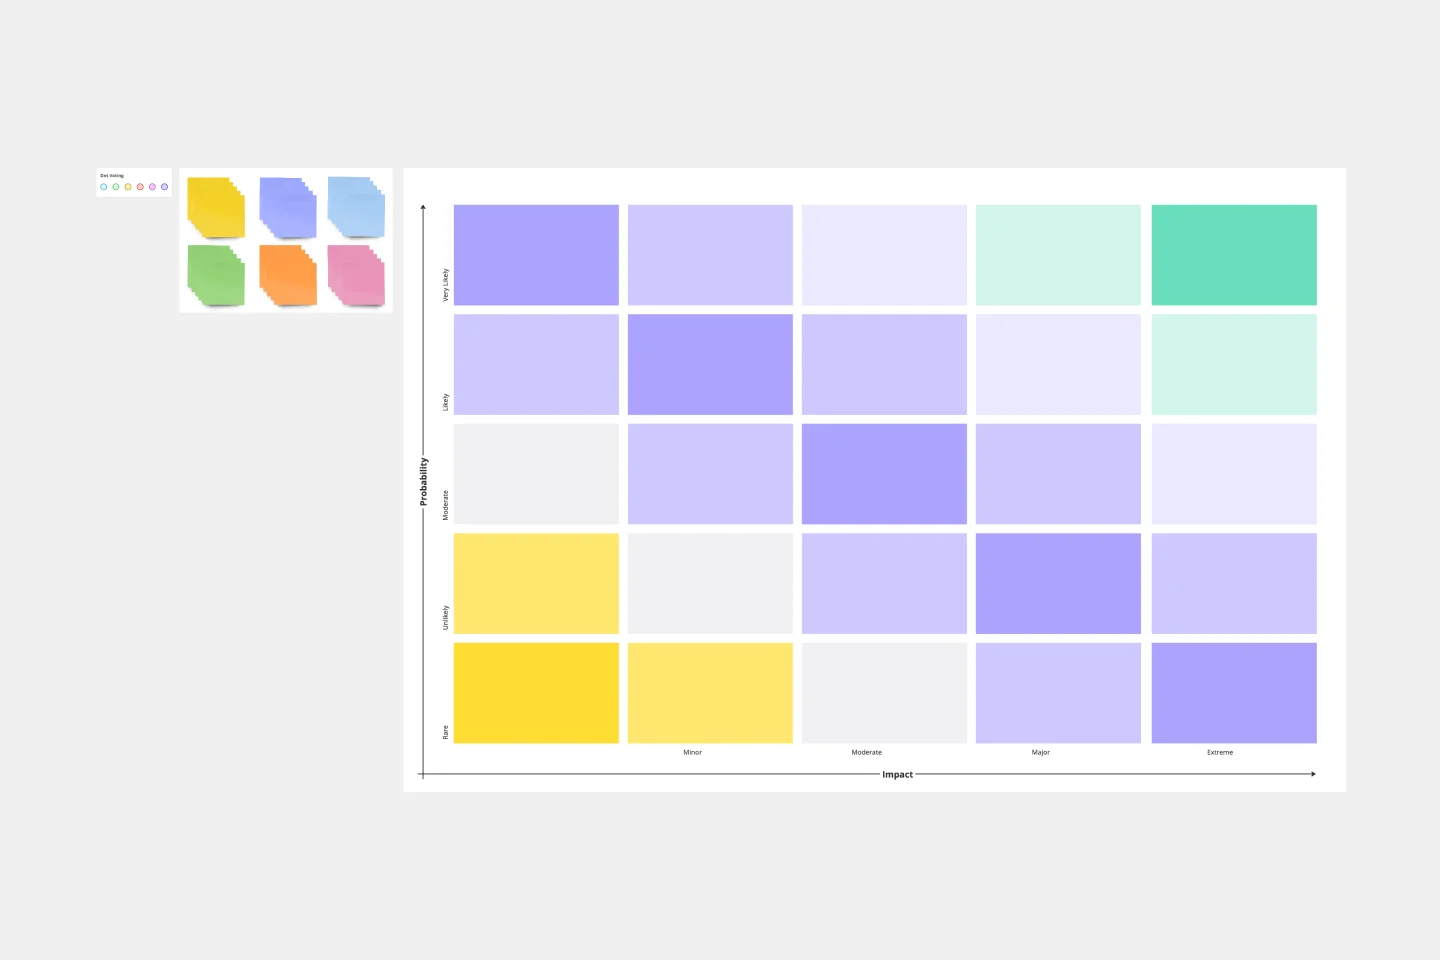
Risk Matrix Template
Works best for:
Leadership, Decision Making, Strategic Planning
A risk matrix--also known as a probability matrix, risk assessment matrix, or impact matrix--is a tool that allows you to evaluate overall risk by visualizing potential risks in a diagram. The tool allows you to weigh the severity of a potential risk against the probability that the risk might occur. Risk matrices are useful for risk management because they visually represent the risks involved in a decision. This empowers you to avoid worst-case scenarios by preparing contingencies or mitigation plans.
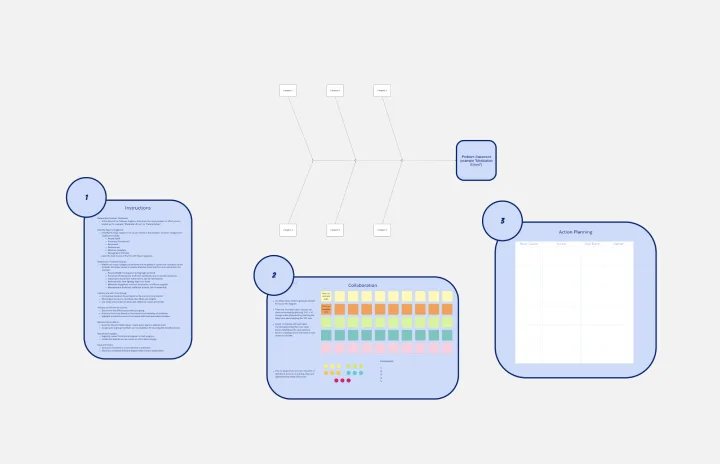
Fishbone Diagram for Healthcare
Works best for:
Fishbone Diagram
Ensuring high-quality care in healthcare settings requires a thorough understanding of root causes behind issues. The Fishbone Diagram for Healthcare template helps you analyze potential causes of problems in areas like patient care, staff performance, and administrative processes. This structured approach facilitates comprehensive analysis and collaborative problem-solving, ultimately leading to improved healthcare outcomes and patient satisfaction.