
Cross-Account EC2 Status Monitoring for HPC Clusters Template
Streamlining high-performance computing cluster management across AWS accounts for best efficiency and customized monitoring with the Cross-Account EC2 Status Monitoring for HPC Clusters Template.
Available on Enterprise, Business, Education plans.
About the Cross-Account EC2 Status Monitoring for HPC Clusters
The Cross-Account EC2 Status Monitoring for HPC Clusters Template is an invaluable tool for administrators managing High-Performance Computing (HPC) clusters across multiple AWS accounts. It offers a centralized dashboard for monitoring the status, health, and performance of EC2 instances, ensuring optimal operation of HPC clusters. This template is designed for flexibility, allowing customization to meet the specific needs of various HPC cluster configurations.
How to use the Cross-Account EC2 Status Monitoring for HPC Clusters Template
Configuration: Customize the template settings according to your HPC cluster's architecture. This involves selecting EC2 instances for monitoring, defining thresholds for health and performance metrics, and setting up notification alerts.
Monitoring and analysis: With the template configured, you can monitor the EC2 instances' status across all linked AWS accounts in real-time. The dashboard provides immediate data for identifying potential issues.
Maintenance and optimization: Use the insights from the template to perform routine maintenance and optimization of your HPC clusters. This proactive approach helps maintain high performance and minimize downtime.
Why use the Cross-Account EC2 Status Monitoring for HPC Clusters Template
Today's complex cloud environments make it challenging to manage High-Performance Computing (HPC) clusters across multiple AWS accounts. The Cross-Account EC2 Status Monitoring for HPC Clusters Template simplifies this task by providing a centralized solution for monitoring the health and performance of EC2 instances. This template aims to enhance visibility, improve efficiency, offer customization and flexibility, and enable proactive management of HPC clusters. By using this template, administrators can ensure that their HPC clusters operate at optimal efficiency, reducing downtime and maintaining high performance.
Enhanced visibility: Achieve a comprehensive view of your EC2 instances across multiple AWS accounts from a single dashboard.
Improved efficiency: Quickly identify and resolve issues to reduce downtime and ensure your HPC clusters run efficiently.
Customization and flexibility: Adapt the template to suit the unique requirements of your HPC clusters, regardless of size or complexity.
Proactive management: Leverage detailed analytics for proactive maintenance, optimizing your clusters for high performance.
This template is essential for managing HPC clusters in complex, multi-account AWS environments, providing enhanced visibility, efficiency, customization, and proactive management capabilities.
Get started with this template right now. Available on Enterprise, Business, Education plans.
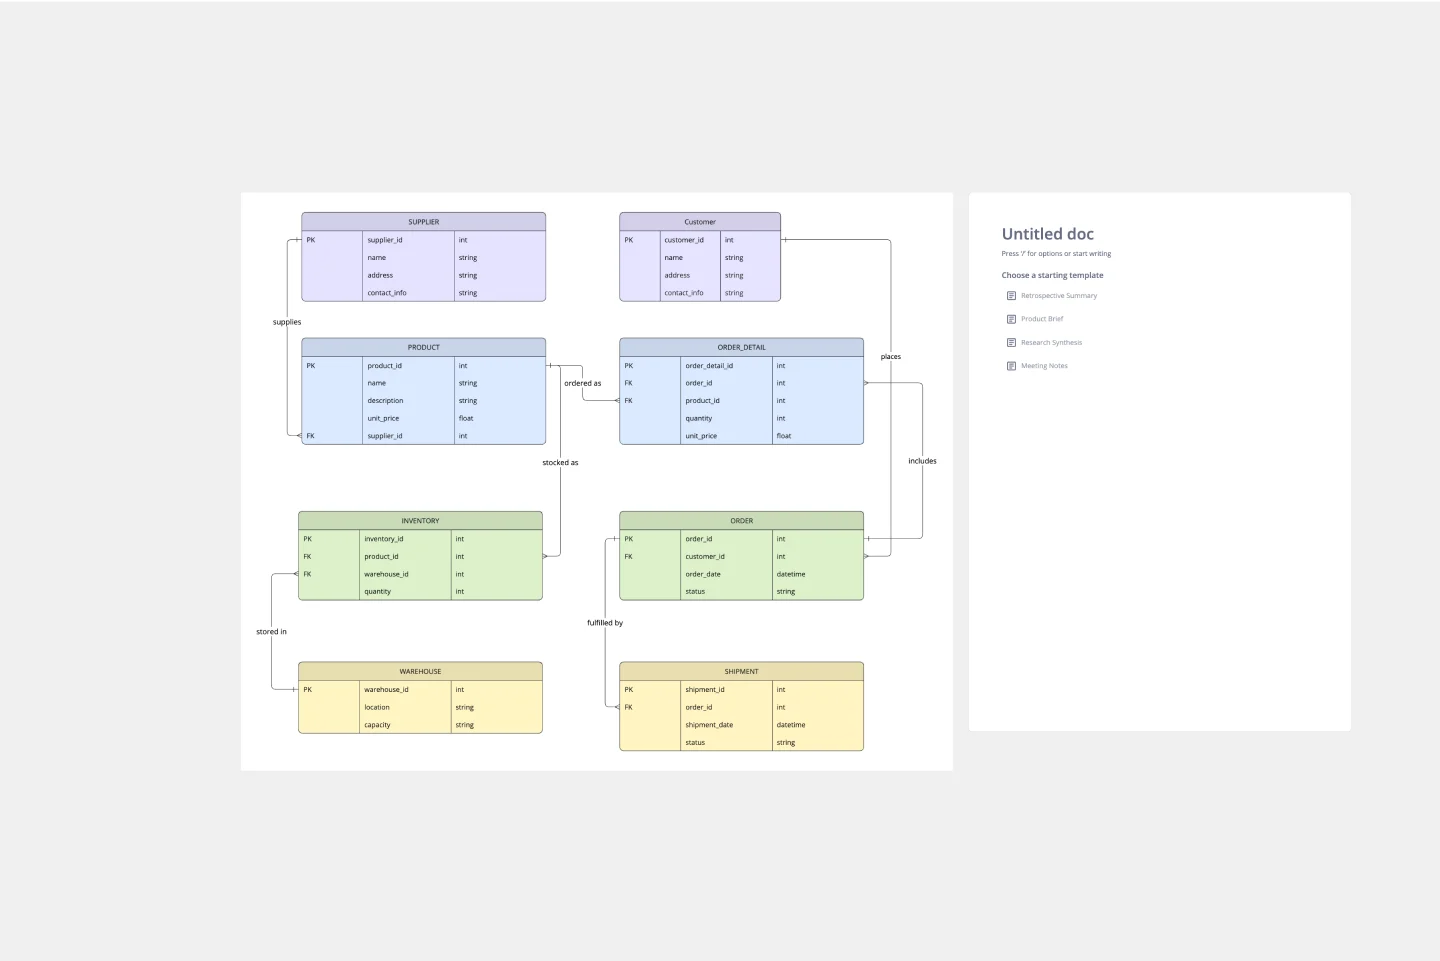
ERD Supply Chain Management System Template
Works best for:
ERD
The ERD Supply Chain Management System Template streamlines and optimizes supply chain operations. It serves as a visual support that helps businesses understand and manage the complex relationships between different entities within their supply chain, such as suppliers, products, inventory, orders, and shipments. By providing a clear visualization of these relationships, the template enables users to identify inefficiencies and areas for improvement, facilitating strategic decision-making.
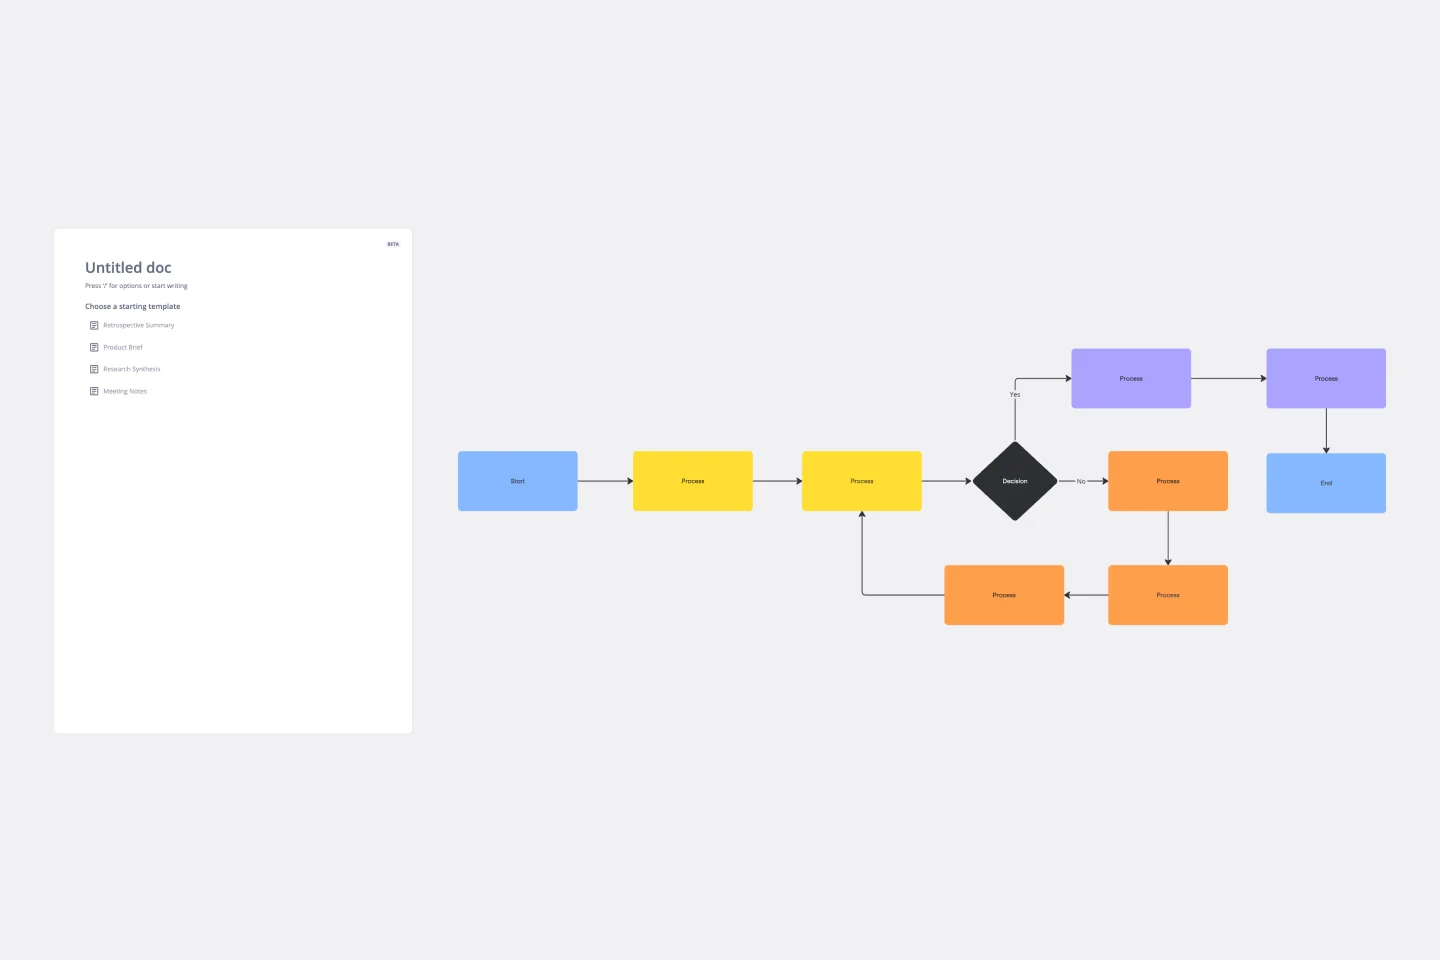
Flowchart Template
Works best for:
Flowcharts, Mapping, Diagrams
Trying to explain a process or workflow to your team — or just wrap your head around it yourself? Sometimes the best way is to see it, and that’s when you create a flowchart. Using common shapes (generally just ovals, rectangles, diamonds, and arrows), a flowchart shows you the direction a process or workflow goes and the order of steps. Beyond giving you a clear understanding, you’ll also be able to see potential flaws and bottlenecks, which helps you refine and improve your process and create a better product more efficiently.
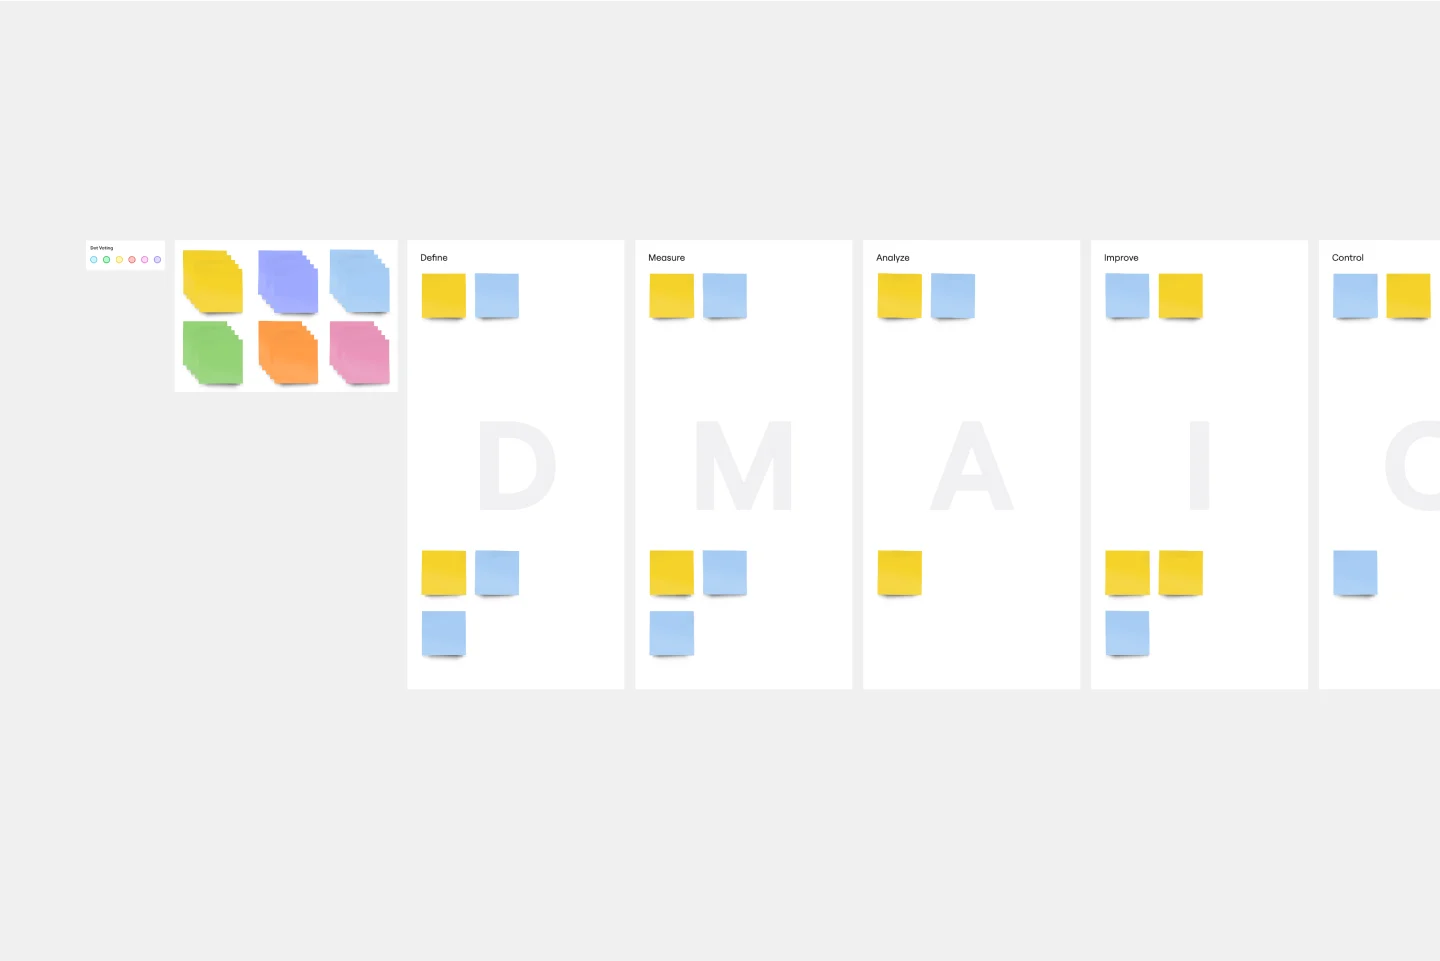
DMAIC Analysis Template
Works best for:
Agile Methodology, Design Thinking, Operations
Processes might not seem like the funnest thing to dive into and examine, but wow can it pay off—a more efficient process can lead to serious cost savings and a better product. That’s what DMAIC analysis does. Developed as part of the Six Sigma initiative, DMAIC is a data-driven quality strategy for streamlining processes and resolving issues. The technique is broken into five fundamental steps that are followed in order: Define, Measure, Analyze, Improve, and Control.
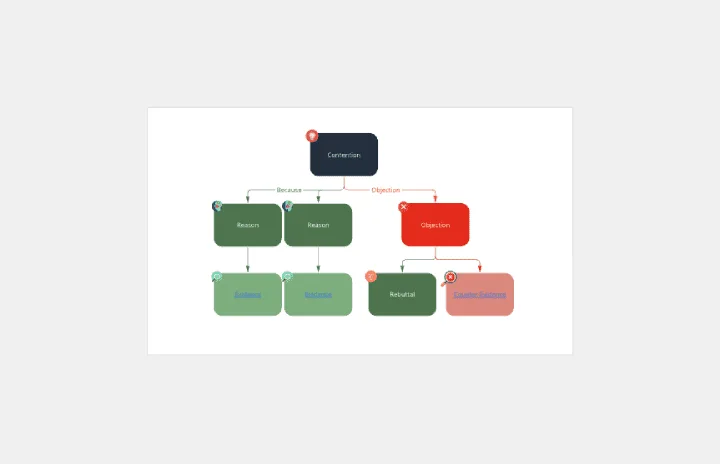
Argument Map
Works best for:
Diagramming
The Argument Map template is a visual tool for structuring and analyzing arguments and debates. It provides a structured framework for capturing premises, conclusions, and logical relationships. This template enables teams to explore complex issues, identify strengths and weaknesses in arguments, and make informed decisions. By promoting clarity and critical thinking, the Argument Map template empowers teams to navigate debates and discussions effectively, fostering consensus and understanding.
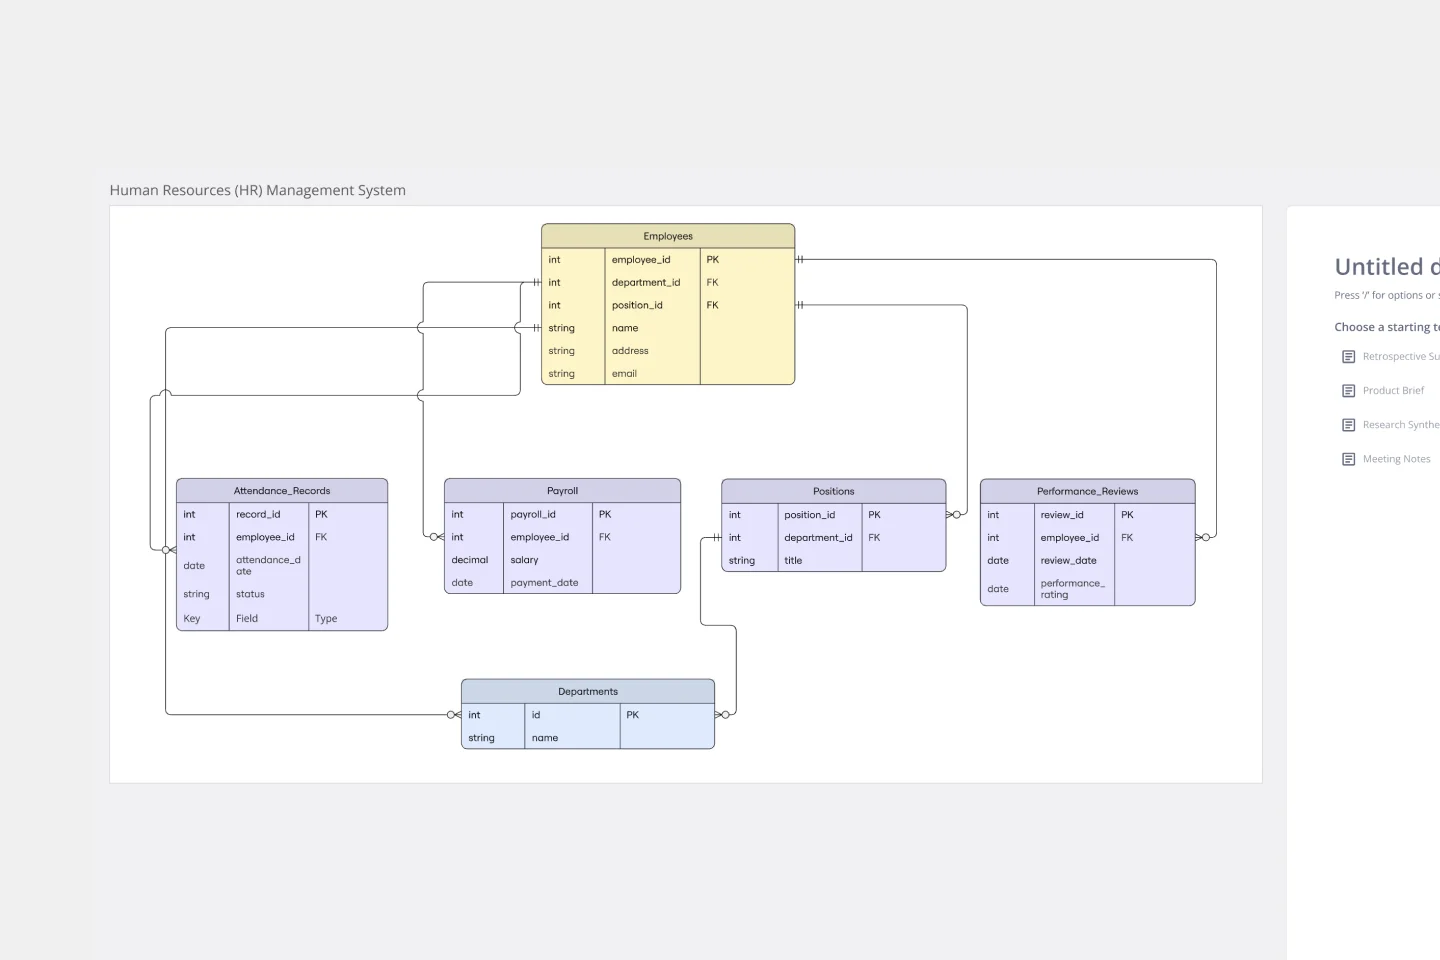
Entity–Relationship Diagram (ERD) HR Management System Template
Works best for:
ERD
The Entity–Relationship Diagram (ERD) HR Management System Template in Miro is designed to streamline the management of employee-related information and processes within an organization. This template allows for the visualization and organization of complex HR systems, making it easier to understand relationships and processes. It enables users to map out departments, positions, and employee details, including attendance records, payroll, and performance reviews.
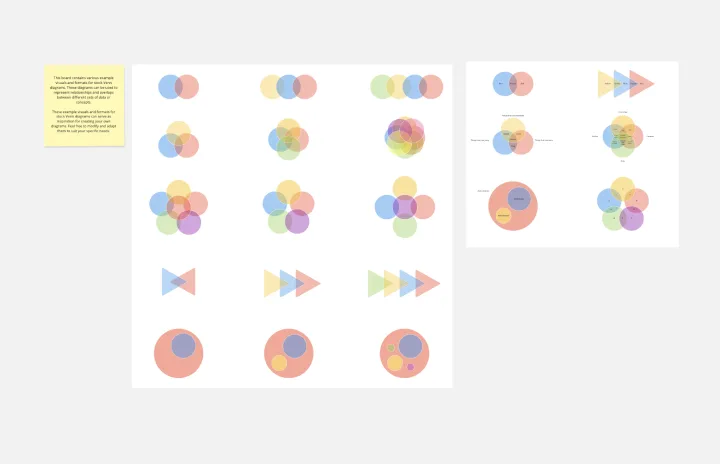
Venn Diagrams by Dave Westgarth
Works best for:
Venn Diagram
Visualize relationships and intersections clearly with the Collection Venn Diagram template. This tool is perfect for comparing multiple sets of data, identifying commonalities, and showcasing unique elements. Use it in presentations, research, and data analysis to make complex information more digestible. Ideal for educators, researchers, and analysts seeking to present data insights effectively.