Lean Business Model Scorecard
The Lean Business Model Scorecard (LBMSC) is a practical framework designed to help teams align their goals and track what matters most. It brings together the North Star Metric, Business Model Canvas, and Balanced Scorecard to break big-picture objectives into clear, actionable metrics. The result is a straightforward way to stay focused, measure progress, and keep everyone on the same page.
✨ What’s the LBMSC All About?
The LBMSC is a strategic framework that blends three powerhouse tools:
North Star Metric (NSM) from Lean Analytics – Your guiding light for delivering core customer value.
Business Model Canvas – A structured way to map out key business elements like value propositions, customer segments, and revenue streams.
Balanced Scorecard – A holistic approach to aligning KPIs across financial, customer, internal processes, and learning perspectives.
By connecting these elements, the LBMSC breaks down your overarching NSM into actionable One Metric That Matters (OTM) for each business area—helping you track what’s important and drive growth with purpose.
🎯 What Can This Template Help You Achieve?
Strategic Alignment: Connect every team’s efforts to your big-picture goals.
Clarity and Focus: Zero in on the key metrics that truly move the needle.
Smarter Decision-Making: Visualize data and track progress for informed action.
Agility and Growth: Stay flexible, iterate faster, and adapt to market changes.
👥 Who’s This Template For?
Startups and Scale-ups looking to nail down growth strategies.
Product and Marketing Teams wanting a clear view of how activities impact business goals.
Leadership and Ops Teams aiming to align performance metrics across departments.
Basically, anyone who loves strategic clarity and hates siloed thinking!
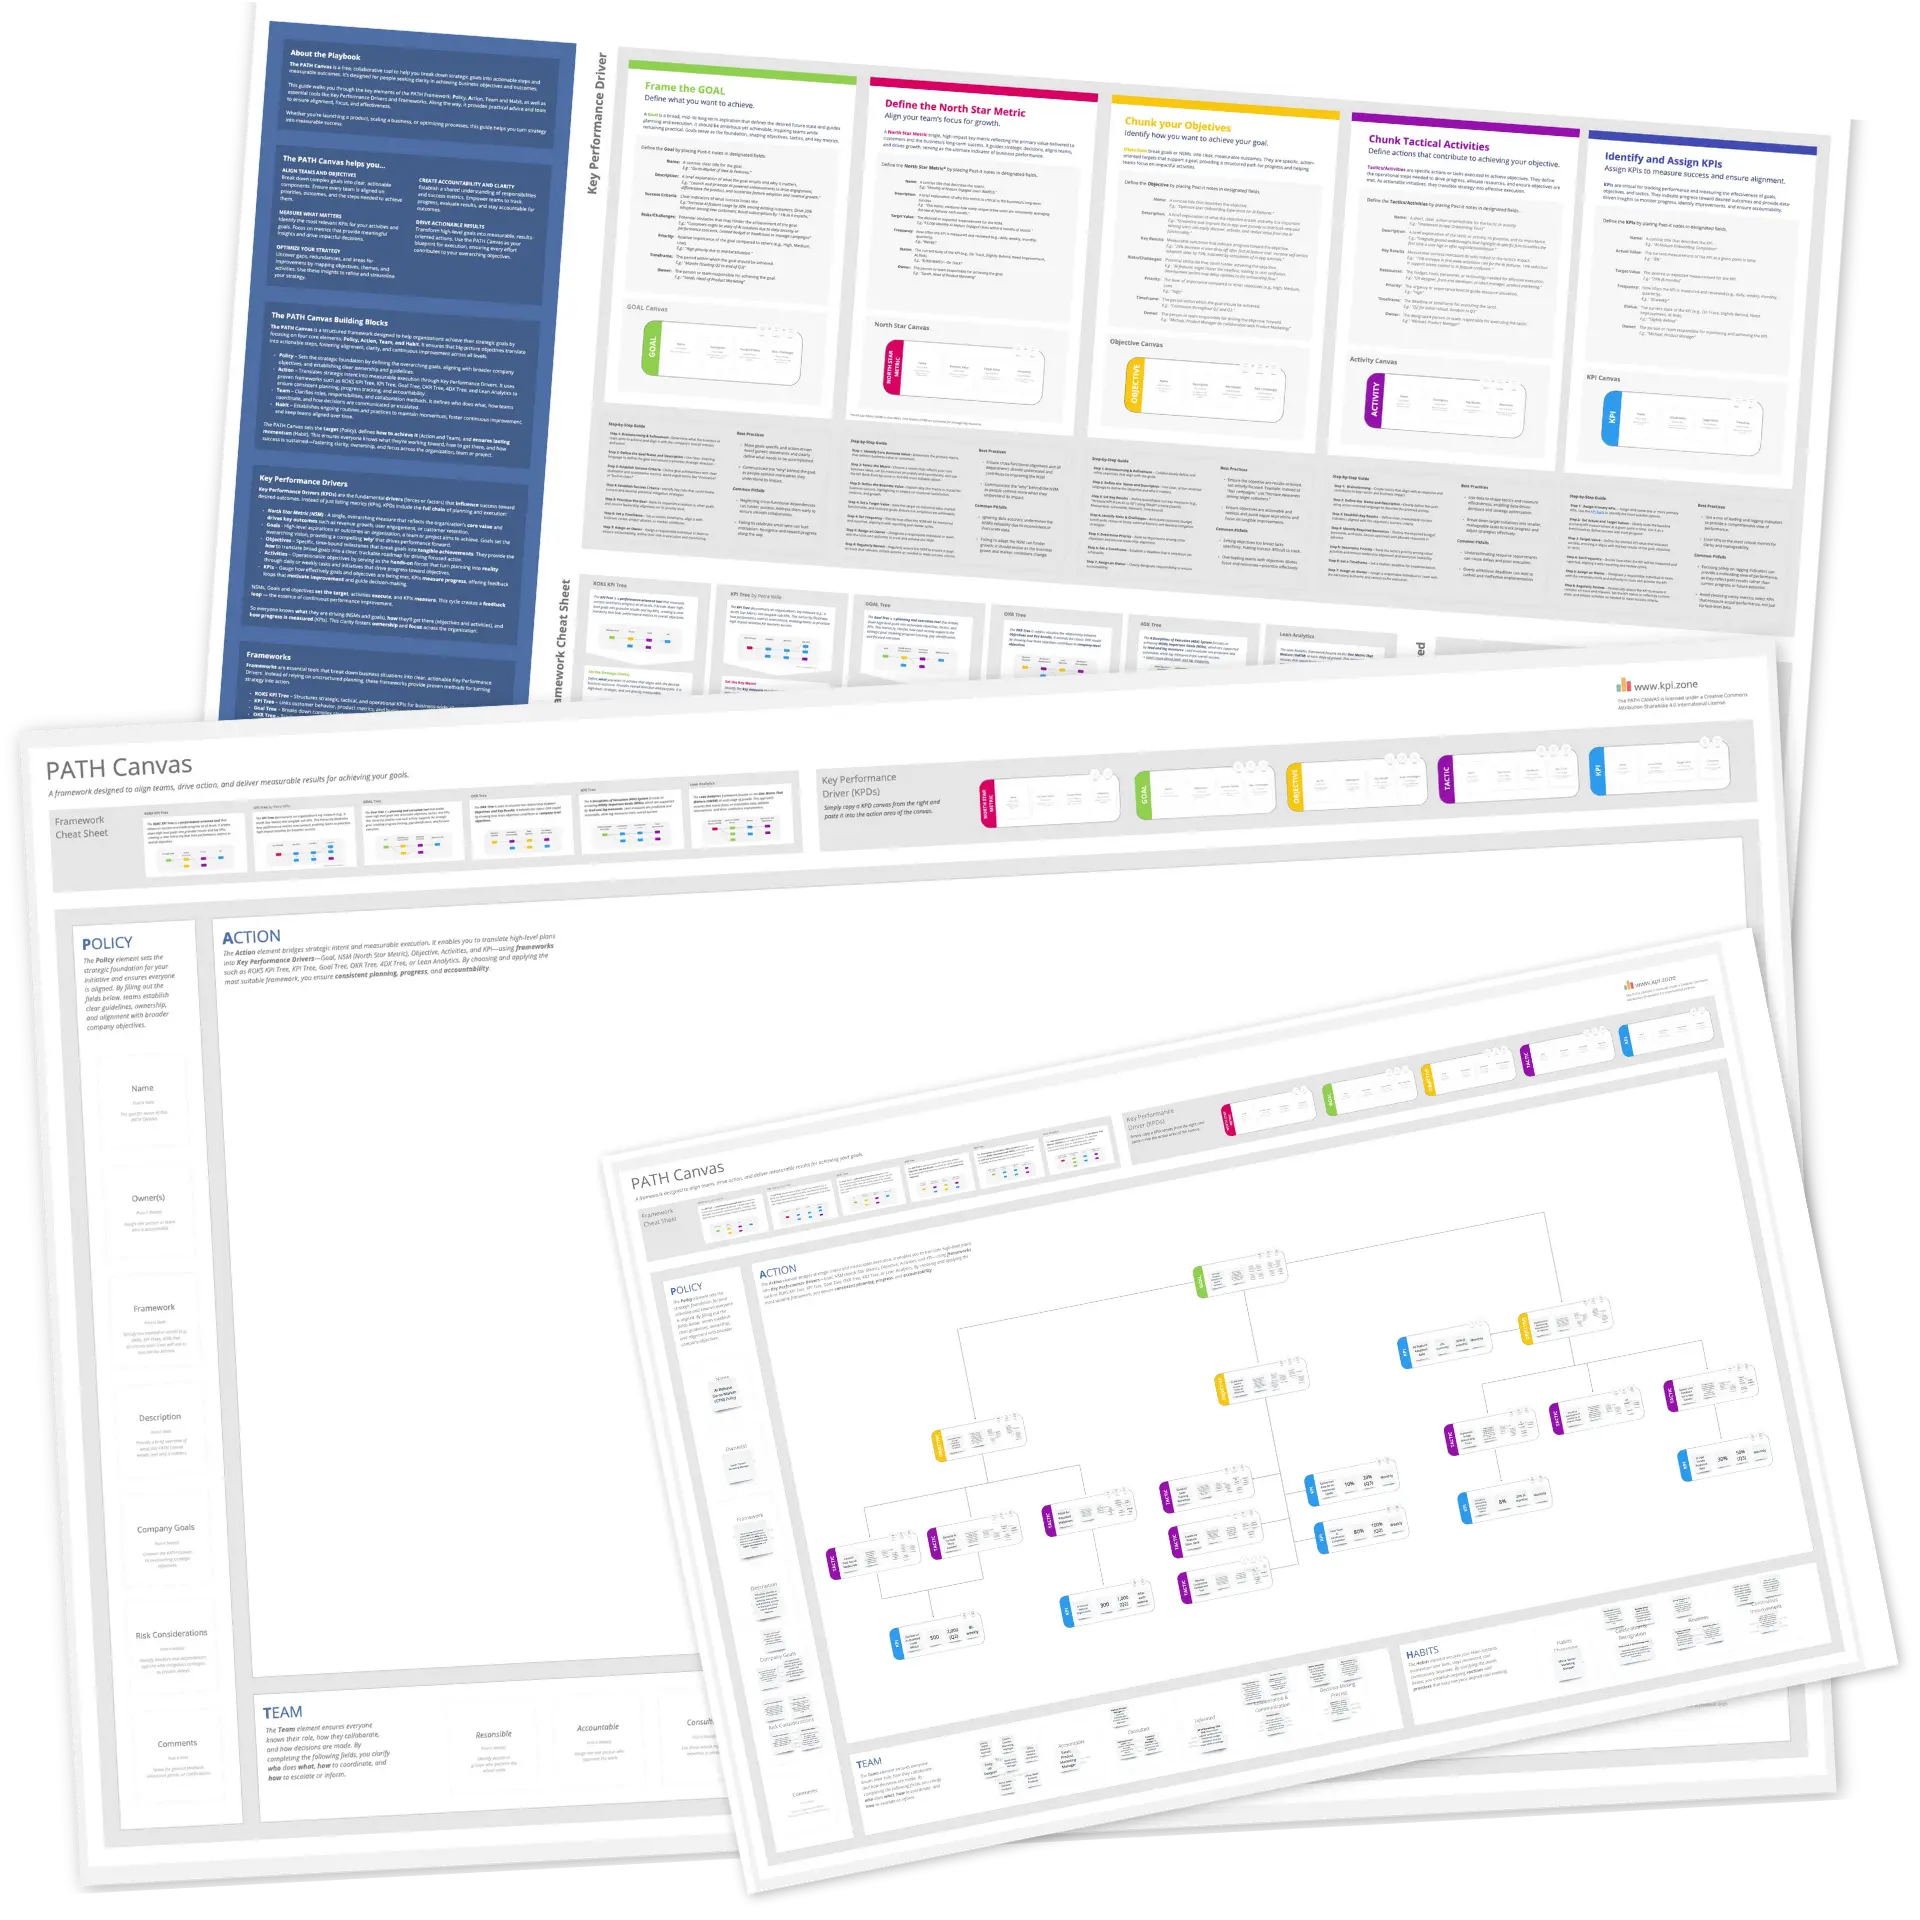
🛠️ How to Use the Template
Define Your North Star Metric (NSM): Start by identifying the single most important metric that captures the value you provide.
Map Out OTMs: For each key area in your business model, choose the one metric that matters most to its success.
Layer in Supporting Metrics: Add KPIs and other supporting data to give more context and depth.
Visualize and Monitor: Use Miro to build an interactive dashboard—easy to read, easy to update.
Review and Iterate: Set regular check-ins to adjust, refine, and ensure everyone stays aligned.
Hope you find it useful! Feel free to share any feedback or suggestions—always happy to improve it.
Categories